District Energy Use Patterns and Potential Savings in the Built Environment: Case Study of Two Districts in Seoul, South Korea
Abstract
Energy efficiency is vital to improve energy security, environmental and social sustainability, and economic performance. Improved energy efficiency also mitigates climate change by lowering greenhouse gas (GHG) emissions. Buildings are the single largest industrial consumer of energy and are therefore key to understanding and analyzing energy consumption patterns and the opportunities for saving energy at the district level in urban environments. This study focused on two representative boroughs in the major metropolitan area of Seoul, South Korea as a case study: Gandong-gu, a typical residential district, and Jung-gu, a typical commercial district. The sources of the energy supplied to the boroughs were determined and consumption patterns in different industry sectors in Seoul used to identify current patterns of energy consumption. The study analyzed the energy consumption patterns for five different building categories and four different sectors in the building using a bottom-up energy modeling approach. Electricity and gas consumption patterns were recorded for different building categories and monthly ambient temperatures in the two boroughs. Finally, a logarithmic equation was developed to describe the correlation between commercial activity and cooling energy intensity in Jung-gu, the commercial district. Based on these results, recommendations are made regarding the current energy consumption patterns at the district level and government energy policies are suggested to reduce energy consumption and, hence, greenhouse gas emissions, in both commercial and residential buildings.
Keywords:
Energy efficiency, Bottom-up approach, Seoul, Heating, Cooling, Energy saving policies1. INTRODUCTION
Energy challenges and security have raised concerns worldwide over dwindling supplies of fossil fuels and clearly discernible climate change and global warming by greenhouse gas (GHG) emissions. At present, traditional fossil fuels - mainly oil, natural gas and coal - continue to be the dominant sources of primary energy. According to the International Energy Agency (IEA) (2009), fossil fuels contributed about 81.5% of the world’s total primary energy supply in 2007 and were expected to account for almost 77% of the anticipated overall increase in energy demand between 2007 and 2030 (IEA, 2009). In South Korea (officially known as the Republic of Korea), fossil fuels provide the major energy sources (total-84.2%: Gas-42.1%, Coal-28.2%, and Natural Gas-13.9%), along with a significant contribution of 13.1% from nuclear energy (KEMCO, 2011; Geem and Roper, 2009). However, consuming fossil fuels to generate energy or electricity inevitably produces environmentally undesirable waste products due to impurities in the fuel, especially particulates and various gases such as sulfur dioxide, nitrogen oxides, volatile organic compounds, and greenhouse gases (Pérez-Lombard et al., 2008; IPCC, 2007). In the United States, energy-related activates in the built environment account for over 85% of humangenerated greenhouse gas emissions, mostly in the form of carbon dioxide emissions from burning fossil fuels (USEPA, 2011). These waste products have a serious adverse effect on our environment, causing air pollution, water and land pollution and, ultimately, global warming.
The gases emitted when fossil fuels are burned result in climate changes that include rising sea levels due to the widespread melting of snow and ice, temperature increases, extreme weather events (typhoons and hurricanes), and the melting of Arctic glaciers (Gustavsson et al., 2010; IPCC, 2007). These negative effects have been widely recognized by many national and international organizations, including the United Nations. One of the major efforts to address these issues is the United Nations Framework Convention on Climate Change (UNFCCC), an international environment treaty with the stated goal of “stabilizing greenhouse gas concentrations in the atmosphere at a level that would prevent dangerous anthropogenic interference with the climate system” (UN, 1992). At the UNFCCC meeting in 1997, the Kyoto Protocol was adopted to set binding targets for 37 industrialized countries and the European community aimed at reducing GHG emissions. The Copenhagen Summit, held in 2009, developed this further to create a framework for climate change mitigation beyond 2012. As of January 31, 2010, 141 countries, including the 27 members of the EU, had engaged with the Copenhagen Accord, representing 87.24% of global emissions (USCAN, 2011). These countries are making significant efforts to reduce GHG emissions by implementing public policies supporting “green” energy production, applying carbon taxes and tariffs, and introducing energy saving strategies. Since buildings are significant consumers of energy, finding ways to reduce this energy consumption should be a priority.
The built environment consumes close to 40% of the world’s total energy, using it for climate control in buildings and to power appliances, lighting and other installed equipment (IEA, 2008). In South Korea, 22.3 % of the nation’s energy is used this way (KEMCO, 2011), making it one of the most important areas for efforts to reduce energy requirements and thus minimize the associated environmental, economic, security, and climate concerns. Making buildings more energy efficient would also support the objective of achieving sustainability, defined as: “Sustainability meets the needs of the present without compromising the ability of future generations to meet their own needs” by the Brundtland Commission of the United Nations (UN, 1987). Thus, the buildings in today’s high-density urban environments need to adopt energy policies that lower energy consumption, reduce GHG emissions and protect our environment.
Many studies have been conducted to identify how best to save energy in different types of building. Most recent research has focused on single building units, modeling different energy savings strategies for reducing energy consumption and GHG emissions with the aid of energy simulation tools and Life Cycle Assessment (LCA), while at the city and national level national statistics for energy consumption and GHG emissions have been analyzed. All of these approaches suffer from limitations for policy makers seeking to formulate policies supporting energy conservation and GHG emission reduction. To address these limitations, the current study compares energy use patterns and potential savings for the built environment at the district level by conducting case studies of two boroughs in Seoul, South Korea. Information and data was collected and analyzed on the sources of energy supplied to the districts, in this case electricity and natural gas, and the usage of energy in different sectors, including heating and cooling. Of particular interest was the correlation identified between commercial activities and cooling energy intensity. The findings of this study will help districts to develop and implement energy policies that reduce energy consumption and lower greenhouse gas emissions more effectively.
2. LITERATURE REVIEW
Our current pattern of energy consumption is unsustainable, and improving energy efficiency is the fastest, cleanest, and cheapest solution to the economic, security and climate changes we currently face. Improving energy efficiency will also lower greenhouse gas emissions in the built environment, an important consideration. To increase energy efficiency, various energy-modeling approaches have been applied to the built environment. One of the most widely used approaches utilizes energy simulation tools such as the DOE- 2 programs and Energy Plus to calculate the energy use and energy cost of a commercial or residential building given information about the local climate and the building’s construction, operation, utility rate schedule and heating ventilation, and air-conditioning (HVAC) equipment (Ahn et al., 2011; Ahn, 2010; USDOE, 2009a; USDOE, 2009b; Degelman Engineering Group, 2007; SWA, 2006). Energy simulations have been also used to compare the energy saving potentials of a number of different design types and/or systems, including the level of insulation, different roof types and so on (Ahn, 2010; USGBC, 2009). However, even though simulations can predict the energy use and cost for individual buildings, this approach suffers from serious limitations when it is applied to the estimation of regional and national energy consumption due to the need to collect a significant amount of highly detailed data, including building structure and design features for every type of structure present. Regression analysis is another popular modeling technique that is widely used for predicting energy consumption (Tso and Yau, 2007). In the regression method, energy performance is compared using a regression model that takes into account differences in functional and operational features (Xuchao et al., 2010). For example, Badr and Nasr (2001) conducted a regression analysis to identify the relationship between electrical energy consumption and climate factors in Lebanon, while Ahn (2010) used this approach to identify relationships between green building strategies and their energy consumption opportunities, along with their cost relationships. However, the major conceptual limitation of all regression techniques is that one can only ascertain relationships but can never be sure about the underlying causal mechanisms (Tso and Yau, 2007).
In addition to the modeling methods described above, two different approaches to energy modeling have dominated efforts to estimate energy consumption at the district, regional and national level. The first is top-down modeling, which is based on macroeconomic modeling principles and techniques and is intended to include all the important economic interactions of the society (Jacobsen, 1998). For example, in the topdown model energy demand can be determined by examining the historical relationship between energy prices and energy demand, based on the assumption that the behavior reflected in the estimated elasticity is constant. However, this approach treats the building sector as an energy sink and is not concerned with individual energy usages (Swan and Ugursal, 2009; Jacobsen, 1998). The top-down approach relies heavily on historical consumption information even though it is relatively easy to develop the model further to take into account information provided by macroeconomic indicators such as price and income, the pace of technology development, and the local climate (Swan and Ugursal, 2009).
In contrast, the bottom-up approach extrapolates the estimated energy consumption of representative sets of individual structure to regional and national levels utilizing two distinct methodologies: the statistical method and the engineering method (Swan and Ugursal, 2009; Jacobsen, 1998). This approach encompasses all models that use input data gathered from a hierarchal level that is less than that of the sector as a whole. The bottom-up model can account for the energy consumption of individual building structures and their function, or that for a group of similar structures, which is then extrapolated to represent the energy consumption at a regional or national level based on the representative weight of the modeled sample (Swan and Ugursal, 2009). Here we adopted the bottom-up approach to identify energy consumption patterns in the study areas by collecting the electricity and gas consumption data for all the structures in two boroughs in Seoul, South Korea.
3. METHODOLOGY
In order to identify the major sectors of energy demand and use patterns, the study first looked at energy consumption in five different sectors: industrial, transportation, public, residential, and commercial, by analyzing the national statistical data given in the Yearbook of National and Regional Energy Statistics and the Annual Oil Statistics. This analysis identified the largest energy users in South Korea and the city of Seoul and hence which would be the industry sector with the most potential for reducing energy consumption and lowering greenhouse gas emissions. Information was also collected on the city’s major energy consumers by examining the monthly electricity and gas bills for 2005 to develop a bottom-up energy model that included energy demand divided into its end uses, namely heating, cooling, lighting, hot water and so on. The collected energy consumption data were transformed to gigacalorie units from kilowatt hours (kWh) of electricity and cubic meters (m3) of gas for convenience. In addition to energy consumption data, the research team collected weather data from 25 weather stations across Seoul, recording hourly temperature data, relative humidity, precipitation, wind speed, and wind direction for 2005.
To identify the specific areas responsible for the energy demand in a building, this study first calculated the heating degree day (HDD) and cooling degree day (CDD) to measure the demand for energy related to heating and cooling both residential and commercial buildings. The calculated HDD and CDD were then used to define the areas of energy usage from the collected energy consumption data. The equations developed for HDD and CDD are as follows:
| (1) |
| (2) |
The end-use demand for energy, including heating, cooling, lighting, hot water and other uses, in an individual building was estimated using the following steps. First, the building’s energy consumption for each month was calculated by examining its power bills to identify the month with the minimum energy use. Second, the differences in energy consumption between the monthly energy use and the minimum monthly energy use were calculated. If the difference was zero, the monthly average temperature was assumed to be the base level temperature and the minimum monthly energy use could be divided into the electricity consumed by lighting and appliances (TV, refrigerator, computer, etc.) and gas consumption for cooking and hot water. When the monthly average temperature was lower or higher than the base level temperature, the differences between the energy used that month datum and the minimum monthly energy use were deemed to represent the energy required for heating and cooling, respectively. Fig. 1 shows the monthly energy consumption typically seen over a 12-month period and how energy use varies depending on the ambient temperature.
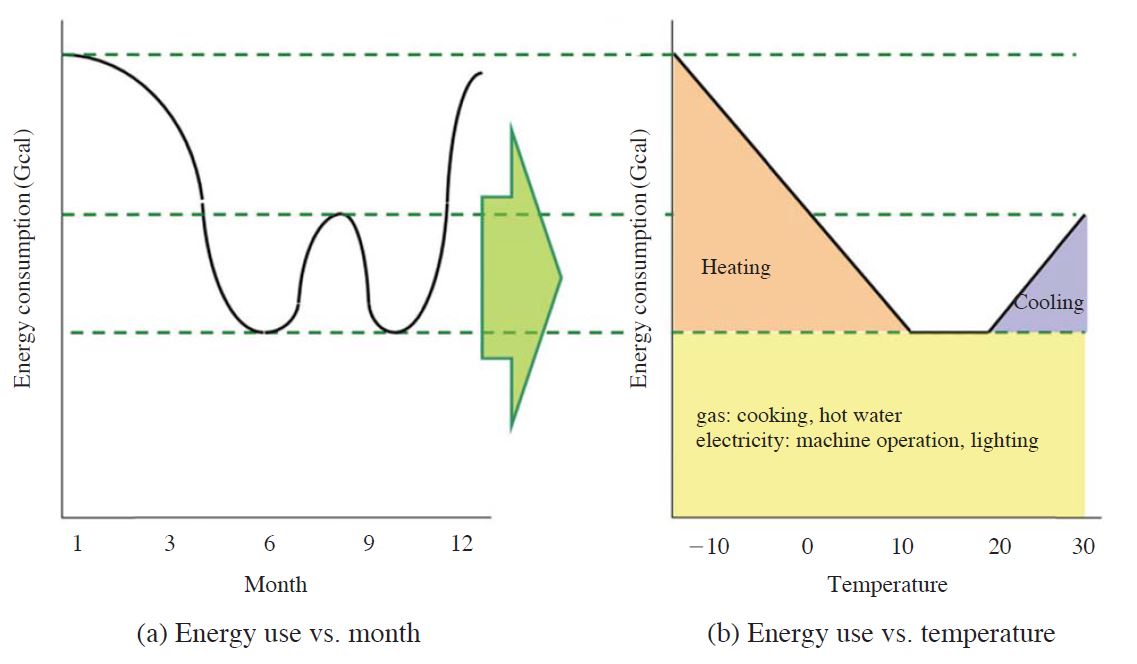
Energy consumption pattern of a typical building over 12 months and the relationship between energy use and ambient temperature.
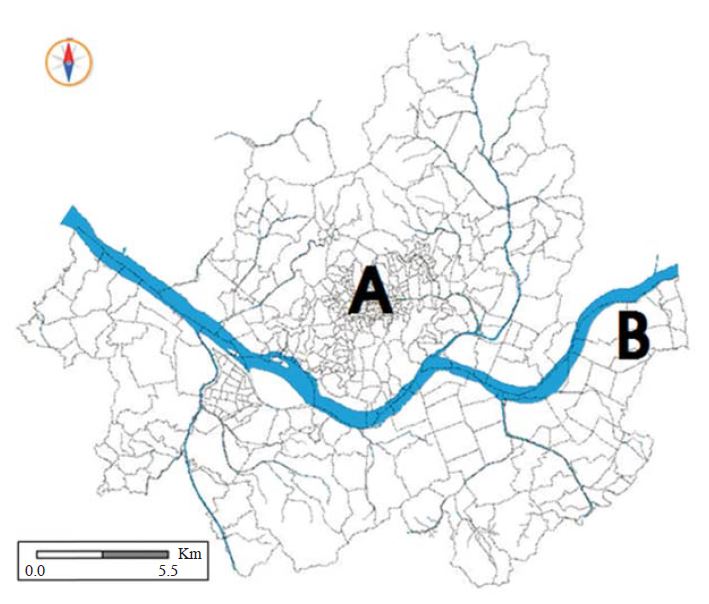
To identify district energy consumption patterns, the study selected two boroughs1. The first, Jung-gu (A in Fig. 2), is the historical center of the city with a central commercial function comprising mainly office buildings and department stores. Its relatively low population of around 135,173 residents is spread over an area of 9.96 km2. The second, Gandong-gu (B in Fig. 2), is located towards the east edge of Seoul. Gandonggu is a newly developed suburb within the city of Seoul and has a population of 501,776 and an area of 24.587 km2.
To analyze the building energy use patterns, the study categorized five different building types based on the building classification scheme used by the Korea Electric Power Corporation (KEPC), who supply electricity throughout Korea. These five building categories are:
- ㆍClass 1 - Detached residential houses and multi-family houses with less than 5 stories
- ㆍClass 2 - Multi-family houses with more than 5 stories (high-rise condominiums and apartments)
- ㆍClass 3 - Commercial buildings such as offices, shops and shopping malls, etc.
- ㆍClass 4 - Manufacturing facilities and associated buildings
- ㆍClass 5 - Public buildings such as civic centers and government buildings, hospitals, fire stations, etc.
Based on these five building classifications, this study developed a picture of the energy consumption patterns of each type for both electricity and gas. In addition to their energy consumption patterns, how this energy was distributed for different end uses in the building, for example heating, cooling, lighting, and hot water, was modeled using a FORTRAN algorithm. Finally, the relationship between commercial activity and cooling energy intensity was examined for Jung-gu, the central commercial borough.
4. RESULTS
4. 1 Energy Supply and Consumption Patterns
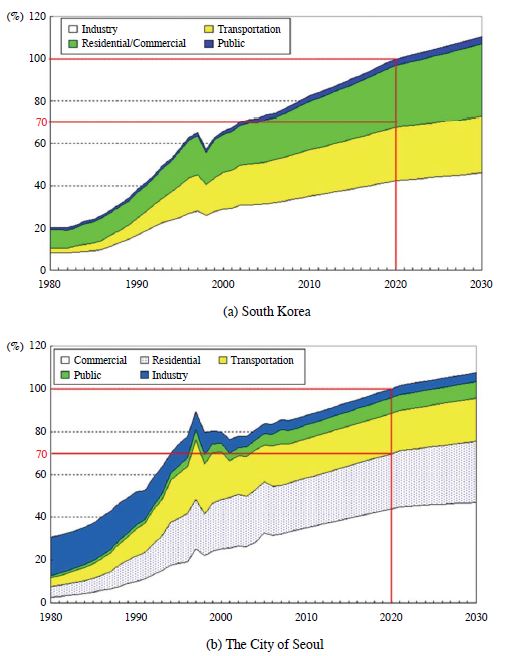
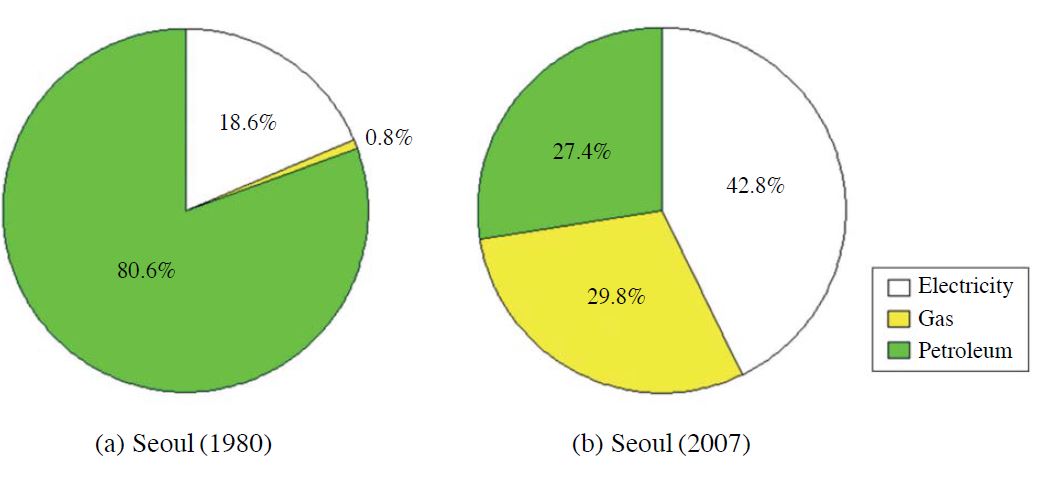
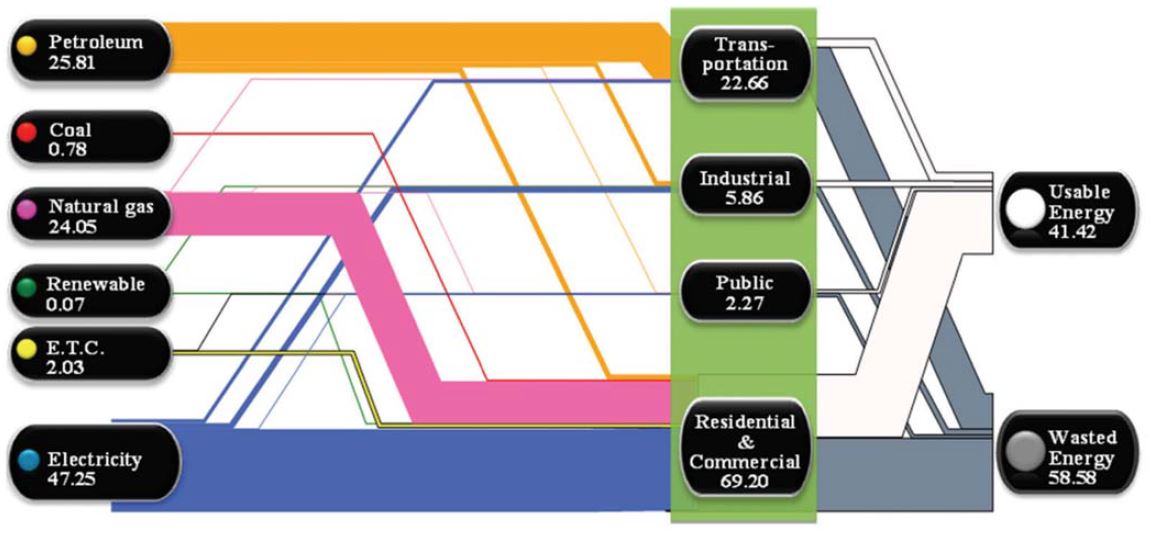
The total energy consumption in South Korea has significantly increased over thirty years in five industry sectors (Fig. 3), namely the industrial, transportation, residential, commercial, and public sectors, based on an analysis of the statistical data provided in the Yearbook of National and Regional Energy Statistics and the Annual Oil Statistics. The city of Seoul has similar patterns regarding the growth of energy consumption, even though the energy consumption of the industry sector has declined due to the relocation of much of the city’s heavy industry sector to other cities in South Korea. As the data presented in Fig. 3 clearly demonstrate, the building sector (commercial and residential buildings) is the single most important sector for reducing energy consumption in Seoul because this accounts for about 70% of the city’s total energy consumption and is also the fastest growing sector. Over the last thirty years there have been dramatic changes in the types of energy sources supplying the city of Seoul, with a major shift from petroleum to electricity and natural gas (Fig. 4). In 1980, petroleum provided around 80% of the energy used by the city of Seoul, with most of the remainder coming from electricity (18.6%). However, by 2007 electricity had become a major energy source (42.8%) along with natural gas (29.8%), while petroleum shrank to a mere 27.4%. As Fig. 5 shows, petroleum is now mainly consumed by the transportation sector, with natural gas and electricity serving as the main energy sources in the building sector, about 70% of the total. This analysis clearly demonstrates that the building sector has the potential to contribute significantly to efforts to lower energy consumption and reduce greenhouse gas emissions.
4. 2 Energy Consumption Patterns in Different Sectors in Buildings
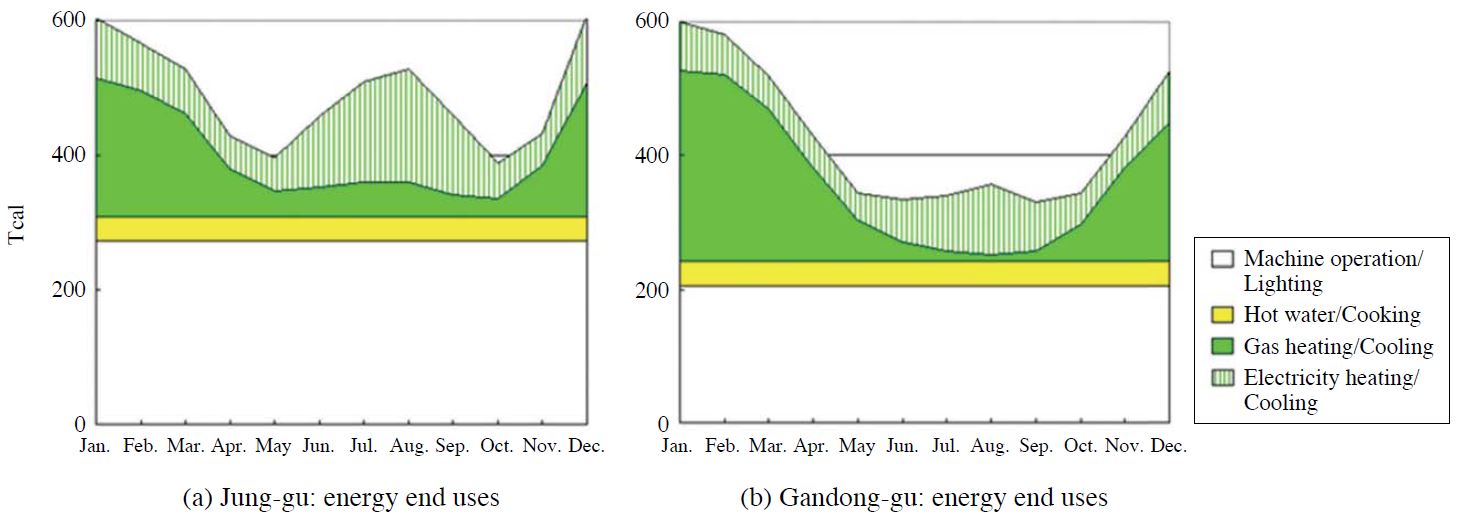
To identify district energy consumption patterns in the city of Seoul, the study selected two exemplary boroughs: Jung-gu, the city’s main commercial district, and Gandong-gu, a residential district. The study calculated energy consumption for the five different building types classified by the KEPC. The data in Fig. 6 reveal that Class 3, commercial office buildings, is the main energy consumer compared to the other building types in the borough. The peak summer energy consumption in Jung-gu was around 85% of the peak of winter energy consumption, indicating that energy consumption in the building sector is very consistent over the year. In Gandong-gu, a typical residential district, the building types in Classes 1 and 2 (detached residential houses and multi-family houses) were the main consumers of energy (about 70%), although the other sectors still consumed 30% of the energy. As Fig. 7(b) shows, the energy consumption in the summer months was significantly lower than the energy consumption in the winter months. The main contributors to lowering energy consumption in the summer months were the Class I and II buildings. However, the energy consumption of the other building types, Classes 3, 4, and 5, were very consistent over the year. This result indicates that the cooling load in the residential sector over the summer months was minimal compare to its heating load in the winter months.
The annual energy consumptions of four different sectors, namely lighting/machinery operation, hot water /cooking, gas heating/cooling and electricity heating/ cooling, are shown in Fig. 7. Applying the bottom-up approach indicates that the total energy consumption for Jung-gu was about 5,903 Tcal, consisting of 3,267 Tcal machinery operation/lighting, 443 Tcal for hot water/cooling, 1,121 Tcal for gas heating and cooling, and 1,072 Tcal for electricity heating and cooling. In Gandong-gu, total energy consumption was about 5,129 Tcal, consisting of 2,453 Tcal for machine operation/ lighting, 438 Tcal for hot water/cooking, 1,474 Tcal for gas heating and cooling, and 764 Tcal for electricity heating and cooling. Natural gas was the main energy source for heating in both boroughs. Interestingly, the electricity consumption in Jung-gu dramatically increased in the summer months even though the electricity consumption of Gandong-gu increased only slightly (Fig. 7). This result demonstrates that a significant amount of electricity in the commercial district was used for cooling to provide appropriate indoor environments for commercial buildings, while the cooling load in the residential sector was minimal compared to that in the commercial sector. The data in Figs. 6 and 7 show that the total energy consumption in the winter months is higher than the total energy consumption in the summer months.
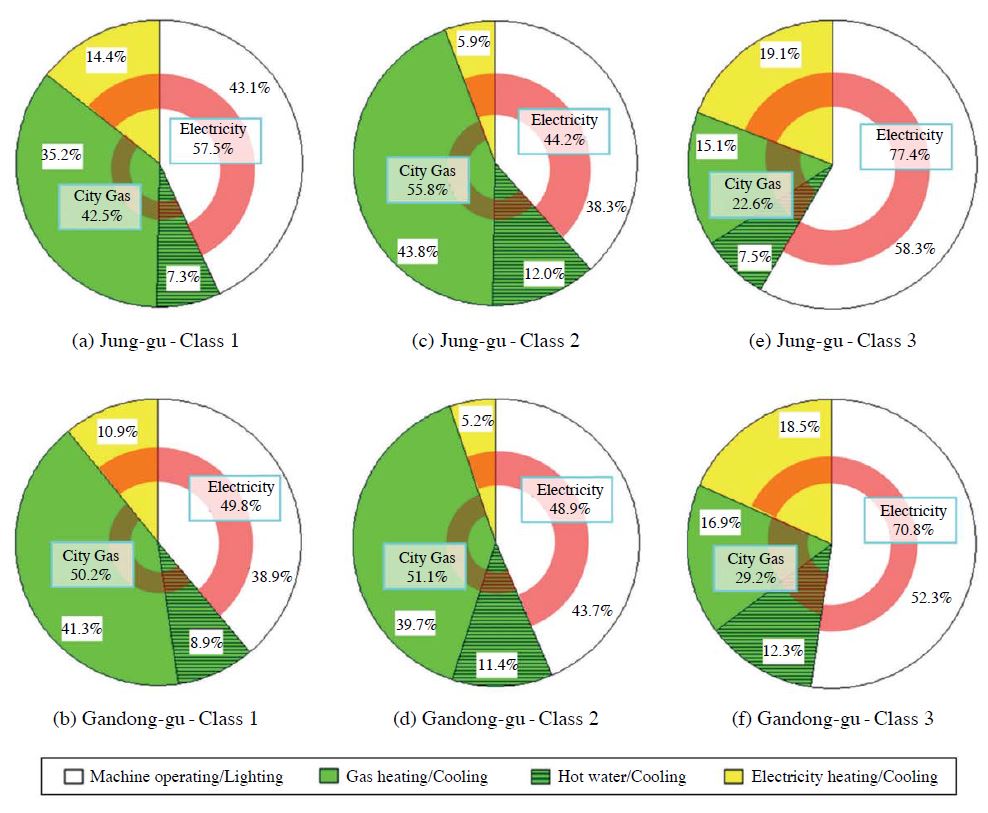
The study also examined the energy consumption patterns for three different building types for both boroughs and the results are shown in Fig. 8. In Gandong- gu, about 50% of the energy supplied to residential buildings in Classes 1 and 2 was electricity, with the other 50% coming from natural gas. In the Class 2 buildings (multi-family houses with over 5 stories), heating accounted for about 40% of the energy demand and cooling for only about 5% in both boroughs. For the commercial buildings, the energy consumption devoted to cooling increased significantly to about 19% and that for heating decreased to around 15%. This result indicates that the commercial buildings consumed a significant amount of electricity for cooling in order to maintain an appropriate indoor environment.
The study also analyzed the energy consumption patterns at different ambient temperatures and the results are shown in Fig. 9. Class 1 buildings in Gandong-gu consumed three times more gas over the winter months than those in Jung-gu and a very similar gas energy consumption pattern was found in the Class 2 buildings. These results confirm that gas energy used for heating in the winter months is a major energy use compared to cooling in residential buildings. However, Class 3 buildings in the borough of Jung-gu consumed significantly more energy than those in the borough of Gandong-gu because of the number of commercial buildings. In the Class 3 buildings, electricity was the main source for cooling these commercial buildings but gas also played a role as an energy source for cooling commercial buildings.
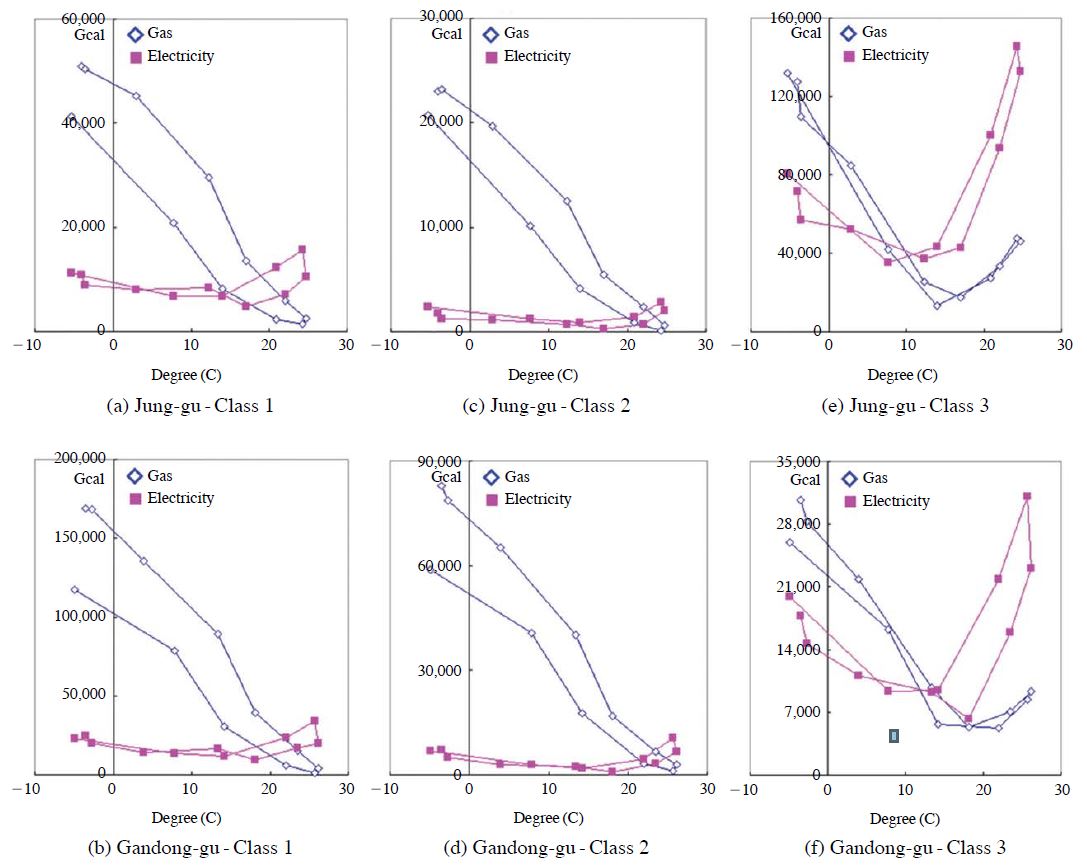
Heating and cooling load components of electric and gas consumption versus ambient temperature according to building class.
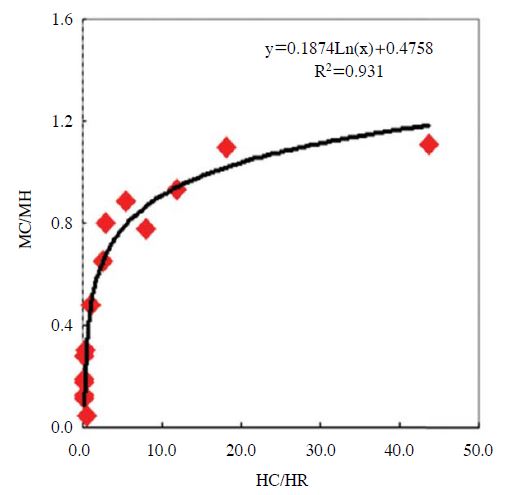
The study identified a clear correlation between the level of commercial activity and cooling energy intensity in the borough of Jung-gu. In Fig. 10, the y-axis represents the ratio of the maximum cooling (MC) monthly energy usage (in August) to the maximum heating (MH) monthly energy usage (in January). The x-axis is the ratio of the number of employees who work for commercial activities (HC) to the number of residents (HR). The log function equation shown in Fig. 10 and included as the solid line in the graph indicates that the increase in the HC/HR ratio due to higher levels of commercial activity substantially raises the ratio of MC/MH, with an R-square value for the curve of 0.931 indicating a good fit to the data.
5. DISCUSSION AND CONCLUSIONS
This study examined the energy consumption patterns of two boroughs in the city of Seoul, South Korea using the bottom-up approach. In this section the results are applied to suggest ways to develop and implement energy saving policies that will save energy consumptions in the district level and hence lower greenhouse gas emissions. By analyzing the energy consumption for four different industry sectors in the city of Seoul, the results indicated that buildings accounted for about 70% of all the city’s energy consumption. Therefore, in order to reduce energy consumption and green house gas emissions, the building sector clearly offers the most potential for savings. Most of the energy consumed in the building sector was supplied by electricity and natural gas. Energy saving policies and their implementation in the city of Seoul should therefore focus on these two energy sources.
The energy consumption in Jung-gu, the commercial district, revealed fairly consistent levels of energy demand throughout the year, although the highest peak occurred during the winter. The energy demand also picked up during the summer months due to the increased cooling loads in commercial buildings. Not surprisingly, commercial buildings were the major consumers of energy in the commercial district. This suggests that policy makers in commercial districts should develop and implement energy saving policies for commercial buildings, particularly with regard to heating and cooling. In contrast, the energy consumption pattern for the residential district Gandong-gu indicated that its highest energy demand season was the winter, when it was used for heating homes. However, energy demand for heating and cooling in the residential buildings was relatively low except for this heating peak in January, so this result indicates that energy demand in residential buildings is minimal in the city of Seoul for much of the year. However, over 70% of the total energy used in residential buildings went to heating, therefore, energy saving polices should concentrate on the energy consumed by heating rather than cooling.
Apart from heating, the energy use patterns indicated that the major energy consumption in residential buildings (Fig. 8) was related to machine operation & lighting and hot water/cooking. Over 50% of energy consumption was related to machine operation & lighting in commercial buildings; over 70% of the total energy consumption was electricity, with natural gas only accounting for about 20%. These results indicate that energy policies designed to save electricity in commercial buildings should focus on electricity consumption, while in the residential building sector both natural gas and electricity usage must be considered. For example, both types of building could reduce energy consumption in lighting and machine operation by using energy saving fixtures and appliances such as Energy Star products.
The analysis of gas and electricity consumption based on ambient temperature clearly shows that natural gas is the main energy source used for heating residential buildings (Fig. 9) and electricity is used to meet only a small portion of heating and cooling needs. However, although natural gas is the major source of heating, electricity still accounts for about 40% of the energy demand related to heating in commercial buildings. Electricity is the main energy source used to cool most commercial buildings, with natural gas accounting for just 22-25% of the energy demand for cooling. These results suggest that energy saving strategies to reduce the energy needed to heat residential buildings are key, while the commercial building sector must consider energy saving strategies to reduce the energy consumption related to both heating and cooling commercial buildings.
Finally, the study also found a strong correlation between commercial activity and demand related to cooling loads in commercial buildings. This result confirms that it is vital to consider energy saving strategies that reduce energy consumption in commercial buildings. The findings of this study suggest that it is important to understand energy consumption patterns in different building types and different end uses, including heating, cooling, lighting and hot water. In addition, in order to save energy and reduce emissions, it is crucial to develop and implement specific energy saving polices for different districts based on the predominant building types and energy consumption patterns of each.
Acknowledgments
This work was supported by the National Research Foundation of Korea Grant funded by the Korean Government (NRF-2012S1A5B8A03045234).
References
- Ahn, Y.H., (2010), The Development of Models to Indentify Relationships Between First Costs of Green Building Strategies and Technologies and Life Cycle Costs for Public Green Facilities, Ph.D., Virginia Tech, Blacksburg, VA.
-
Ahn, Y.H., Choi, Y.O., Koh, B.W., Pearce, A.R., (2011), Designing sustainable learning environments: Lowering energy consumption in a K-12 facility, Journal of Green Building,, 6(4), p112-137.
[https://doi.org/10.3992/jgb.6.4.112]

-
Badr, E.A., Nasr, G.E., (2001), On the Relationship between Electrical Energy Consumption and Climate Factors in Lebanon: Co-integration and Error-correction Models, International Journal of Energy Research, 25, p1033-1042.
[https://doi.org/10.1002/er.735]

- Degelman Engineering Group, (2007), Ener-Win Energy Simulation Software for Buildings, <http://pages.suddenlink.net/enerwin/%3E>. (July 10, 2009).
-
Geem, Z.W., Roper, W.E., (2009), Energy Demand Estimation of South Korea Using Artificial Neural Network, Energy Policy, 37, p4049-4054.
[https://doi.org/10.1016/j.enpol.2009.04.049]

-
Gustavsson, L., Joelsson, A., Sathre, R., (2010), Life cycle primary energy use and carbon emission of an eightstorey wood-framed apartment building, Energy and Buildings, 42(2), p230-242.
[https://doi.org/10.1016/j.enbuild.2009.08.018]

- IEA, (2008), Energy Efficiency Requirements in Building Codes, Energy Efficiency Policies for New Buildings, OECD/IEA, Paris, France.
- IEA, (2009), World Energy Outlook, International Energy Agency (IEA), Paris, France.
- IPCC, (2007), Climate Change 2007: Synthesis Report, Itergovernmental Panel on Climate Change, <http://www.ipcc.ch/pdf/assessment-report/ar4/syr/ar4_syr.pdf> (February 23, 2009).
- Jacobsen, H.K., (1998), Integrating the Bottom-up and Topdown approach to energy-economy modelling: The Case of Denmark, Energy Economics, 20, p443-461.
- KEMCO, (2011), 2011 Korean Energy Statistic, <http://www.kemco.or.kr/%3E>. (August 10, 2011).
-
Pérez-Lombard, L., Ortiz, J., Pout, C., (2008), A review on buildings energy consumption information, Energy and Buildings, 40(3), p394-398.
[https://doi.org/10.1016/j.enbuild.2007.03.007]

- SWA, (2006), NAVFAC Energy Policy Act of 2005 Study for the Academic and Headquarters Buildings, <http://www.wbdg.org/pdfs/epact_academic_hq_study.pdf%3E>. (October 10, 2008).
-
Swan, L.G., Ugursal, V.I., (2009), Modeling of End-use Energy Consumption in the Residential Sector: A Review of Modeling Techniques, Renewable and Sustainable Energy Reviews, 13, p1819-1835.
[https://doi.org/10.1016/j.rser.2008.09.033]

-
Tso, G.K.F., Yau, K.K.W., (2007), Predicting Electricity Energy Consumption: A Comparison of Regression Analysis, Decision Tree and Neural Network, Energy, 32, p1761-1768.
[https://doi.org/10.1016/j.energy.2006.11.010]

- UN, (1987), Our Common Future: Reprot of the World Commission on Environment and Development, <http://www.un-documents.net/wced-ocf.html>. (September 1, 2011).
- UN, (1992), United Nations Framework Convention on Climate Change, United Nations.
- USCAN, (2011), Who’s On Board With The Copenhagen Accord?, <http://www.usclimatenetwork.org/policy/copenhagen-accord-commitments-Note1>. (September 2, 2011).
- USDOE, (2009a), Energy Plus. U.S. Department of Energy, <http://apps1.eere.energy.gov/buildings/tools_directory/software.cfm/ID=287/pagename_submenu=energy_simulation/pagename_menu=whole_building_analysis/pagename=subjects> (January 10, 2009).
- USDOE, (2009b), The Home of DOE-2 based Building Energy Use and Cost Analysis Software, U.S. Department of Energy, <http://www.doe2.com/> (January 10, 2009).
- USEPA, (2011), Climate Change: Basic Information, <http://epa.gov/climatechange/basicinfo.html%3E>. (September 1, 2011).
- USGBC, (2009), LEED for New Construction, U.S. Green Building Council, <http://www.usgbc.org/DisplayPage.aspx?CMSPageID=220> (February 22, 2009).
-
Xuchao, W., Priyadarsini, R., Eang, L.S., (2010), Benchmarking Energy Use and Green House Gas Emissions in Singapore’s Hotel Industry, Energy Policy, 38, p4520-4527.
[https://doi.org/10.1016/j.enpol.2010.04.006]

