Estimate of Regional and Broad-based Sources for PM2.5Collected in an Industrial Area of Japan
Abstract
In order to estimate the influence of sources on PM2.5 in the industrial area of Japan, we carried out a source analysis using chemical component data of PM2.5. PM2.5 samples were collected intermittently at an industrial area in Japan from July 2010 to November 2012. Water soluble ions (Cl-, NO3 -, SO4 2-, Na+, NH4 + + +, K+, Mg2+, Ca2+), elements (Al, K, Ca, Ti, V, Cr, Mn, Fe, Ni, Cu, Zn, As, Cd, Sb, Pb), and carbonaceous species (OC, EC) of the PM2.5 (a total of 198 samples) were analyzed. Positive Matrix Factorization (PMF) model was applied to the data of those chemical components to identify the source of PM2.5. At this observation site, nine factors were extracted. The major contributors of PM2.5 were secondary sulfate 1, in which loading factors of SO4 2- and NH4 + + + were large (percentage source contribution: 20.9%), traffic, in which loading factors of OC (organic carbon) and EC (elemental carbon) were large (20.8%), secondary sulfate 2, in which loading factors of K and SO4 2- were large (8.0%), steel mills (7.8%), secondary chloride and nitrate (7.0%), soil (5.0%), heavy oil combustion (3.8%), sea salt (3.8%), and coal combustion (2.3%). The conditional probability function (CPF) and the potential source contribution function (PSCF) were carried out to examine the influence of a regional source and a broad-based source, respectively. CPF results supported local source influences such as steel mills, sea salt, traffic, coal combustion, and heavy oil combustion. PSCF results suggested that ships in the East China Sea, an industrial area of the east coastal region of China, and an active volcano in the Kyushu region of Japan were potential regional sources of secondary sulfate 1. Secondary sulfate 2 was affected by the burning of biomass fields and by coal combustion in Chinese urban areas such as Beijing, Hebei, and western Inner Mongolia. Source characterization using continuous data from one site showed a potential source representing fossil fuel combustion is affected both by regional and broad-based sources.
Keywords:
PM2.5, PMF, CPF, PSCF, Japan1.INTRODUCTION
Fine particulate matter of less than 2.5 micrometers of diameter (PM2.5) suspended in the atmosphere has a serious impact on human mortality as well as respiratory and cardiovascular disease (Schwartz et al., 2002; Dockery et al., 1993). The United States Environmental Protection Agency (EPA) established an air quality standard for daily and annual mean concentrations of PM2.5 in 1997 and strengthened the standard value in 2006 and 2012.
In Japan, the air quality standard for particles of less than 10 micrometers (suspended particulate matter, SPM) was established in 1972, and various reduction measures for particulate matter have been carried out (i.e., the emission limit, the Automobile NOx/PM Control Law, and traffic regulation of the diesel automobile). The air quality standard of PM2.5 was established in 2009 in Japan, and local governments are promoting the expansion of the auto-monitoring system for PM2.5 mass concentrations. On the other hand, PM2.5 contains various chemical components; the analysis of these chemical components is necessary for planning measures to reduce PM2.5. For this reason, Japan’s Ministry of the Environment mandated that local government must analyze the chemical components of PM2.5. Chemical component data are accumulated so that, in the future, they can be used to estimate the sources of PM2.5 using a technique such as source receptor modeling.
A source receptor model has been employed as an effective tool for estimating long-time sources of atmospheric particulate matter. Source receptor models frequently used to make source estimates of the atmospheric particulate matter are the Chemical Mass Balance (CMB) model and the Positive Matrix Factorization (PMF) model. Chemical component data of the source particles, called the source profile, are necessary for the CMB model. We can estimate the source contribution of one set of environmental measurement data by using this source profile (Watson et al., 1994). In contrast, in the PMF model, by statistically analyzing the many environmental measurement data, we can derive the number of sources as well as their source profiles and contribution concentrations (Paatero and Tapper, 1994, 1993). Since many sources of PM2.5 are unknown, and the generation process is complicated, the source estimate that applies the PMF model is preferable to that using the CMB model, which requires the source profile. The result of source apportionment using the PMF model is frequently reported (Mooibroek et al., 2012; Kim et al., 2004; Kim et al., 2003); however, there are few reports of analysis results in Japan. Iijima et al. (2008) have applied the CMB and PMF models to the monthly chemical component concentration data of the atmospheric fine particulate matter measured from 2003 to 2006 in the Kanto area of eastern Japan; they tried a source analysis technique that combined PMF with CMB. Their report offers information vital for understanding the characteristics of atmospheric fine particulate matter in Japan. Meanwhile, from the results of a three-dimensional air quality simulation, Chatani et al. (2011) reported that the sensitivity of foreign anthropogenic sources in PM2.5 was high in the Osaka-Hyogo area in western Japan as compared with that in 23 Tokyo wards. Hence, we believe that the sources of PM2.5 differ greatly between eastern and western Japan.
In order to understand the characteristics of the sources in an industrial area of western Japan, we applied the PMF model to the daily chemical component concentration data of PM2.5 from 2010 to 2012 in Himeji City in Japan. In addition, we estimated the position of the source using wind direction data and backward trajectory analysis. We expect that this report will be utilized for reducing the amount of PM2.5 in Japan.
2. METHODOLOGY
2. 1 Sample Collection and Chemical Analysis
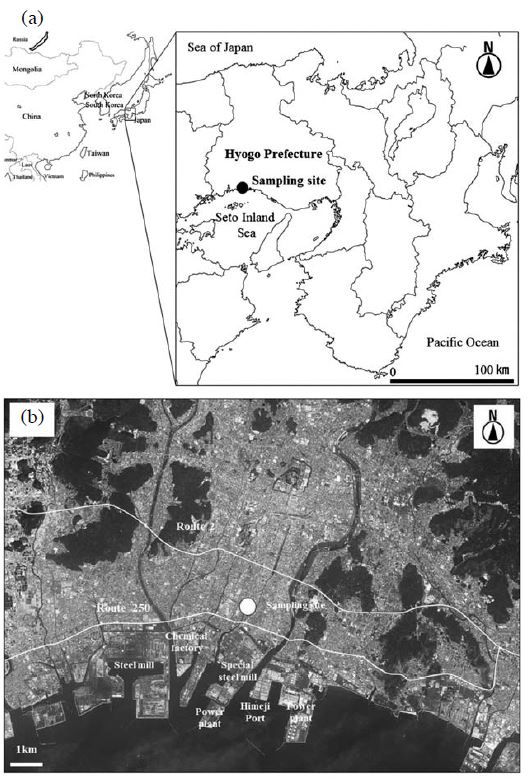
by the NILU (Norwegian Institute for Air Research) folder with a multi-nozzle cascade impactor (Tokyo Dylec Corp.) at a flow rate of 10 L/min. The multi-nozzle cascade impactor, equivalence with the Federal Reference Method of the EPA has been shown (Inoue et al., 2002). PTFE filters (Teflo 47 mm/Whatman 46.2 mm) and quartz filters (PALLEFLEX 2500QAT-UP 47 mm) were used to collect the PM2.5 samples. Samplings were carried out in succession for approximately 20 days during each season. Sampling collection terms are summarized in Table 1. A total of 198 samples analyzed for 25 species were collected between July 2010 and November 2012. The sampling site was established on a rooftop approximately 30m above the ground at the Shikama air pollution monitoring station (Shikama Citizen Center, 34.80N, 134.68E) in the coastal area of Himeji City, Hyogo Prefecture, Japan (Fig. 1(a)). The steel mills, thermal power plants, chemical facilities, etc. are located in the coastal industrial area. Moreover, the sampling site is located approximately 1.4 km south of National Route 2 and approximately 0.5 km north of Route 250 (Fig. 1(b)). The 24-hour traffic volume on Route 2 is approximately 120,000 vehicles, while that on Route 250 is approximately 34,000 vehicles. The percentages of heavy vehicles of traffic volumes of Route 2 and 250 were 21% and 9%, respectively (Ministry of Land, infrastructure, Transport and Tourism, 2010).
All PTFE filters were weighed to determine their mass before and after sampling using an ultra-micro balance (Sartorius SE 2-F, readability: 0.1 μg) at a constant temperature (21.5±1.5°C) and relative humidity (35±5%). Before use, the quartz fiber filters were heat treated by the electric furnace at 350 degrees for 1 hour. After sampling, half of each PTFE filter was analyzed for water-soluble ionic species (Cl-, NO3 -, SO4 2-, Na+, NH4 +, K+, Mg2+, Ca2+). The filter halves were extracted with 10 mL of ultrapure water, and the extracted solutions were analyzed with Ion Chromatography (Dionex ICS-2100). The other halves of the PTFE filters were analyzed for metallic elements (Al, K, Ca, Ti, V, Cr, Mn, Fe, Ni, Cu, Zn, As, Cd, Sb, Pb). Each was put into a high-pressure Teflon digestion vessel with 10 mL of HNO3, 2 mL of HF, and 1 mL of H2O2. It takes approximately 30 min for the microwave digestion system to digest the filters. After cooling, the solutions were dried to approximately 0.5mL and diluted to 10 mL with 2% HNO3. Elements were determined by inductively coupled plasma mass spectrometer (ICP-MS, Thermo X seriesII). A piece of each quartz filter was analyzed for organic carbon (OC) and elemental carbon (EC). OC and EC were analyzed by the IMPROVE (Interagency Monitoring of Protected Visual Environments protocol)/TOR (thermal optical reflectance) method using the OCEC Analyzer (Sunset Laboratory) (Chow et al., 2001). In addition, the standard deviations were calculated by analyzing repeat the blank filters. The detection limit was 3 times the standard deviation.
2. 2 Receptor Modeling
For the source apportionment of PM2.5 mass, the Positive Matrix Factorization (PMF) model (Hopke et al., 2003) was applied to the PM2.5 chemical component dataset. The PMF model is a receptor model based on a multivariate analysis technique that uses measurement error of the measured data to provide weights in the fitting process. The PMF model provides a solution that minimizes an object function, the Q value, based on the uncertainties of each observation (Polissar et al., 1998). We referred to Kim et al. (2003) for detailed descriptions of the PMF technique, and we used EPA-PMF3.0 for calculation (Norris et al., 2008).
2. 3 Conditional Probability Function (CPF)
When a source is near the sampling site, source contributionvariationsuggests a close relation to the wind direction surrounding the sampling site. The conditional probability function (CPF) (Kim et al., 2003) was performed to estimate the association of a local source and source contributions estimated from the PMF model coupled with the wind direction data. The CPF value is calculated using the following equation:
where mΔθ is the number of occurrences from wind sector Δθ that exceeded the threshold criterion, and nΔθ is the total number of data from the same wind sector. In this study, 16 sectors (Δθ=22.5°) were chosen; calm winds (≤1 m/s) were excluded from this analysis. In this study, the threshold criterion was set at the upper 10th percentile value of the fractional source contributions for each source.
2. 4 Potential Source Contribution Function(PSCF)
The potential source contribution function (PSCF) (Hopke et al., 1995; Ashbaugh et al., 1985) is utilized to estimate likely locations for long-range transportation of aerosols and secondary aerosols. The PSCF was calculated using the daily source contributions estimated by the PMF model, and the backward trajectories were calculated using the Hybrid-Single Particle Lagrangian Integrated Trajectory (HYSPLIT) model and the NCEP/GDAS global meteorological data (Draxler and Rolph, 2003). The PSCF is a conditional probability that an air parcel that passes through an area will have a concentration exceeding the threshold criterion upon arriving at the sampling site. The sources were likely to be located in areas that had high PSCF values. The PSCF value is calculated using the following equation:
where the nij is the total number of passages in the ijth grid cell, and mij is the number of passages in the same grid cell that are associated with samples that exceeded the threshold criteria. In this study, the threshold criterion was set at the upper 25th percentile value of the fractional source contributions for each source. Backward trajectories, starting every hour at heights of 1,300 and 1,800 m above ground level, were computed using the vertical velocity model for every sample day, producing 120 hourly trajectory end points per sample. The geophysical region covered by the trajectories was divided into 3,500 grid cells of 1°×1°latitude and longitude. To minimize the effect of small nij values that result in high PSCF values with high uncertainties, an arbitrary weight function W(nij) was applied to downweight the PSCF values for cells in which the total number of end points was less than three times the average number of passages per grid cell (Wan et al., 2009; Polissar et al., 2001; Hopke et al., 1995). W(nij) is defined by the following equation depending on nij:
3. RESULTS AND DISCUSSION
3. 1 Determination of the Factor Number by the PMF Model
A summary of statistics for the PM2.5 mass concentration and chemical species is shown in Table 2. An outlier of the PM2.5 mass concentration is difficult to reconstruct with the PMF model. Therefore, data deviating from the average-concentration range need to be examined using a method of analysis other than the PMF model. In this report, data with analytical precision problems were excluded using the ion balance and the chemical mass closure (CMC) model (Harrison et al., 2003). First, data in which the ratio of the anion equivalence concentration and the cation equivalence concentration did not fall within the ranges of 0.8-1.2 were excluded by confirming the ion balance of each sample. Second, the CMC model was used to determine the concentration of the chemical species of the data in which the ion balance was adequate. The CMC model is a method of estimating the mass concentration (EMC) of the ambient particulates from the concentration of the chemical species. The CMC model is expressed in the following equation:
Data in which the ratio of the EMC and the actual concentration measurement did not fall within the range of 0.8-1.2 were excluded from the PMF analysis. As a result, 165 samples were adopted for the PMF model. Furthermore, an ion and an element such as K+ and K (Ca2+ and Ca) overlapped. A lower percentage of below the detection limit (K and Ca2+) was adopted in order to reduce the loss of data used for PMF analysis. Concentrations below the detection limit level were replaced with a level half that of the detection limit (Polissar et al., 1998). A titanium (Ti) and chrome (Cr) proportion of more than 15% below the detection limit level was excluded from the calculation using the PMF model.
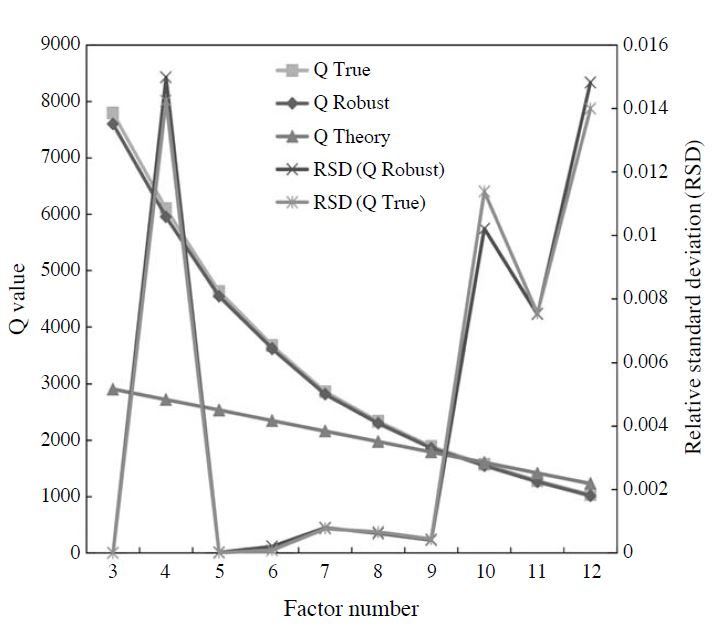
In the PMF analysis, dispersion of Q provided by a calculation repeatedly is small, and the number of factors nearby is most suitable for the theoretical value of Q (QTheory), where the value of Q is calculated using the following equation:
where n is the number of samples, and m is the number of components. The average and relative standard deviations (RSD) of the Q value provided by calculations repeated 20 times of each factor number with the QTheory are shown in Fig. 2. In this figure, QTrue is the value calculated using all data, and QRobust is the value calculated excluding outliers. The RSD of the QTrue and the QRobust had a small range of 5-9 factors, and the QTrue and QRobust of the 9 factors were nearest in the QTheory. Therefore, it was judged that the 9 factors were most suitable. To prove the validity of this result, the robustness and rotational freedom of the final solution were verified using a bootstrap run and an Fpeak run, respectively. The solution with 9 sources and Fpeak=-0.1 was the most reasonable. Furthermore, in the bootstrap run, all factors mapped at more than 80%.
3. 2 Source Apportionment and Identification
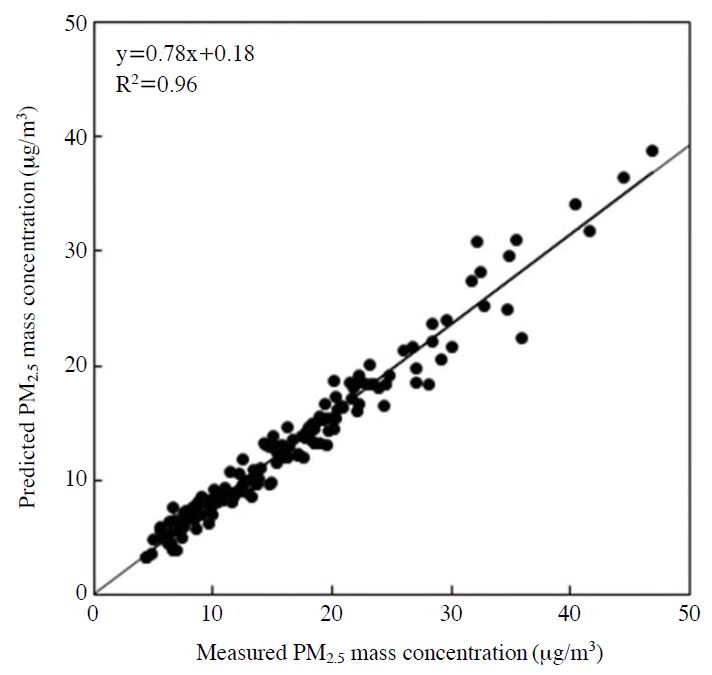
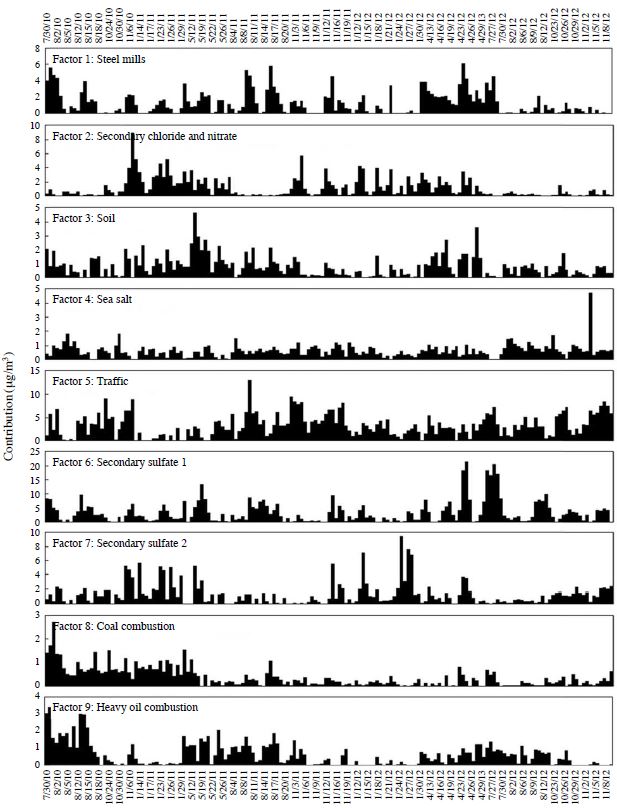
Correlation between the reconstructed mass concentrations from the factors extracted by PMF analysis and the measured value of the PM2.5 mass concentration is shown in Fig. 3. The slope of the regression line is 0.78, and the correlation coefficient is 0.96; the PM2.5 mass concentration is reconstituted well by extracted factors. The PMF-deduced source profiles and source contributions are presented in Fig. 4 and Fig. 5, respectively. In addition, the estimated source of each factor profile and the average contribution of each factor to the PM2.5 mass concentration are summarized in Table 3.
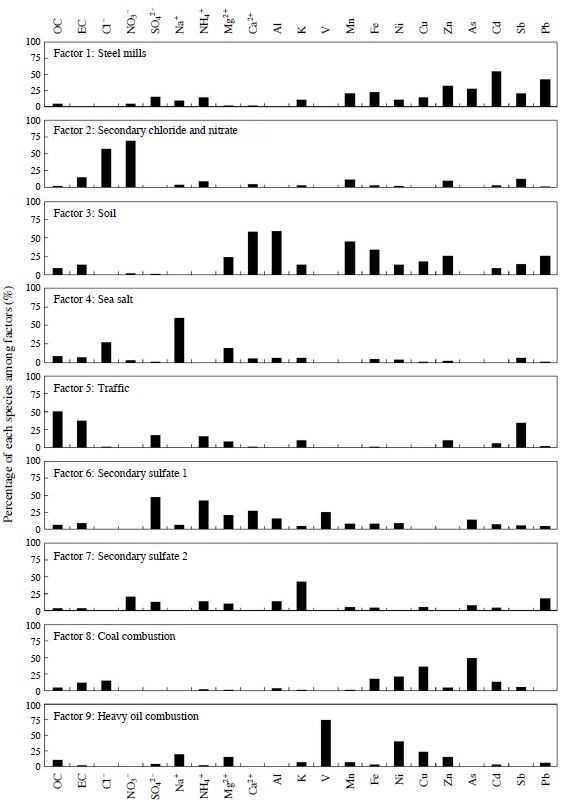
Source profiles based on PMF analysis. The vertical axis expresses the percentage of each species among factors.
Factor 1 contained large fractions of a host of metals. High concentrations of Zinc (Zn), lead (Pb), nickel (Ni), and cadmium (Cd) are mainly contributed by industrial activities such as coal and waste combustion (Marcazzan et al., 2001). Zn and Ni are also associated with steel mills and other metallic industrial activities (Song et al., 2001). The CPF plot for factor 1 is presented in Fig. 6(a). The CPF value of factor 1 was high from south-southwest to west-southwest. Since there are steel mills approximately 4.5 km westsouthwest and approximately 1.0 km south-southwest of the sampling site, it suggests that this factor was affected by the steel mills in the vicinity of the sampling site. The average contribution of factor 1 is 7.8%. This factor is categorized as “steel mills.”
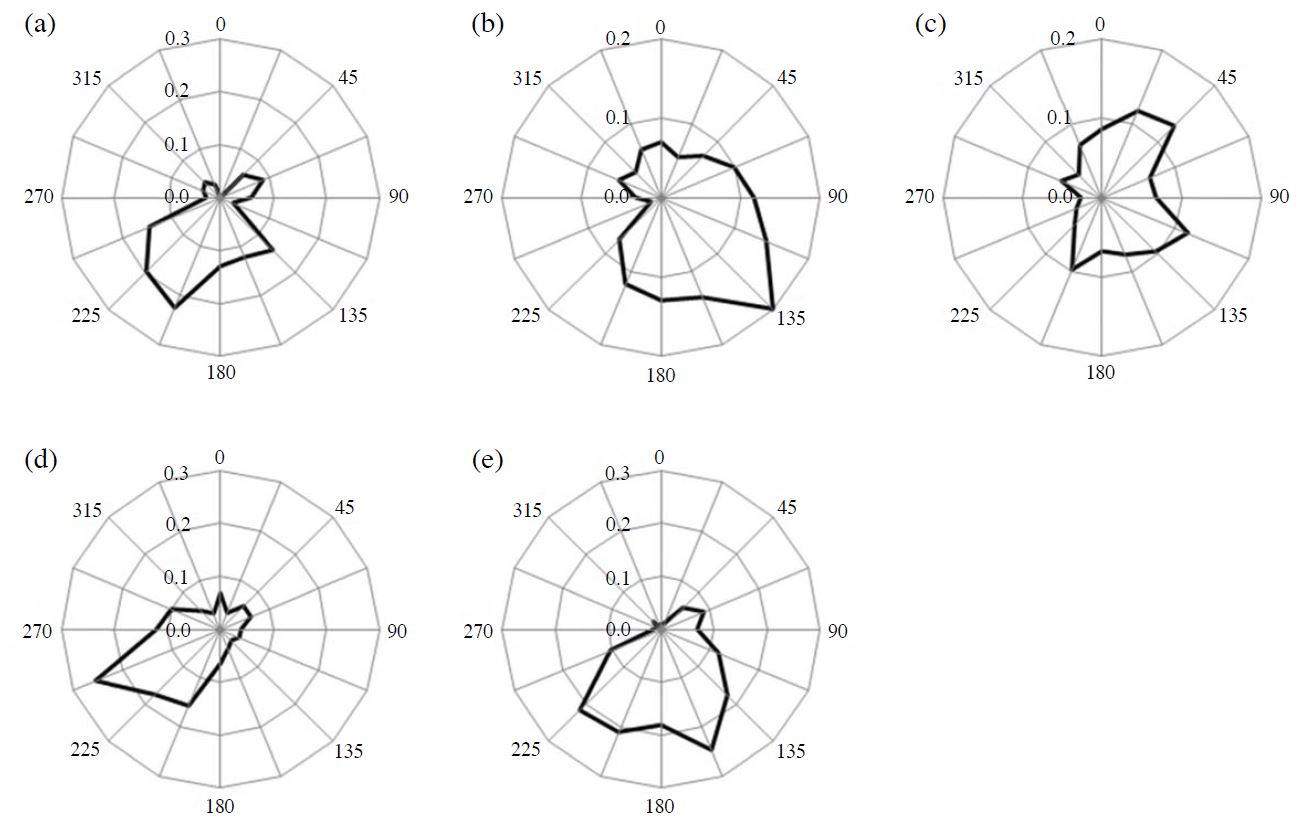
Conditional probability function (CPF) plot. (a) steel mills, (b) sea salt, (c) traffic, (d) coal combustion, (e) heavy oil combustion.
Factor 2 contained significant fractions of the nitrate ion (NO3 -) and chloride ion (Cl-) with few other component fractions. Furthermore, because the ion balance in factor 2 was 1.03, factor 2 was interpreted as the factor whose expressed contribution of ammonium chloride and ammonium nitrate was semi-volatile. In addition, factor 2 showed a higher trend during low ambient temperature seasons such as autumn and winter (Fig. 5). The average contribution of factor 2 is 7.0%. This factor is categorized as “secondary chloride and nitrate.”
Factor 3 contained typical soil components of the soil, such as Ca2+, Al, and Fe. Airborne soil particles could have been resuspended in the air from road traffic, construction sites, and windblown soil dust. Factor 3 appeared in a high concentration in the spring season of 2011 (Fig. 5). The backward trajectories on May 15, 2011, are shown in Fig. 7. Backward trajectories of this day point to eastern Mongolia and the Gobi Desert as sources of the yellow sand found at the sampling site. Furthermore, yellow sand was observed across a broad area of Japan on this day (Japan Meteorological Agency, 2012). Therefore, this high concentration was attributed to dust transported in yellowsand events that had occurred in eastern Mongolia and the Gobi Desert. The average contribution of factor 3 is 5.0%. This factor is categorized as “soil.”
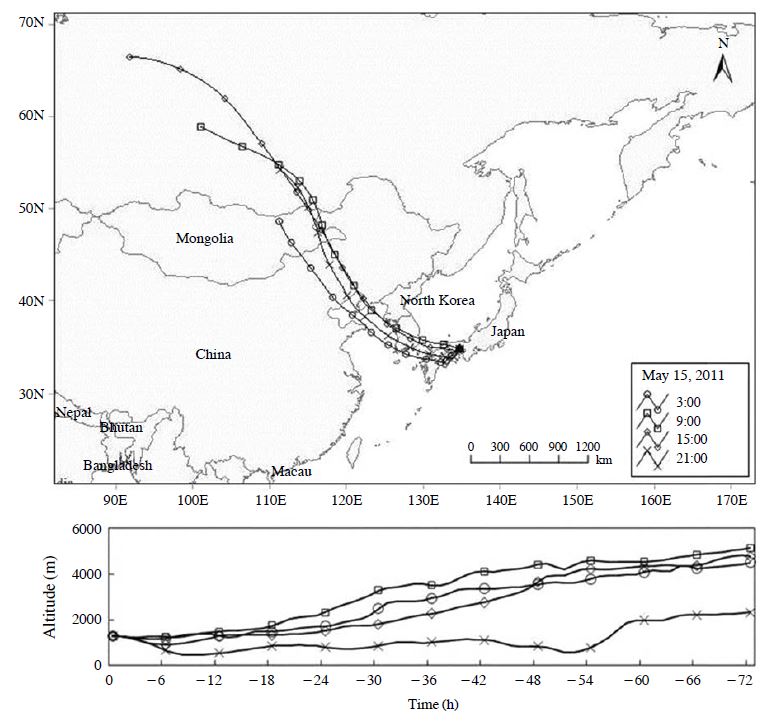
Backward trajectories of samples arriving at the sampling site on May 15, 2011 (JST 3:00, 9:00, 15:00, and 21:00).
Factor 4 shows enhanced fractions of Cl-, sodium ion (Na+), and magnesium ion (Mg2+). These tracers are mainly associated with sea salt particles. The CPF plot for factor 4 is presented in Fig. 6(b). The CPF value of factor 4 was high from southeast to southsoutheast because the sampling site was located on the north side of the Seto Inland Sea (Fig. 1). The average contribution of factor 4 is 3.8%. This factor is categorized as “sea salt.”
Factor 5 contained a large fraction of OC, EC, and antimony (Sb); there were few other component fractions. The large contribution of OC and EC indicates fuel combustion; and Sb is associated with brake pad wear (Iijima et al., 2009). The CPF plot for factor 5 is presented in Fig. 6(c). The CPF value of factor 5 was high from north-northeast to northeast. National Route 2 runs approximately 1.4 km to the north-northeast and National Route 250 runs approximately 0.5 km south-southwest of the sampling site. As indicated above, the average daily traffic volume and the proportion of heavy vehicles to the traffic volume on National Route 2 are heavier than those of National Route 250. Furthermore, the major arterial roads are concentrated northeast of Himeji City (Ministry of Land, Infrastructure, Transport and Tourism, 2010). Therefore, factor 5 shows the traffic and exhaust gas of vehicles on the nearby road. The average contribution of factor 5 is 20.8%. This factor is categorized as “traffic.”
Factor 6 constituted a significant fraction of the sulfate ion (SO4 2-) and ammonium ion (NH4 + + +). Furthermore, because the ion balance in factor 6 was 1.04, factor 6 was interpreted as the factor that expressed the contribution of ammonium sulfate. In addition, this factor contains a fraction of OC, EC, vanadium (V), and arsenic (As). Ammonium sulfate is produced by sulfur dioxide (SO2) exhausted into the atmosphere by the combustion of fossil fuels such as oil and coal. At first, sulfur dioxide is oxidized to sulfuric acid; the sulfuric acid is neutralized by ammonia and converted to ammonium sulfate. Because ammonium sulfate is stable in the atmosphere for a long time, it is transported great distances. Therefore, it suggests that the SO2 occurring at a great distance changes during transportation to ammonium sulfate before arriving at the sampling site. The average contribution of factor 6 is 20.9%. This factor is categorized as “secondary sulfate 1.”
Factor 7 contained a large fraction of potassium (K). K (or K+) is considered to be an index of burning biomass fields (Zhang et al., 2010) and fireworks (Tsai et al., 2012). Furthermore, this factor contains a fraction of NO3 -, SO4 2-, and Pb, suggesting fossil fuel combustion. The average contribution of factor 7 is 8.0%. This factor is categorized as “secondary sulfate 2.” In addition, we considered the sources of secondary sulfate 1 and secondary sulfate 2, which contribute highly to the sulfate in section 3.3.
(Cu). Generally, the As contained in atmospheric particles traces back to coal combustion in Japan (Mamuro et al., 1979). Furthermore, this factor contains a fraction of EC, suggesting combustion. The CPF plot for factor 8 is presented in Fig. 6(d). The CPF value of factor 8 was high from south-southwest to west-southwest. Since the coal-fired power plant (total output: 133,000 kW, Kansai Electric Power Co., Inc., 2013) is approximately 4.5 km west-southwest of the sampling site, it suggests that this factor was affected by the coal-fired power plant in the vicinity of the sampling site. The average contribution of factor 8 is 2.3%. This factor is categorized as “coal combustion.”
Factor 9 contained a significant fraction of V and a large fraction of nickel (Ni). Generally, V and Ni contained in atmospheric particles trace back to heavy oil combustion in Japan (Mamuro et al., 1979). Typical oil combustion sources are ships and boilers, such as thermal power plants using heavy oil. Although two thermal power plants exist near the sampling site (Fig. 1(b)), the thermal power plants have a small effect because their main fuel is liquefied natural gas (Kansai Electric Power Co., Inc., 2013). A recent study showed that V is definitely the index of ships (Zhao et al., 2013); in addition, inland shipping can also be considered a source of particulate matter (Vallius, 2005). The CPF plot for factor 9 is presented in Fig. 6(e). The CPF value of factor 9 was high from south-southeast to southwest. Since the Port of Himeji, an international hub port, is approximately 4.0 km south-southeast of the sampling site, it suggests that this factor was affected by ship traffic in the vicinity of the sea. The average contribution of factor 9 is 3.8%. This factor is categorized as “heavy oil combustion.”
When it is calculated as seven factors, factors 6 and 7 do not appear; the loading of those factors is allocated to other factors (Fig. 8). Therefore, factors 6 and 7 may have collinearity with other factors. Furthermore, as compared with factor 9, the load of SO4 2- in heavy oil combustion was increased, and the load of As and Pb in secondary sulfate 1 was increased in the case of factor 7. Therefore, a source of SO4 2- suggests heavy oil combustion as an index of V and coal combustion as an index of As and Pb. Yamagami et al. (2013) extracted eight factors by applying the PMF component concentrations of PM2.5 that were collected at six points in Nagoya City. The results show that the load of SO4 2- is large in “coal combustion” and “heavy oil combustion;” therefore, “coal combustion” and “heavy oil combustion” have been estimated to be major sources of SO4 2-. Since, in this analysis, similar results have been observed when seven factors have been calculated, “coal combustion” and “heavy oil combustion” are considered sources of SO4 2-. However, the survey site in this study is one point in the industrial area; it is possible that its location strongly influenced the sources in the nearby survey site. On the other hand, the number of survey sites in the reporting of Yamagami et al. is a six survey points, including the general environment point, has been analyzed as the same number of sources the number of each point. Therefore, it is possible that the influence of the source in the survey site vicinity has not yet been extracted.
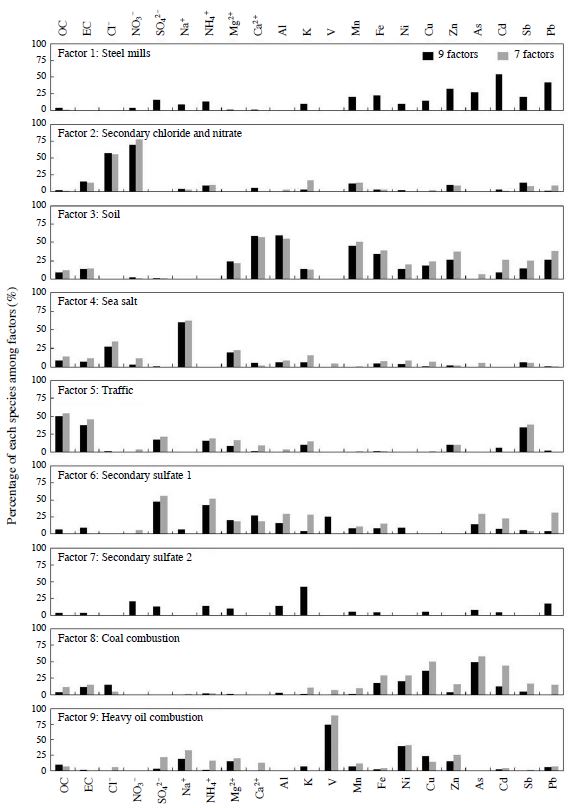
Comparison of the source profile by 9 factors and 7 factors. The vertical axis expresses the percentage of each species among factors.
On the other hand, factor 8 is speculated to be caused by coal combustion because the load of As is large; factor 9 is speculated to be caused by heavy oil combustion because the load of V is large. However, the load of SO4 2-, as compared with factors 6 and 7, is small. The reason is that the distance between the source and the survey site is close. Since a conversion rate to SO4 2- from SO2 is estimated to be 0.9-3.7%/hr (An et al., 2003; Sasaki et al., 1988; Uno et al., 1997), if located near the source, the factor representing heavy oil combustion or coal combustion, SO4 2-, there is a possibility of a small loading. As with China, Japan has heavy oil combustion facilities and coal-fired facilities. In particular, coal-fired power plants and steel mills, coke ovens, and ports are also present in the areas surrounding survey sites. Therefore, factors 8 and 9 represent the impact of fossil fuel combustion in the vicinity, and factors 6 and 7 represent the impact of fossil fuel combustion at a distance. However, due to the differences in distance between the survey sites, they are believed to have been extracted as different factors.
3. 3 Estimate of the Source of the Secondary Sulfate by PSCF
Sulfate accounts for 26.4% of the mass concentration of PM2.5 at this sampling site. Therefore, it is important to identify the source of sulfate to reduce PM2.5. In this study, two different types of secondary sulfate were identified by PMF analysis. Secondary sulfate 1 and secondary sulfate 2 account for 20.9% and 8.0%, respectively, of the PM2.5 mass concentration. Secondary sulfate 1 is characterized by its high concentration of SO4 2- and NH4 + + +. Secondary sulfate 2, on the other hand, is characterized by its high contribution of potassium (K). Furthermore, secondary sulfate 1 shows a high seasonal variation in the spring and summer that is associated with high photochemical activity (Fig. 5); secondary sulfate 2 has a weak summer-low seasonal variation (Fig. 5). Therefore, it suggests that these sources were greatly different.
Fig. 9 shows the PSCF plots for secondary sulfate 1 and secondary sulfate 2. Potential source areas and pathways where the secondary sulfates were formed are likely to be located in the high-PSCF-value areas. As shown in Fig. 9(a), the PSCF plot of secondary sulfate 1 shows the influence of the industrial area of the east coastal region of China, the Eastern China Sea, and the Kyushu region of Japan. The Yangtze Delta region of the eastern coastal industrial region of China includes Shanghai, Chiangsu, and Zhejiang. In recent years, the economic growth rate of the Yangtze Delta region has greatly exceeded the national average, and its economic growth is remarkable. It was suggested that SO2 emissions from the thermal power plant and industries located in the eastern coastal industrial region of China were related to what was converted to high PSCF values in the process of transportation. The Eastern China Sea has a great deal of marine traffic by ships. Yang et al. (2007) have developed an emission inventory from marine ships, in which the SO2 from ships accounts for 9.5% of all sources in Shanghai in 2003. In addition, Zhao et al. (2013) report a major link between the peak of SO2 measured in the Yangshan Port of Shanghai and the ships’ exhaust. This suggests that the high PSCF values in the Eastern China Sea are affected by the SO2 emission from ships. There are many active volcanoes in Kyushu region of Japan. In particular, there were many SO2 emissions from the Sakurajima volcano; emissions in 2011 and 2012 were 300-3,200 tons/day and 1,200-5,700 tons/ day, respectively (Fukuoka District Meteorological Observatory, 2012, 2011). This suggests that the SO2 exhausted from various sources changed to sulfate in the transportation process.
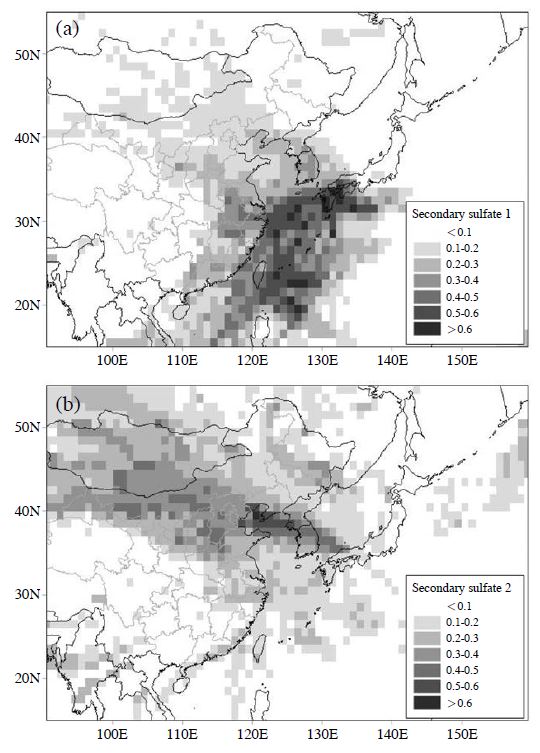
Potential source contribution function (PSCF) plot. (a) secondary sulfate 1, (b) secondary sulfate 2.
The high contribution of potassium (K) in secondary sulfate 2 suggests a strong influence of burning biomass fields (Zhang et al., 2010). Kumagai et al. (2010) measured the levoglucosan and potassium ions that are indices of burning biomass on the Kanto Plain of Japan and reported that the contribution of biomass burning is high in the winter; the average contribution of burning biomass to the fine particulate mass was 20% in the winter. Biomass burning in the report of Kumagai et al. was similar to a characteristic of secondary sulfate 2 in this study; this supports the influence of biomass burning at this sampling site. However, this factor contains a fraction of NO3 -, SO4 2-, and Pb, suggesting the combustion of fossil fuel. As shown in Fig. 9(b), although the PSCF plot of secondary sulfate 2 shows the influence of the border area between Russia and Mongolia where forest fires are frequent (Heo et al., 2009), the PSCF value of the urban areas of China, such as Beijing, Hebei, and western Inner Mongolia, is high. In Chinese urban areas and Inner Mongolia, coal central heating systems are used in the winter, generating serious atmospheric pollution (Zhao and San, 1986). This suggests that secondary sulfate 2 was affected by particles derived from the combustion of fossil fuels, such as coal, in addition to biomass burning. On the other hand, the day with the highest contribution concentration of secondary sulfate 2 (9.5 μg/m3) was January 25, 2012. January 23 and 22, 2012, were the Chinese New Year and New Year’s Eve, respectively - a most important festival in China. During this event, people use a large quantity of fireworks. Previous studies have shown that fireworks aerosols are rich in K (Tsai et al., 2012). Therefore, the increased contribution of this factor on January 25, 2012 and the next several days may have been affected by the long-distance transportation of fireworks aerosols.
Heo et al. (2009) reported the results of source identification and apportionment by PMF and PSCF analyses of PM2.5 in Seoul, Korea, from March 2003 to December 2006. In their report, nine factors were extracted by PMF analysis; the contribution of a factor categorized as “secondary sulfate” was 20.5%. Furthermore, the PSCF plot of “secondary sulfate” conformed to the result of the PSCF plot of secondary sulfate 1. Their report strongly supports the results of this study. Higo et al. (2013) extracted seven factors by applying the PMF component concentrations of PM2.5 that were collected at two general environmental points in Fukuoka City. Their results show that the load of SO4 2- and the impact of cross-border transport are large for “coal combustion” and “oil combustion.” Furthermore, in the reports, “oil combustion” and “coal combustion” indicate high concentrations in spring and winter, respectively. Therefore, we estimated that secondary sulfate 1 and secondary sulfate 2 were extracted as other factors, as is the case with the reporting of Higo et al., that high concentrations differed seasonally.
4. CONCLUSIONS
In order to estimate the influence of sources on PM2.5 in the industrial areas of Japan, PM2.5 was collected intermittently at an industrial area in Japan from July 2010 to November 2012, and the chemical components of 198 days of PM2.5 samples were analyzed. The PMF model was applied to measuring those chemical components. To estimate the source of PM2.5, nine factors were identified. The source of the contribution to PM2.5 was estimated by a factor’s profile, and these contribution rates of the PM2.5 mass concentration were calculated.
The factor with the highest contribution rates was secondary sulfate 1 (percentage source contribution: 20.9%); after that was traffic (20.8%), secondary sulfate 2 (8.0%), steel mills (7.8%), secondary chloride and nitrate (7.0%), soil (5.0%), heavy oil combustion (3.8%), sea salt (3.8%) and coal combustion (2.3%). As a result of CPF analysis using wind direction, steel mills, sea salt, traffic, coal combustion, and heavy oil combustion were matched to the position of the sources around the sampling site. As a result of PSCF analysis using backward trajectories, it was suggested that ships on the East China Sea, industrial areas in the east coastal regions of China, and the active volcano in the Kyushu region of Japan were potential source regions of secondary sulfate 1. Although it was suggested that secondary sulfate 2 was affected by biomass burning, the possible effect of the combustion of fossil fuels, such as coal, of Chinese urban areas and Inner Mongolia and the possible effect of fireworks in China were also suggested by PSCF analysis. Furthermore, source characterization using continuous data of one site showed that potential sources of fossil fuel combustion are both regional and broad based.
Acknowledgments
This work was supported by the Environment Research and Technology Development Fund (C-1005, 5-1456) of the Ministry of the Environment, Japan. We would like to thank Ms. Yoshie Oshita for her assistance in chemical analysis.
References
-
Ana, C.J., Ueda, H., Matsuda, K., Hasome, H., Iwata, M., (2003), Simulated impacts of SO2 emissions from the Miyake volcano on concentration and deposition of sulfur oxides in September and October of 2000, Atmospheric Environment, 37, p3039-3046.
[https://doi.org/10.1016/S1352-2310(03)00327-3]

-
Ashbaugh, L.L., Malm, W.C., Sadeh, W.Z., (1985), A residence time probability analysis of sulfur concentrations at Grand Canyon National Park, Atmospehirc Environment, 19, p1263-1270.
[https://doi.org/10.1016/0004-6981(85)90256-2]

- Chatani, S., Morikawa, T., Nakatsuka, S., Matsunaga, S., (2011), Sensitivity analyses of domestic emission sources and transboundary transport on PM2.5 concentrations in three majour urban areas for the year 2005 with the three-dimensional air quality simulation, Journal of Japan Society of Atmospheric Environment, 46, p101-110, (in Japanese).
-
Chow, J.C., Watson, J.G., Crow, D., Lowenthal, D.H., Merrifield, T., (2001), Comparison of IMPROVE and NIOSH carbon measurements, Aerosol Science and Technology, 34, p23-34.
[https://doi.org/10.1080/027868201300081923]

-
Dockery, D.W., Pope, C.A., Xiping, X., Spengler, J.D., Ware, J.H., Fay, M.E., Ferris Jr., B.G., Speizer, F.E., (1993), An association between air pollution and mortality in six US cities, The New England Journal of Medicine, 329, p1753-1759.
[https://doi.org/10.1056/nejm199312093292401]

- Draxler, R.R., Rolph, G.D., HYSPLIT (Hybrid Single Particle Lagrangian Integrated Trajectory) Model, NOAA Air Resources Laboratory, Silver Spring, MD Model access via NOAA ARL READY Website, http://ready.arl.noaa.gov/HYSPLIT.php(accessed 1 May 2014)..
- Fukuoka district meteorological observatory, (2011), Volcanic activity of Sakura-jima in 2011, Website, http://www.data.jma.go.jp/svd/vois/data/tokyo/STOCK/monthly_v-act_doc/annual.htm(in Japanese) (accessed 1 May 2014).
- Fukuoka district meteorological observatory, (2012), Volcanic activity of Sakura-jima in 2011, Website, http://www.data.jma.go.jp/svd/vois/data/tokyo/STOCK/monthly_v-act_doc/annual.htm(in Japanese) (accessed 1 May 2014).
-
Harrison, R.M., Jones, M.A., Lawrence, G.R., (2003), A pragmatic mass closure model for airborne particulate matter at urban background and roadside sites, Atmospheric Environment, 37, p4927-4933.
[https://doi.org/10.1016/j.atmosenv.2003.08.025]

-
Heo, B.J., Hopke, K.P., Yi, M.S., (2009), Source apportionment of PM2.5 in Seoul, Korea, Atmospheric Chemistry and Physics, 9, p4957-4971.
[https://doi.org/10.5194/acp-9-4957-2009]

- Higo, H., Yamashita, S., Kinoshita, M., (2013), Chemical Composition and Source Apportionment of PM2.5 in Fukuoka City, Annual Report of Fukuoka City Institute for Hygiene and the Environment, 38, p71-76, (in Japanese).
-
Hopke, P.K., Barrie, L.A., Li, S.M., Cheng, M.D., Li, C., Xie, Y., (1995), Possible sources and preferred pathways for biogenic and non-sea salt sulfur for the high Arctic, Journal of Geophysical Research, 100, p16595-16603.
[https://doi.org/10.1029/95jd01712]

-
Iijima, A., Sato, K., Fujitani, Y., Fujimori, E., Saito, Y., Tanabe, K., Ohara, T., Kozawa, K., Furuta, N., (2009), Clarification of the predominant emission sources of antimony in airborne particulate matter and estimation of their effects on the atmosphere in Japan, Environmental Chemistry, 6, p122-132.
[https://doi.org/10.1071/en08107]

-
Iijima, A., Tago, H., Kumagai, K., Kato, M., Kozawa, K., Sato, K., Furuta, N., (2008), Regional and seasonal characteristics of emission sources of fine airborne particulate matter collected in the center and suburbs of Tokyo, Japan as determined by multielement analysis and source receptor models, Journal of Environmental Monitoring, 10, p1025-1032.
[https://doi.org/10.1039/b806483k]

- Inoue, K., Cao, R., Honma, K., Shirai, T., (2002), Evaluation of PM2.5 by multi-nozzle cascade impactor (MCI), Environment and Measurement Technology, 29, p42-47, (in Japanese).
- Japan Meteorological Agency, (2013), Database of global environment, Website, http://www.jma.go.jp/jma/indexe.html(accessed 1 May 2014).
- Kansai Electric Power incorporated company, (2013), Catalog of plants, Website, http://www.kepco.co.jp/corporate/energy/thermal_power/index.html(in Japanese) (accessed 1 May 2014).
-
Kim, E., Hopke, P.K., Edgerton, E.S., (2003), Source identification of Atlanta aerosol by positive matrix factorization, Journal of the Air & Waste Management Association, 53, p731-739.
[https://doi.org/10.1080/10473289.2003.10466209]

- Kim, E., Hopke, P.K., (2004), Source apportionment of fine particles at Washington, DC utilizing temperature resolved carbon fractions, Journal of the Air & Waste Management Association, 54, p773-785.
-
Kumagai, K., Iijima, A., Shimoda, M., Saitoh, Y., Kozawa, K., Hagino, H., Sakamoto, K., (2010), Determination of dicarboxylic acids and levoglucosan in fine particles in the Kanto plain, Japan, for source apportionment of organic aerosols, Aerosol Air Quality Research, 10, p282-291.
[https://doi.org/10.4209/aaqr.2009.11.0075]

- Mamuro, T., Mizohata, A., Kubota, T., (1979), Elemental composition of suspended particles released in refuse incineration, Journal of Japan Society of Air Pollution, 14, p190-196, (in Japanese).
-
Marcazzan, G.M., Vaccaro, S., Valli, G., Vecchi, R., (2001), Characterisation of PM10 and PM2.5 particulate matter in the ambient air of Milan (Italy), Atmospheric Environment, 35, p4639-4650.
[https://doi.org/10.1016/s1352-2310(01)00124-8]

- Ministry of Land, Infrastructure, Transport and Tourism, (2010), Road traffic census in 2010. Website, http://www.kkr.mlit.go.jp/road/koutsugenzyou/index.html(in Japanese).
- Mooibroek, D., Shaap, M., Weijers, E.P., Hoogerbrugge, R., (2011), Source apportionment and spatial variability of PM2.5 using measurements at five sites in Netherlands, Atmospheric Environment, 45, p4180-4191.
- Norris, G., Vedantham, R., Wade, K., Broen, S., Prouty, J., Foley, C., (2008), EPA Positive Matrix Factorization (PMF) 3.0 Fundamentals & User Guide.
-
Paatero, P., Tapper, U., (1993), Analysis of different modes of factor analysis as least squares fit problems, Chemometrics and Intelligent Laboratory Systems, 18, p183-194.
[https://doi.org/10.1016/0169-7439(93)80055-m]

-
Paatero, P., Tapper, U., (1994), Positive matrix factorization: a nonnegative factor model with optimal utilization of error estimates of data values, Environmetrics, 5, p111-126.
[https://doi.org/10.1002/env.3170050203]

-
Polissar, A.V., Hopke, P.K., Harris, J.M., (2001), Source regions for atmospheric aerosol measured at Barrow, Alaska, Environmental Science & Technology, 35, p4214-4226.
[https://doi.org/10.1021/es0107529]

-
Polissar, A.V., Hopke, P.K., Paatero, P., Malm, W.C., Sisler, J.F., (1998), Atmospheric aerosol over Alaska 2. Elemental composition and sources, Journal of Geophysical Research, 103, p19045-19057.
[https://doi.org/10.1029/98jd01212]

-
Sasaki, K., Kurita, H., Carmichael, G.R., Chang, Y.-S., Murano, K., Ueda, H., (1988), Behavior of sulfate, nitrate and other pollutants in the long-range transport of air pollution, Atmospheric Environment, 22, p1301-1308.
[https://doi.org/10.1016/0004-6981(88)90155-2]

- Schwartz, J., Laden, F., Zanobetti, A., (2002), The concentrationresponse relation between PM2.5 and daily deaths, Environmental Health Perspectives, 110, p1025-1029.
-
Song, X.H., Polissar, V.A., Hopke, P.K., (2001), Sources of fine particle composition in the northeastern US, Atmospheric Environment, 35, p5277-5286.
[https://doi.org/10.1016/s1352-2310(01)00338-7]

-
Tsai, H.H., Chien, H.L., Yuan, S.C., Lin, C.Y., Jen, H.Y., Ie, R.I., (2012), Influences of fireworks on chemical characteristics of atmospheric fine and coarse particles during Taiwan’s Lantern Festival, Atmospheric Environment, 62, p256-264.
[https://doi.org/10.1016/j.atmosenv.2012.08.012]

- Uno, I., Wakamatsu, S., Ueda, H., Murano, K., Sakamaki, F., Kurita, H., Satsumabayashi, H., Horai, S., (1997), Behavior of secondary pollutanst and volcanic SO2over Kyusyu during a spring-time high pressure system, Journal of Japan Society for Atmospheric Environment, 32, p404-424, (in Japanese).
- Vallius, M., (2005), Characteristics and Sources of Fine Particlate Matter in Urban Air, Ph. D. thesis.
-
Wang, Y.Q., Zhang, X.Y., Draxler, R., (2009), TrajStat: GIS-based software that uses various trajectory statistical analysis methods to identify potential sources from long-term air pollution measurement data, Environmental Modelling & Software, 24, p938-939.
[https://doi.org/10.1016/j.envsoft.2009.01.004]

-
Watson, J.G., Chow, J.C., Lu, Z., Fujita, M.E., Lowenthal, D.H., (1994), Chemical mass balance source apportionment of PM10 during the southern California Air Quality Study, Aerosol Science and Technology, 21, p1-36.
[https://doi.org/10.1080/02786829408959693]

- Yamagami, M., Hisatsune, K., Ikemori, F., (2013), Estimation of local sources of PM2.5 using the conditional probability function, Annual Report of Nagoya City Institute for Environmental Sciences, 2, p13-17, (in Japanese).
-
Yang, D., Kwan, S.H., Lu, T., Fu, Q., Cheng, J., Streets, D.G., Wu, Y., Li, J., (2007), An emission inventory of marine vessels in Shanghai in 2003, Environmental Science & Technology, 41, p5183-5190.
[https://doi.org/10.1021/es061979c]

- Zhang, X., Hecobian, A., Zheng, M., Frank, H.N., Weber, J.R., (2010), Biomass burning impact on PM2.5 over the southeastern US during 2007: integrating chemically speciated FRM filter measurements, MODIS fire counts and PMF analysis, Atmospheric Chemistry and Physics, 10, p6839-6853.
-
Zhao, M., San, B., (1986), Atmospheric Pollution from Coal Combustion in China, JAPCA Journal of the Air & Waste Management Association, 36, p371-374.
[https://doi.org/10.1080/00022470.1986.10466074]

-
Zhao, M., Zhang, Y., Maa, W., Fu, Q., Yang, X., Li, C., Zhou, B., Yu, Q., Chen, L., (2013), Characteristics and ship traffic source identification of air pollutants in China’s largest port, Atmospheric Environment, 64, p277-286.
[https://doi.org/10.1016/j.atmosenv.2012.10.007]

