Box Model Approach for Indoor Air Quality (IAQ) Management in a Subway Station Environment
Correspondence to: * Tel: +82-32-835-4689, E-mail: airgroup@incheon.ac.kr
Abstract
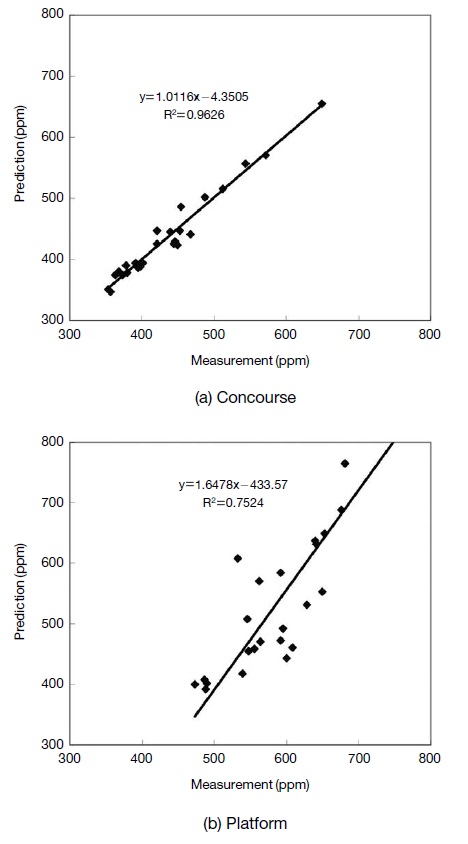
Air quality in a subway tunnel has been crucial in most of the subway environments where IAQ could be affected by many factors such as the number of passengers, the amount and types of ventilation, train operation factors and other facilities. A modeling approach has been introduced to manage the general IAQ in a subway station. Field surveys and CO2 measurements were initially conducted to analyze and understand the relationship between indoor and outdoor air quality while considering internal pollution sources, such as passengers and subway trains, etc. The measurement data were then employed for the model development with other statistical information. For the model development, the algorithm of simple continuity was set up and applied to model the subway IAQ concerned, while considering the major air transport through staircases and tunnels. Monitored CO2 concentration on the concourse and platform were correlated with modeling results where the correlation values for the concourse and platform were R2=0.96 and R2=0.75, respectively. It implies that the box modeling approach introduced in this study would be beneficial to predict and control the indoor air quality in subway environments.
Keywords:
Carbon Dioxide, Field Measurements, Indoor Air Pollution, Subway Station, Ventilation1. INTRODUCTION
Urbanization, which has rapidly been expanding recently throughout the world, leads to a significant increase in the urban population as well as other related demands. For instance, residents in the Seoul metropolitan area account for approximately a quarter of Korea’s entire population. This urbanization trend demands that more land space is planned for high efficiency use. High- rise buildings are also commonly designed and used in modern society to ease land requirements. Along with this demand for land, mass public transportation is another essential aspect that makes a city function well. In reality, however, the increasing need for transportation is not easily satisfied due to solid urban structures and space limitation.
Efforts have been made to utilize underground spaces in urban areas in order to ease land and transport demands. The advent of the subway system has played a great role in public transportation in urban areas. This utilization of the subway system also has various advantages such as easing traffic jams and reducing the environmental impact to ground level urban air quality. In fact, it implies that citizens in urban areas have increased exposure to subway air pollutants while waiting at stations or being transported. However, the IAQ in subway systems is neither well examined nor understood. The indoor air quality of subway stations, underground terminals and underground shopping centers have especially generated more interest due to health implication for passengers, pedestrians and workers etc. It is a well-known fact that people in modern society spend most of their time in an indoor environment; however, the fact that most of the time spent commuting to their places of work and homes is also spent “indoors” i.e. in subways, has been less appreciated and emphasizes the importance of the management of indoor air pollutants as well as the ventilation system operation. For this, researchers and engineers in the different part of the world work differently. Liu et al. (2013) designed the ventilation control system for the subway station based on the indoor and outdoor PM10 concentration data. For the efficient ventilation with less piston impact in the subway tunnel by TIW, tunnel design (geometric parameters) is one of the key parameter (Moreno et al., 2014).
In this study of IAQ in subway stations, an IAQ model was developed for a subway station. Initially, the characteristics of IAQ in subway stations were surveyed by means of onsite field measurements and the results were then introduced to the IAQ model (box model) development for the further analysis. Finally, correlation analysis was carried out for the validation of the predicted data with the in-situ measurement data. In this study. CO2 is considered as an indoor air pollutant as it is known as an indicator of indoor air pollutants.
2. IAQ CONSIDERATION IN A SUBWAY STATION
In Seoul, there are 263 underground subway stations currently being used. The number of stations is also increasing gradually with newly planned subway routes. According to a long-term plan for Seoul, subway journeys will account for 49% of public transportation by 2011.
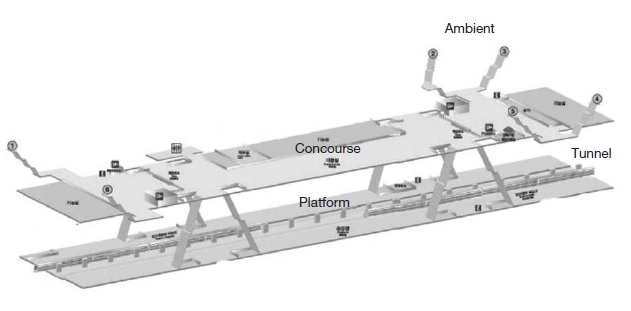
Fig. 1 demonstrates a typical subway station in the Seoul area. Passengers normally have access to the concourse from ground level via stairs. As shown, the concourse is usually located on the first floor below ground level. The platform including train tracks is built on the second floor below ground level. This design indicates that the IAQ in the concourse is influenced more by the external ambient air than by the IAQ in the platform.
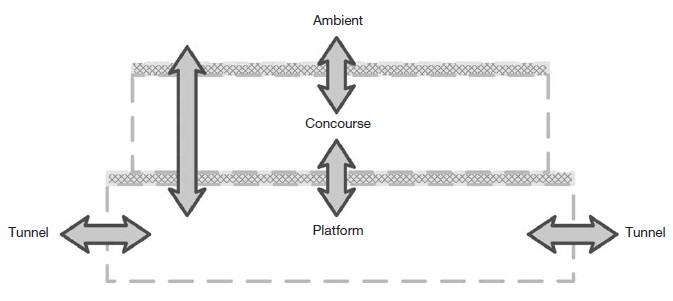
Fig. 2 shows a simplified schematic diagram representing the movement of air and pollutants in a subway station. As denoted, the air from outside is being supplied into the concourse and the platform simultaneously by means of mechanical ventilation and natural ventilation, mainly via the stairs. In the case of natural ventilation, it is normally thermal buoyancy driven or train-induced wind.
The major factors affecting the subway IAQ are air temperature, humidity, ventilation by train-induced wind and mechanical systems and air pollutants. In this study, CO2 which has been used as the main indicator of indoor air quality was subjected. In indoor space, the CO2 concentration is normally increased by the occupants’ breathing with the subsequent effect that IAQ reduces as CO2 concentration increases. Indoor CO2 has also been used as an alternative method to estimate ventilation flow. Cheng and Yan (2011) carried out a comparison study on CO and CO2 levels in underground and ground level station in the Taipei rapid transit mass system where CO2 concentration was 574-1051 ppm where CO2 concentration in the Seoul subway station was approximately 500-800 ppm (Song et al., 2008).
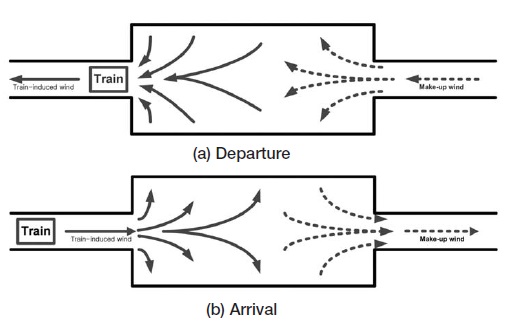
The IAQ in the concourse is affected by the movement of air around the platform as well as the air from outside. In the case of the platform, the IAQ is affected by the air from outside and within the concourse. In addition, train-induced wind (TIW) also has a remarkable impact on the subway IAQ, where TIW is defined as, of the transport ventilation caused by a moving train. TIW has a dual role, which is to export the air pollutants in a platform toward the subway tunnel and to import the air pollutants in a subway tunnel onto platforms, as depicted in Fig. 3. More reading on this issue is provided by the reference (Seoul Metro, 2008).
3. MODELING APPROACH FOR SUBWAY IAQ
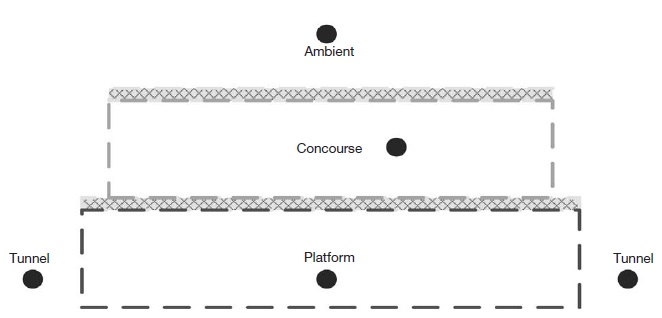
As demonstrated in Fig. 2, the underground space in a subway station is divided by two compartments, i.e. the concourse and the platform. These two compartments have different IAQ factors as discussed previously. In this study, the modeling approach which considers the impact of continuity in a single cell space is introduced to those two compartments, as depicted in Fig. 4. The confined space in Fig. 5 has several IAQ factors related to the contaminant sources and the control approaches. Table 1 lists those IAQ factors reported in previous studies of subway IAQ (Cheng and Yan, 2011).
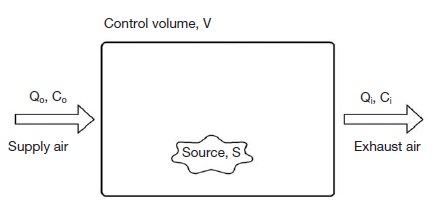
Mass balance consideration in a single-cell space,where V for the space volume [m3], S for the emission rate[mg/min], Q for the air flow rate [m3/min], C for the contami-nant concentration [mg/m3]. (Note: The full-mixing assump-tion is made.)
Two-way approaches are made in this study to consider the generation and transport of air pollutants to the concourse and the platform. When considering the IAQ in the concourse, Fig. 5 demonstrates the schematic diagram of air exchange between the ambient and the concourse environment. The passengers and pedestrians are the major pollutant sources, while ventilation by the mechanical system and thermal/train-induced winds are the major factors for pollutant transportation. Variables are listed and defined in Table 1. Box model introduced in this study is based on the mass balance approach as in Fig. 4. Numerically, the model is derived as in Eq. (1) where the parameters are listed in the Table 1. Eq. (2) is the derived from Eq. (1) and it is used to predict the contaminant concentration in the concourse (Cheng and Yan, 2011).
| (1) |
| (2) |
| (3) |
| (4) |
Fig. 6 depicts the IAQ consideration in the subway platform. The IAQ factors in this case are similar to the concourse case as in Fig. 5 except for the train-induced wind demonstrated in Fig. 3. Eq. (3) gives the mass balance in the platform and the Eq. (4) is the solution of Eq. (3). Eq. (4) produces the contaminant concentration in the platform.
4. FIELD MEASUREMENT AND SURVEY
In order to study the characteristics of the IAQ in a subway station, a subway station located in an area of Seoul, Korea was selected, see Fig. 1. The air qualities in the ambient environment outside the station in the concourse, in the platform, and in the subway tunnel were monitored by continuously measuring systems. Along with the field measurements, subway statistics and other station information were also collected.
Train ventilation pressure is generated at the front of the train due to the piston effect of the train at the front side and the surface roughness of the train body with air inside the train. The ventilation amount due to the movement of the train inside the tunnel is calculated from the Eq. (5) to Eq. (7) which has already been published (Kim et al., 2004). The train-induced wind velocity was monitored continuously with interval of 1 s for 70 s which is effective time management for train induced ventilation. The data were monitored at the tunnel above 15 cm from the bottom of the tunnel and they were normalized by using the factors 1.47 and 1.59 for the arrival and departure of the train. The data were monitored for 300 s repetitions and the average train induced velocity was calculated using Eq. (10). Fago et al. (1991), Lin et al. (2008), Huang et al. (2012) and Pflitsch et al., 2012 described the wind monitoring procedure inside the tunnel, underground section of the subway station in the different part of the world by overcoming different limitations. Moreover Kim and Kim (2007) conducted an experimental study in laboratory scale (1:20) to monitor the TIW.
| (5) |
| (6) |
| (7) |
- Where,
- At=Cross section area of train [12.8m2=3.98m× 3.2 m]
- AT=Cross section area of tunnel [18.6m2=5.15m ×3.6 m]
- g=Acceleration of gravity [9.8 m/s2]
- Q1=Train ventilation amount [m3/s]
- Vt=Train induced wind velocity [m/s]
- VT=Average train induced wind velocity [m/s]
- ΔP=Train ventilation pressure [mm H2O]
| (8) |
| (9) |
| (10) |
- Where,
- S=Length of tunnel [m]
- a=Acceleration of train [0.7 m/s2] - departure
- a=Deceleration of train [0.5 m/s2] - arrival
- t=Departure or arrival time [s]
5. RESULTS AND DISCUSSION
When considering the spatial distribution of air quality in the subway station, the qualities of the subway air are ranked as; Ambient>Concourse>Platform>Tunnel (Park and Ha, 2008). It proves that the subway IAQ in this study is dominated by internal air pollution sources in the subway system, ventilation amount and its pattern. In this section, we presented and discussed the outcomes about (a) the ventilation amount caused by the train induced wind, (b) IAQ indicator; mostly CO2 concentration predicted using the Box model introduced in this study.
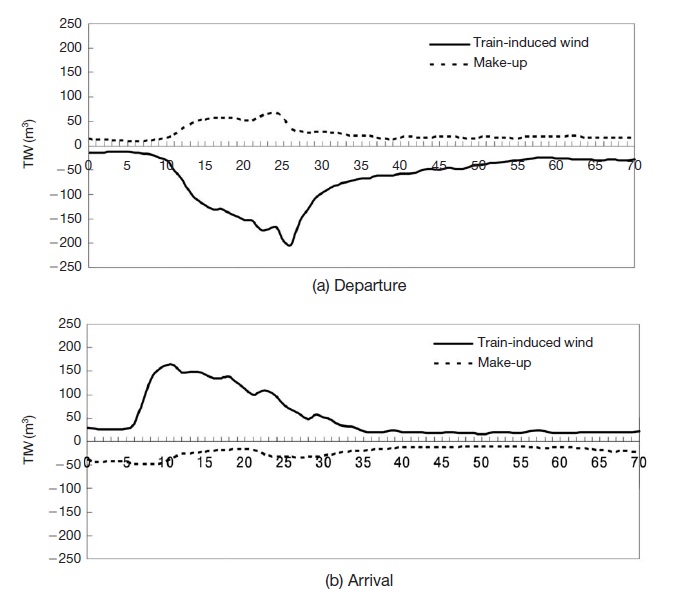
Number of passengers and their movement trend at on-board, off-board conditions; train services pattern in downtown, suburb area, and CO2 concentration at different part of subway station were explained and presented in Kim et al. (2004) and Song et al. (2008). Fig. 8 demonstrates Train-induced wind (TIW) in the subway station. The TIW was estimated based on the wind velocity data measured in the subway station. When a subway train leaves the station as shown in Fig. 3(a), the TIW is generated toward the subway tunnel as shown in Fig. 8(a). As stated previously, approximately 9,400m3 of TIW per each 10-car subway train is generated, which causes 2,200m3 of make-up wind as shown in Fig. 3(a). When a train approaches the station as in Fig. 3(b), the air in the tunnel is imported into the platform as shown in Fig. 8(b). Approximately 8,500m3 of TIW per 10-car in the subway train is generated, which causes 4,300 m3 of make-up wind in Fig. 3(b) (Kim et al., 2004). The test results mentioned above are used as an input data in the box model presented in the Eqs. (2) and (4) respectively. Then the CO2 concentrations in the concourse and the platform are predicted.
Validation of the predicted data was one of the challenges in this study. Here correlation analysis between the predicted data and the measured concentration data in the field (Song et al., 2008; Kim et al., 2004) was carried out for the validation of the data predicted using the box model introduced herewith. Fig. 9(a) and (b) demonstrate the correlation between measurement CO2 concentration and predicted CO2 concentration at concourse and platform, respectively. IAQ in the concourse and the platform are predicted reasonably well by the numerical model suggested in this study where correlation R2 between measurement and predicted data at concourse and platform are above 75% each as in Fig. 9(a) and (b). It also implies that the combination of indoor air emissions by moving sources such as passengers, pedestrians and moving trains, etc. and the train-induced wind generated by moving trains are sufficient to expect the full emissions mixing assumption as described at the beginning of this paper.
6. CONCLUSIONS
The importance of underground space in modern society has continued to increase gradually. Among the many efforts to cope with various demands in urban environments, the utilization of the subway system has played a great role in easing the intense demand for public transportation as well as highly-efficient land use. In this study, the IAQ in a subway system was examined in detail and the numerical algorithm to model the IAQ was proposed. From the results of this study, the following conclusions were made;
- • The IAQ in a subway station reveals that the IAQ in the subway tunnel is worse compared to other parts of the station; i.e. Ambient>Concourse>Platform >Tunnel (worst). This implies that the highly polluted air in the tunnel could be another potential source of air pollutants in a subway environment. This is why it also needs to be considered when building IAQ management strategies.
- • Train-induced wind is generated by the train moving through the subway station. The values of the ventilation rate are quite significant compared to the capacity of the ventilation system currently running. It indicates the need to control TIW to maintain and control the IAQ in a subway station effectively (Refer Table 2).
- • The numerical model proposed in this study specifies the measured IAQ in the subway with reasonable accuracy. It implies that there is a potential to use the developed subway station IAQ model to help develop and improve current IAQ management regimes in subway station environments. It is also strongly recommended that further real-time monitoring of local IAQ is carried out to achieve enhanced measurement accuracy of subway IAQ and hence improve modeling needs as required.
Acknowledgments
This work was supported by the Incheon National University Research Grant in 2011. We are grateful to all the researchers, especially Air Group members for their kind support to complete this research work. We are also grateful and acknowledge the reviewers for their careful revision and invaluable suggestion to improve the quality of the article presented.
References
-
Cheng, Y.H., Yan, J.W., (2011), Comparisons of particulate matter, CO, and CO2levels in underground and groundlevel stations in the Taipei mass rapid transit system, Atmospheric Environment, 45, p4822-4891.
[https://doi.org/10.1016/j.atmosenv.2011.06.011]

- Fago, B., Lindner, H., Mahrenholtz, O., (1991), The effect ground simulation on the flow around vehicles in wind tunnel testing, Journal of Wind Engineering and Industrial Aerodynamics, 38(1), p47-57.
- Gerhardt, H., Kruger, O., (1998), Wind and train driven air movements in train stations, Journal of Wind Engineering and Industrial Aerodynamics, 74-76, p589-597.
-
Huang, Y.D., LI, C., Kim, C.N., (2012), A numerical analysis of the ventilation performance for different ventilation strategies in a subway tunnel, Journal of Hydrodynamics, Ser. B, 24(2), p193-201.
[https://doi.org/10.1016/s1001-6058(11)60234-5]

-
Kim, J.Y., Kim, K.Y., (2007), Experimental and numerical analysis of train induced unsteady tunnel flow in subway, Tunneling and Underground Space Techneology, 22(2), p166-172.
[https://doi.org/10.1016/j.tust.2006.06.001]

-
Kim, J.Y., Kim, K.Y., (2009), Effects of vent shaft location on the ventilation performance in a subway tunnel, Journal of Wind Engineering and Industrial Aerodynamics, 97(5-6), p174-179.
[https://doi.org/10.1016/j.jweia.2009.06.002]

- Kim, M., SankaraRao, B., Kang, O.Y., Kim, J.T., Yoo, C.K., (2012), Monitoring and prediction of indoor air quality (IAQ) in subway ro metro systems using season depedent models, Energy and Building, 46, p48-55.
- Kim, S.D., Song, J.H., Lee, H., (2004), Estimation of Train-Induced Wind Generated by Train Operation in Subway Tunnels, Korean Journal of Air-Conditioning and Refrigeration Engineering, 16, p652-657.
-
Li, T.T., Bai, Y.H., Liu, Z.R., Liu, J.F., Zhang, G.S., Li, J.L., (2006), Air Quality in Passenger Cars of the Ground Railway Transit System in Beijing, China, Science of the Total Environment, 367(1), p89-95.
[https://doi.org/10.1016/j.scitotenv.2006.01.007]

-
Lin, C.J., Chuah, Y.K., Liu, C.W., (2008), A study on underground tunnel ventilation for piston effects influenced by draught relief shaft in subway system, Applied Thermal Engineering, 28(5-6), p372-379.
[https://doi.org/10.1016/j.applthermaleng.2007.10.003]

-
Liu, H., Lee, S.C., Kim, M., Shi, H., Kim, J.T., Wasewar, K.L., Yoo, C.K., (2013), Multi-objective optimization of indoor air quality control and energy consumption minimization in a subway ventilation system, Energyand Building, 66, p553-561.
[https://doi.org/10.1016/j.enbuild.2013.07.066]

-
Moreno, T., Perez, N., Reche, C., Martins, V., Miguel, E. de., Capdevila, M., Centelles, S., Minguillon, M.C.,, Amato, F., Alastuey, A., Querol, X., Gibbons, W., (2014), Subway platform air quality: Assessing the influences of tunnel ventilation, train piston effect and station design, Atmospheric Environment, 92, p461-468.
[https://doi.org/10.1016/j.atmosenv.2014.04.043]

- Park, D.U., Ha, K.C., (2008), Characteristics of PM10, PM2.5, CO2 and CO Monitored in Interiors and Platforms of Subway Train in Seoul, Environment International, 34(5), p629-634.
-
Pflitsch, A., Bruene, M., Steiling, B., Killing-Heinze, M., Agnew, B., Irving, M., Lockhart, J., (2012), Air flow measurements in the underground section of a UK Light rail system, Applied Thermal Engineering, 32, p22-30.
[https://doi.org/10.1016/j.applthermaleng.2011.07.030]

- Seoul Metro Subway homepage (http://www.seoulmetro.co.kr, )
-
Song, J., Lee, H., Kim, S.D., Kim, D.S., (2008), How about the IAQ in Subway Environment and Its Management?, Asian Journal of Atmospheric Environment, 2-1, p60-67.
[https://doi.org/10.5572/ajae.2008.2.1.060]

