Efficiency Evaluation of Adsorbents for the Removal of VOC and NO2 in an Underground Subway Station
Abstract
Adsorbent combination studies have been carried out to remove nitrogen dioxide (NO2) and volatile organic compounds (VOCs: BTEX) out of a subway environment characterized by high flow and low concentration. Optimal conditions for the high removal efficiency of the concerned target compounds were obtained through testing a series of control factors such as adsorbent sorts, thicknesses, and superficial velocity. It was found that the efficiencies increased as the specific surface area of activated carbon and its thickness increased, and external void fraction decreased. Furthermore, mixed activated carbon with granular and constructed contents was extensively tested to reduce pressure drop through the carbon bed. It was found that the performance of higher contents of granular activated carbon was better than that of higher contents of the constructed carbon. When the mixed carbon was applied to the subway ventilation system in order to eliminate NO2 and VOC simultaneously, the removal efficiencies were found to be 75% and 85%, respectively.
Keywords:
Nitrogen dioxide, Volatile organic compounds, Activated carbon, Adsorption, Indoor air quality1. INTRODUCTION
Most underground subway stations are directly connected to aboveground transportation including the bus system, and subsequently gas-phase pollutants including volatile organic compounds (VOCs) and nitrogen dioxide(NO2) produced from automobile exhaust flow into subway stations through ventilating openings or stairs, and the pollutants increase in proportion to traffic volume. As a result, it is often the case that the concentration of VOCs and NO2 exceeds standards inside the subway stations. Normally, the subway ventilation system is used to purify outside air before it gets into subway stations or the air inside the subway stations is recycled to improve the indoor air quality. However, inadequate subway ventilation systems in some subway stations have led to poor ventilation, which calls for additional facilities (Johansson and Johansson, 2003). Moreover, the year in which subway ventilation systems were installed in each and every subway station varies, and some facilities are outdated and in need of reinstallation (Kim et al., 2007). However, the existing subway ventilation systems were installed in a limited space in subway stations, making it extremely difficult to reinstall innovative facilities.
To address these problems, one should choose economic and efficient control technologies when controlling pollutants in subway stations after considering numerous factors including physical and chemical characteristics, concentrations, costs and maintenance (Schlegelmich et al., 2005; Fukuyama, 2004; Burgess et al., 2001). However, normal and diverse control technologies produce by-products and have high energy consumption, requiring relatively higher costs, which are not appropriate for subway ventilation systems. Particularly, most common control technologies are applied to areas with high concentrations, and so it is difficult to apply them directly to the indoor ventilation system with such extremely low concentrations. Furthermore, no studies on removing NO2 and VOCs at the indoor environment with low concentration and high flow have been carried out in the world. Considering all these factors, it might be easier to apply the dry type adsorption method using activated carbon to subway stations since the adsorbent is economical and has a porous surface (Brosillon et al., 2003).
The purpose of this study is to provide information to improve the air quality in subway stations by evaluating the performance of dry type adsorption technologies that can be applied to ventilation systems in subway stations which control VOCs and NO2. To this end, the performance of adsorbents will be examined when they were applied to subway stations at an optimum mixture ratio after comparing the control efficiencies of test subjects according to the kind of adsorbents, their thicknesses and mixture ratios.
2. EXPERIMENTAL METHODS
Commercial Granular activated carbon, constructed carbon, charcoal, and activated carbon fiber were used in order to control VOCs and NO2 in this research, as well as toluene known as a material with the highest concentration among VOCs in subway stations as a representative substance. Table 1 shows the basic properties of adsorbents using in this work. Continuousflow tests were carried out in adsorbent beds to particularly study basic control characteristics of toluene and NO2, and based on these results, tests were conducted in actual subway station ventilation systems in order to discover whether the results are applicable in actual locations.
2. 1 System Design
Activated carbon and charcoal were inserted into a half-inch sorbent tube made of Teflon and stainless steel and inserted felt on both sides of the tube in order to prevent the activated carbon from blowing away. Control tests of toluene and NO2 were conducted depending on the different sorts of activated carbon. Based on the control tests of toluene and NO2 depending on the sorts of activated carbon, control tests both depending on the thickness of the adsorption layers and mixed activated carbon were carried out.
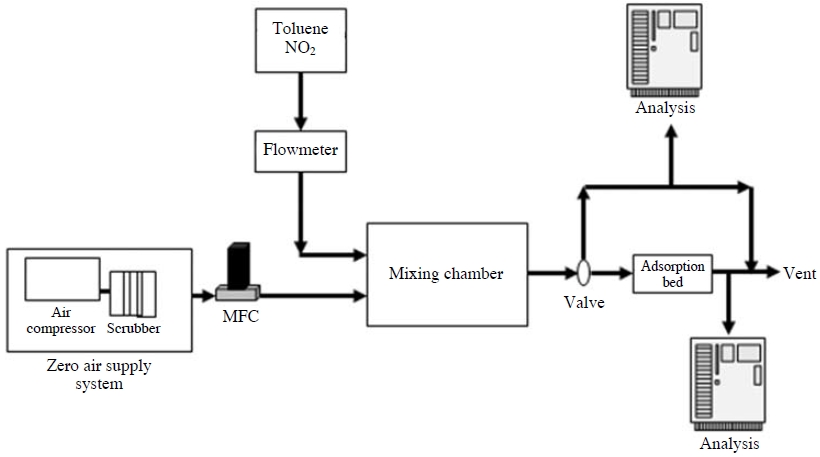
A 250 L/min compressor (NCP01, AM TECH, Korea) was used to provide flow, and a scrubber made of silica gel, purafil and charcoal removed moisture and pollutants (VOCs, SOx, NOx and etc.) in the compressor air. An MFC (Model 5850E, Brooks, Japan) was used so that a consistent flow of 15 L/min and 100 L/min could get into the system. Fig. 1 is a mimetic diagram of the test equipment in a laboratory.
NO2 (19.7 ppm, Regas, Korea) standard gas was used in order to produce toluene and NO2 with stable concentrations. A gas producer composed of a diffusion tube and a temperature control device for toluene were also utilized in this study. In order to consistently provide NO2 and toluene into the adsorption layer, a mixed chamber was used with a Zero Air supply system (Model 701, API, USA). Moreover, a NOx Analyzer (Model 42i, Thermo Scientific, USA), Total Hydrocarbon (THC) measuring equipment in the form of GC/FID (HP 5890, USA), and a Micro FID (Photovac, Inc., USA) were used in order to discover concentrations of NO2 and toluene flowing into the adsorber.
As a continuous flow test in Fig. 1, tests were conducted with concentrations of NO2 and toluene between 100 and 145 ppb, and 30 and 39 ppm, respectively, with thickness variations of adsorption layers of 5, 10, 30 mm. Based on these test results, granular activated carbon and constructed carbon were mixed at ratios of 1 : 3, 1 : 1, and 3 : 1 after considering the removal efficiency of the specific surface area of activated carbon, NO2, and toluene in a bed to evaluate the removal efficiency of the mixed activated carbon (Table 2).
2. 2 Analysis
In order to evaluate the control efficiencies of the VOCs, a solid sorbent tube (Tenax-TA/Carbotrap) adsorbed the VOCs before and after they went through the adsorbent layer. A quantitative analysis for the solid sorbent tube was conducted using GC/FID (HP5890 Series II, Hewlett Packard, U.S.A) and a thermal desorption device (Aero trap desorber, Tekmar 6000, U.S.A.).
NO2 concentrations were measured before and after NO2 passed through the adsorption layer by using Chemiluminescence NOx Analyzer in real time. A 0.45 μm×47 mm membrane filter (Membrane filters cellulose nitrate, MFS®, USA) was used at the sample suction part of the NOx Analyzer to minimize the interference of particulate matter when measuring NO2, and this was analyzed at a flow rate of 600 mL/min.
As many as 7 VOC standard materials were measured with GC/FID/thermal desorber to quantify individual substance concentrations of VOCs from the ventilation system of subway stations in this study. The 7 VOC standard chemicals were calibrated in a total 5 stages with concentration ranges of between 6 and 833 ng, and the correlation coefficient (r2) of the 7 materials was over 0.99, while the RSD was below 2%. Moreover, a Micro FID was used to measure inflow concentration in real time using toluene, and its correlation coefficient was over 0.99.
3. RESULTS AND DISCUSSION
3. 1 The Specific Surface Area
The specific surface area of granular activated carbon, constructed carbon and charcoal was measured using the Brunauer Emmett Teller (BET) measurement method. The results showed that the surface area of granular activated carbon and constructed carbon was 997.3m2/g, and 975.2m2/g, respectively, and this was consistent with the results from earlier research of the specific surface area of granular activated carbon and constructed carbon, which stood at between 300 and 2,500m2/g measured through the BET method (Huang et al., 2002; Chiang et al., 2001). The specific surface area of charcoal stood at as low as 508.1m2/g, which is known to occur due to differences in manufacturing processes between charcoal and activated charcoal. Generally, charcoal is produced through carbonization at a high temperature of 300 to 500°C, and the inside of charcoal is porous and minutely connected. However, activated carbon is made from charcoal after the charcoal goes through a heat treatment of over 1,000°C in order to expand the porosity, and this process is known to make the specific surface area of activated carbon larger compared to charcoal (Gonzalez et al., 2008).
3. 2 Effects of Adsorbents
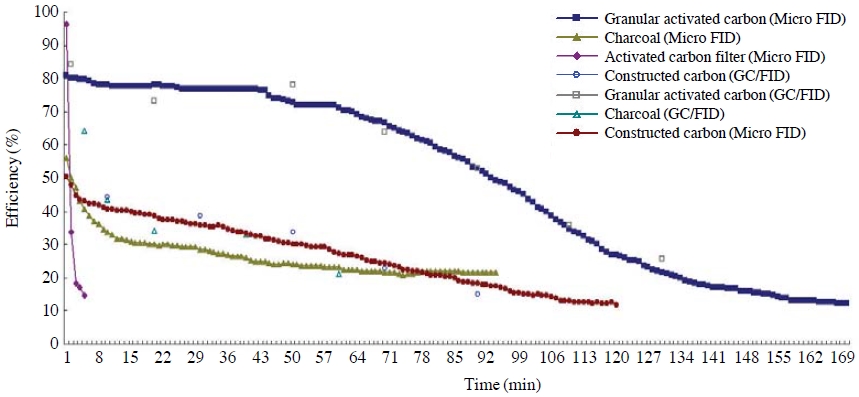
Granular activated carbon, constructed carbon, charcoal, and activated carbon fiber were used while adjusting the concentrations of toluene and NO2 at 30-31 ppm and 0.096 ppm, respectively, in order to the control efficiencies and breakthrough characteristics of toluene and NO2 depending on the sorts of adsorbents at room temperature. The control efficiencies were then checked with the passage of time.
The control efficiency of granular activated carbon was confirmed to be relatively higher at 80% compared to constructed carbon, charcoal, and activated carbon fiber when toluene passed through the adsorbent layer, as shown in Fig. 2. The breakthrough of granular activated carbon started after 60 minutes, and there was not much difference in terms of control efficiency between charcoal and constructed carbon, the latter having a relatively larger specific surface area compared to charcoal. However, the breakthrough of constructed carbon and charcoal occurred after 36 minutes and 5 minutes, respectively. On the other hand, the breakthrough of activated carbon fiber occurred immediately after adsorption started. Such results are consistent with the basic prior research observation that if the specific surface area of activated carbon goes down, the specific surface area for adsorption decreases as well (Haghighat et al., 2008; Kingsley and Davidson, 2006).
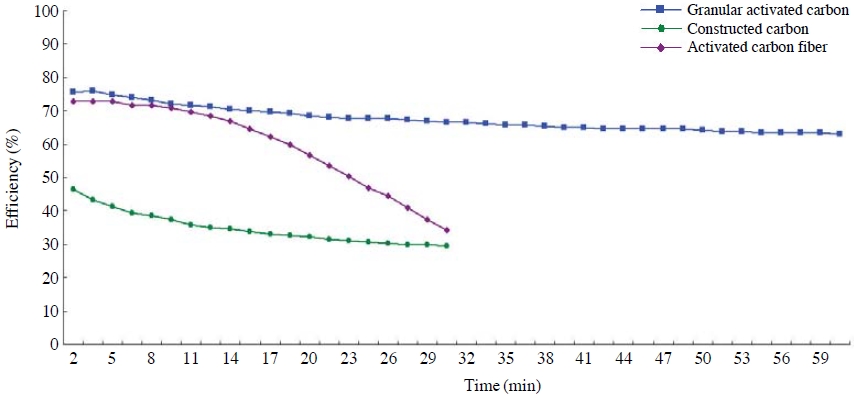
The control efficiency of granular activated carbon with the largest specific surface area stood at around 75%, a figure relatively higher than ones of constructed carbon or activated carbon fiber in terms of NO2, as the toluene test results showed (Fig. 3). In particular, the breakthrough of constructed carbon did not occur in the initial 30 minutes after the test started; however, the control efficiency of constructed carbon was considerably low compared to granular activated carbon. The initial control efficiency of activated carbon fiber is around 73%, similar to granular activated carbon; however, breakthrough rapidly occurred at around 15 minutes afterwards. This is probably because the amount of activated carbon fiber charged into the adsorption layer is relatively small compared to other forms of activated carbon.
The test result gauging the different kinds of activated carbon showed that control efficiencies increased when particles of activated carbon were small and the specific surface area went up regardless of the materials adsorbed into the activated carbon. Such results were in line with the previous research that the absorptive of activated carbon is simply attributable to the increased specific surface area (Kasaoka et al., 1984).
3. 3 Adsorbent Thickness
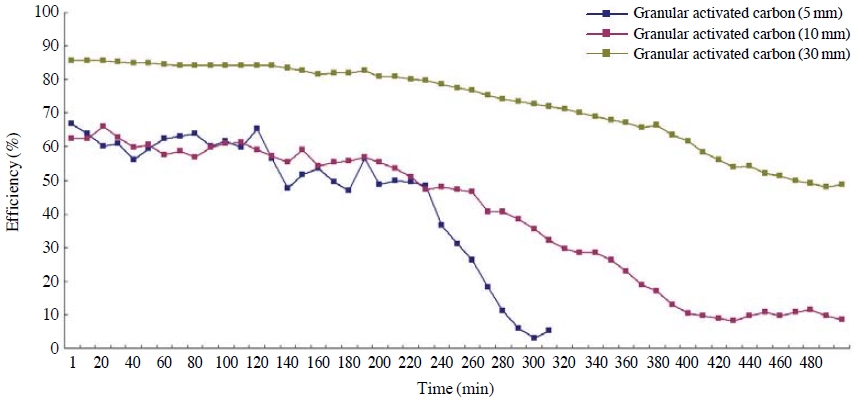
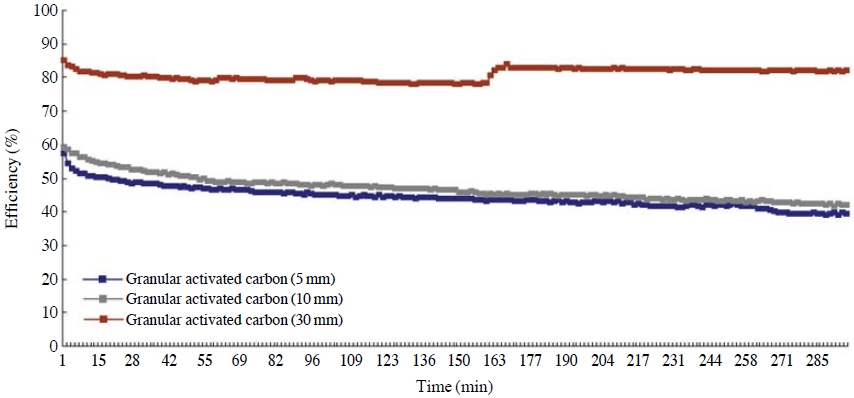
A performance evaluation was conducted in order to compare the adsorbent characteristics depending on the thicknesses of toluene and NO2 adsorption layers by using granular activated carbon with large surface area and highest efficiency while giving thickness variations of adsorption layers between 5 and 30 mm. The results are as shown in Figs. 4 and 5. Concentrations of toluene and NO2 were set at 31-39 ppm, and 0.130-0.145 ppm, respectively, and maintained a linear velocity of 1.2 m/s.
Based on this research, the control efficiency of toluene was found to be highest at 85% when the thickness of the adsorption layer was 30 mm. There was not much difference in the removal efficiencies in the initial 230 minutes when the thicknesses of adsorption layers were 5 mm and 10 mm; however, the efficiency significantly dropped after 230 minutes when the thickness was 5 mm. Based on this result, it was found that if the adsorption layer of the activated carbon becomes thicker, the residence time of the adsorbate gets longer after it passes through the adsorption layer, and this subsequently increases the adsorption and the removal efficiency as well. In the same context, the breakthrough time was found to be reduced if the adsorption layer becomes thinner.
The control efficiencies of NO2 were evaluated while giving variations to the thicknesses of the adsorption layers, and the efficiency rate of NO2 was about 85% with 30 mm of the adsorption layer, which is a similar result as toluene. The control efficiency with 30mm of the adsorption layer was relatively higher than the efficiency rate with 5 mm or 10 mm of the adsorption layers (Fig. 5). However, there was not much difference in the control efficiency when the adsorption layer was 5 mm and 10 mm, and this is probably because the concentration of test material, NO2, is extremely low compare to toluene, which makes its breakthrough take so long. Accordingly, if the amount of activated carbon charged on the adsorption layer increases, the specific surface area that can adsorb NO2 rises as well, making the efficiency go up, which is similar result to other prior research (Ma et al., 2008).
3. 4 Pressure Drop
The pressure drop is an important control variable along with the control efficiency in terms of the effective application of adsorbents in certain sites. The pressure drop was measured depending on the linear velocity, the thicknesses of granular activated carbon, constructed carbon, and mixed activated carbon in order to evaluate the pressure drop with different sorts of adsorbents. At this time, the thicknesses of adsorbent layers were 5 mm, 10 mm, and 30 mm with linear velocities of 4.6 m/s, 2.5 m/s, and 1.2 m/s, respectively.
As the linear velocity increased and the thickness of the layer became thicker, the pressure drop of the granular activated carbon, constructed carbon and charcoal clearly increased as well. When comparing the pressure drop depending on the sort of adsorbents, the pressure drop of three adsorbents was similar at 9,806.7 Pa under conditions of a 5 mm of adsorbent layer, and a 1.2 m/s linear velocity. However, the pressure drop of constructed activated carbon was the lowest when the linear velocity was increased to 2.5 m/s and the activated carbon thickened to 10 mm. Moreover, the pressure drop of granular activated carbon and charcoal increased by 25.9% and 33.3%, respectively, compared to the pressure drop of constructed carbon; however, when the thickness increased by 30 mm, the pressure drop of granular activated carbon and charcoal increased by 31.5% compared to constructed activated carbon. Still, the pressure drop of mixed activated carbon was similar to that of constructed activated carbon. Regardless of its thickness, the pressure drop of constructed carbon was at its lowest both when the linear velocity was at 4.6 m/s and at 2.5 m/s. Yet the pressure drop was lower compared to granular activated carbon and charcoal by 30.3% and 37.8%, respectively, when the thickness of adsorption layer was 10 mm. And pressure drop was lower by 31.2% when the thickness was 30 mm. At the same moment, the pressure drop of mixed activated carbon was similar to the value of constructed activated carbon, the same as when the linear velocity was 2.5 m/s. It is assumed that the major reasons for such pressure drop differences are attributable to the percentages of voids between adsorbents.
3. 5 Mixed Ratios of Adsorbents
As the test results from 3.1, 3.2, and 3.3, granular activated carbon has a larger specific surface area compared to other activated carbons, with excellent control efficiency on the test materials; however, it had a relatively higher pressure drop relative to other activated carbons. Accordingly, additional research was conducted by mixing granular activated carbon and constructed carbon, which showed the lowest pressure drop, in order to reduce pressure drop of the granular activated carbon. At that moment, the ratios of granular activated carbon and constructed carbon were adjusted to 1 : 1, 1 : 3, and 3 : 1 based on the thickness of the adsorbent layer at 30 mm. A 29 to 31 ppm of toluene gas and a 0.120 to 0.130 ppm of NO2 gas passed through the adsorption layer at a linear velocity of 1.2 m/s, and the control efficiency was checked depending on the mixed ratio of mixed activated carbon. The ratios of granular activated carbon and constructed carbon on toluene and NO2 were 3 : 1>1 : 1>1 : 3. This result showed that adsorbent ratios are decided by the specific surface area, which is in line with a number of prior researches (Haghighat et al., 2008, Kingsley and Davidson, 2006). Moreover, smaller voids between activated carbon increase the residence time and the specific surface area for adsorbate to be adsorbed, which leads to a higher control efficiency (Ma et al., 2008). Based on these results, it is assumed that more granular activated carbon, which has greater specific surface area and small voids between activated carbon, will increase the removal efficiency when granular activated carbon and constructed carbon were mixed.
3. 6 Site Application
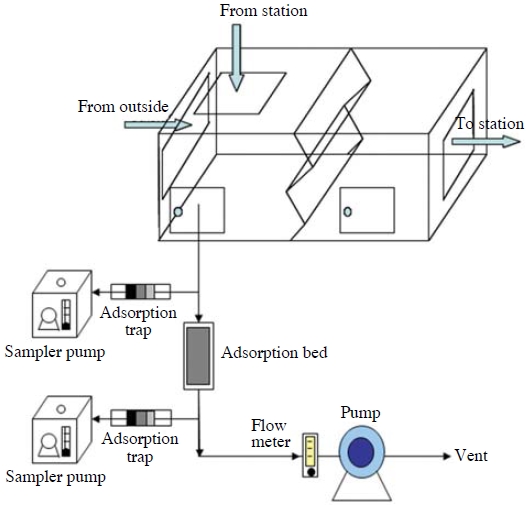
Subway ventilation systems were tested in order to evaluate the simultaneous control efficiencies of VOCs and NO2. A suction pump was utilized for the activated carbon control process in the ventilation system to take in incoming air from the ventilation system in order to measure gas in real time before and after the air passed through the adsorbent layer (Mixed activated carbon: ratio of granular activated carbon and constructed carbon 3 : 1). The linear velocity, when taking in the incoming air of the ventilation system using the suction pump, was set at 2.5 m/s since the design standard of the subway ventilation system was at 2.5 m/s. Fig. 6 shows a mimetic diagram of the activated carbon control process applied to the site.
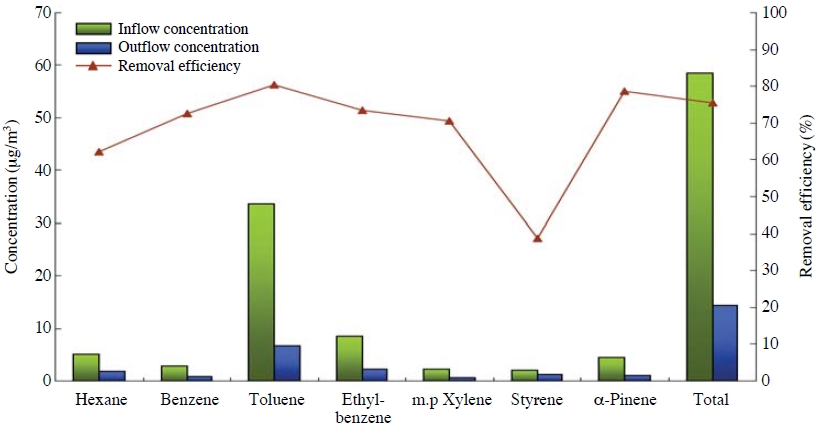
Toluene was found to have the highest concentration among the test chemicals analyzed by GC/FID/thermal desorber. Moreover, ratios of test materials (hexane, benzene, toluene, ethylbenzene, xylene, styrene, α-pinene) on the basis of styrene are 2.5, 1.4, 16.5, 4.2, 1.1, 1.0, and 2.2, and these tendencies were similarly found in elsewhere when measured VOCs (Chan et al., 2003; Lau and Chan, 2003).
The removal efficiencies of mixed activated carbon for those compounds was found at 62.1%, 72.6%, 80.3 %, 73.4%, 70.41%, 38.7%, and 78.7%, respectively, as shown in Fig. 7. The removal efficiency of toluene was highest, while the removal efficiency for the entire VOCs (TVOC) stood at 75.4%. It is assumed that if the concentration of adsorbate goes up under the same conditions, adsorbed amounts per hour will increase as well since molecules that can be adsorbed grow and since the speed of spread and adsorption velocity toward minute pores rise.
On the other hand, the concentration of NO2 flowing into the ventilation system was around 70 ppb, and the concentration of NO2, which went through the filter installed in the existing ventilation system, stood at 58.8 ppb, which is an extremely low 16% of the removal efficiency. The concentration of NO2 passing through mixed activated carbon was 9.3 ppb, which is 86.7% of the removal efficiency, a 5.4 times higher removal efficiency than the control efficiency of the existing dust filter. It is assumed that the low control efficiency of NO2 in the dust filter installed in the existing ventilation system stems from the filter inside the system, which is a panel type made of felt, and this is not appropriate for controlling gas phase pollutants.
4. CONCLUSIONS
In this research, the control efficiencies of various adsorbents including granular activated carbon, constructed carbon, charcoal, and activated carbon were evaluated in order to simultaneously control compound gas phase substances such as VOCs and NO2 inside subways stations. The results showed that granular activated carbon had the highest control efficiencies of 80% and 75% on VOCs and NO2, respectively, and the breakthrough points and control efficiencies were improved when adsorption layers become thicker since thicker layers increase the residence time of adsorbate and activated carbon. Furthermore, the mixed activated carbon was studied while simultaneously considering control efficiencies and pressure drops in order to apply the adsorbents with the optimal conditions on site. In this study, the optimal control efficiencies were found when the ratio of granular activated carbon and constructed carbon was 3 : 1.
Based on these results, relatively effective removal efficiencies of approximately 80% for gas phase materials were obtained from the subway ventilation system with high flux and low concentrations. It is concluded that if mixed activated carbon bed is manufactured like the same panel type filters installed in the existing subway ventilation systems, it can actually be applied to the subway ventilation systems since the treatment process is economical, easy to handle and simpler overall than other control technologies. Additional research with a wide variety of conditions will bring out even more efficient ways to remove gas phase materials.
Acknowledgments
This research was conducted with support from the Seoul Development Institute (CS070160).
REFERENCES
- Brosillon, S., Helenemanero, M., Oelfoussard, J., (2003), Mass transfer in VOC adsorption on zeolite: experimental and theoretical breakthrough curves, Environmental Science & Technology, 35, p3571-3574.
-
Burgess, J.E., Parsons, S.A., Stuetz, R.M., (2001), Developments in odor control and waste gas treatment biotechnology: a review, Biotechnology Advances, 19, p35-63.
[https://doi.org/10.1016/s0734-9750(00)00058-6]

-
Chan, L.Y., Lau, W.L., Wang, X.M., Tang, J.H., (2003), Preliminary measurements of aromatic VOCs in public transportation modes in Guangzhou, China, Environment International, 29, p429-435.
[https://doi.org/10.1016/s0160-4120(02)00189-7]

-
Chiang, Y., Chiang, P., Huang, C., (2001), Effect of pore structure and temperature on VOC adsorption on activated carbon, Carbon, 39, p523-534.
[https://doi.org/10.1016/s0008-6223(00)00161-5]

- Fukuyama, J., (2004), Odor pollution control for various odor emission sources in Japan, East Asia Workshop on Odor Measurement and Control Review, Office of Odor, Noise and Vibration, Environmental Management Bureau, Ministry of the Environment, Government of Japan, p67-77.
- Gonzalez, J.D., Kim, M.R., Buonomo, E.L., Bonelli, P.R., Cukierman, A.L., (2008), Pyrolysis of biomass from sustainable energy plantation: Effect of mineral matter reduction on kinetics and charcoal pore structure, Energy sources part A- Recovery Utilization and Environmental Effects, 30(9), p809-817.
-
Haghighat, F., Lee, C.-S., Pant, B., Bolourani, G., Lakdawala, N., Bastani, A., (2008), Evaluation of various activated carbons for air cleaning-Towards design of immune and sustainable buildings, Atmospheric Environment, 42, p8176-8184.
[https://doi.org/10.1016/j.atmosenv.2008.07.061]

-
Huang, M., Chou, C., Teng, H., (2002), Pore-size effects on activated-carbon capacities for volatile organic compound adsorption, AIChE Journal, 48(8), p1804-1810.
[https://doi.org/10.1002/aic.690480820]

-
Johansson, C., Johansson, P., (2003), Particulate matter in the underground of Stockholm, Atmospheric Environment, 37, p3-9.
[https://doi.org/10.1016/s1352-2310(02)00833-6]

- Kasaoka, S., Sakata, K., Tanaka, E., Naitoh, R., (1984), Design of molecular sieve carbon, studies on the adsorption of various dyes in the liquid phase, International Chemical Engineering, 24, p734-742.
- Kim, K.Y., Kim, Y.S., Roh, Y.M., Lee, C.M., Kim, C.N., (2007), Spatial distribution of particulate matter (PM10 and PM2.5) in Seoul Metropolitan Subway station, Journal of Hazardous Materials, 154(1-3), p440-443.
-
Kingsley, M.L., Davidson, J.H., (2006), Adsorption of toluene onto activated carbons exposed to 100 ppb ozone, Carbon, 44(3), p560-564.
[https://doi.org/10.1016/j.carbon.2005.08.002]

-
Lau, W.L., Chan, L.Y., (2003), Commuter exposure to aromatic VOCs in public transportation modes in Hong Kong, The Science of the Total Environment, 308, p143-155.
[https://doi.org/10.1016/s0048-9697(02)00647-2]

-
Ma, X., Yang, D., Zhou, W., Zhang, C., Pan, X., Xu, L., Wu, M., Ma, J., (2008), Evaluation of activated carbon adsorbent for fuel cell cathode air filtration, Journal of Power Sources, 175, p383-389.
[https://doi.org/10.1016/j.jpowsour.2007.08.116]

-
Schlegelmilch, M., Streese, J., Stegmann, R., (2005), Odor management and treatment technologies: An overview, Waste Management, 25(9), p928-939.
[https://doi.org/10.1016/j.wasman.2005.07.006]


