An Orchestrated Attempt to Determine the Chemical Properties of Asian Dust Particles by PIXE and XRF Techniques
Abstract
An orchestrated attempt was made to analyze samples of bulk and individual particulate matters (PM) collected at the Gosan ground-based station on the west coast of Jeju, Korea. A two-stage filter pack sampler was operated to collect particles in both large (>1.2 μm) and small size fractions (<1.2 μm) between the Asian dust (hereafter called “AD”) storm event and non-Asian dust period. Elemental components in bulk and individual particles were determined by PIXE and synchrotron XRF analysis systems, respectively. To assess the transport pathways of air parcels and to determine the spatial distribution of PM, the backward trajectories of the Meteorological Data Explorer (Center for Global Environmental Research, 2010) and the NOAA’s HYSPLIT dispersion-trajectory models were applied. In line with general expectations, Si and other crustal elements in large size particles showed considerably higher mass loading on AD days in comparison with non-AD days. Computation of the crustal enrichment factors [(Z/Si)particle/(Z/Si)desert sand] of elements in large size particles (>1.2 μm) allowed us to estimate the source profile and chemical aging of AD particles as well as to classify the soil-origin elements. On the basis of a single particle analysis, individual AD particles are classified into three distinct groups (neutralized mineral particles, S-rich mineral particles, and imperfectly neutralized particles).
Keywords:
Aerosol, Asian dust, Individual particles, PIXE, XRF technique, Jeju1. INTRODUCTION
The AD storm originating from the arid deserts of Mongolia and China is a well-known meteorological phenomenon throughout East Asia. In recent years, this natural hazard has been observed not only in springtime but also in fall and winter (Mobile Yonhap News, 2008; The Mainichi Newspaper, 2005).
In order to understand sources, mechanisms of transport, and the physicochemical characteristics of AD (including its effects on radiation), enormous researches have been performed with respect to AD storms over the past three decades (Kim et al., 2003; Ma et al., 2001a; Zhang et al., 2001; Song and Carmichael, 1999; Wang and Guanghua, 1996; Iwasaka et al., 1988; Braaten and Cahill, 1986; Duce et al., 1980). However, our knowledge is still limited regarding their source types and emission strength simultaneously. To learn more about dust particles, it is important to understand the distribution and transport phenomena of trace components in the dust storm as well as their chemical transformation. Most importantly, large pieces of information on the local dust sources are a prerequisite to the elucidation of the complicated aging processes of dust particles. When aerosol components are mixed internally with each other, the microphysical and optical properties of the aerosol can be altered. To describe gas-to-particle transformations, coagulation, and growth processes of particles, one has to take into account of chemical properties such as the homogeneity of individual particles. In addition, an investigation into the properties of single particles is essential to characterize chemical reactions in the atmosphere. Moreover, in some cases, the data derived by single particle analysis can be further used for the assessment of its source inventory. However, single particle analysis is disadvantageous in that it requires extended time to cover samples of large particle number. As only a certain portion of particles becomes the target of analysis, it is difficult to provide the full configuration of particle property. Hence, in order to supplement this drawback of single particle analysis, a chemical analysis of particles is often accompanied through the collection of many particles on a filter media and subsequent bulk-sample analysis. The combined study of single and bulk particle complements can thus provide valuable pieces of information with each other relative to the separate application of each technique.
In an effort to provide some insights into AD phenomenon in this study, the orchestrated application of bulk and single particle analyses was undertaken in a receptor area with the regional significance for air parcel transport.
2. EXPERIMENTAL METHODS
2. 1 Particle Collection
In April 2001, several big scale dust storms developed over the Gobi desert in northern China. Both satellite remote sensing data and analyses of meteorological conditions demonstrated its long-range transport from China to the United States via Korean Peninsula over a period of several weeks (Szykman et al., 2003).
Particle collections were carried out at Gosan located at the western tip of Jeju Island, Korea (Fig. 1). The surface-based sampling site at Gosan, which had been in operation as one of the super sites during ACE-Asia, is about 70 m above sea level and 100 m southwest from Jeju upper air meteorological station. This site has been investigated intensively as one of the most optimal locations for AD research in Korea as well as throughout the world. Its geographical location as the outbound transport pathways of AD took have the advantage of offering useful information on the AD occurrence, as described in elsewhere (Kang et al., 2007; Park et al., 2004).
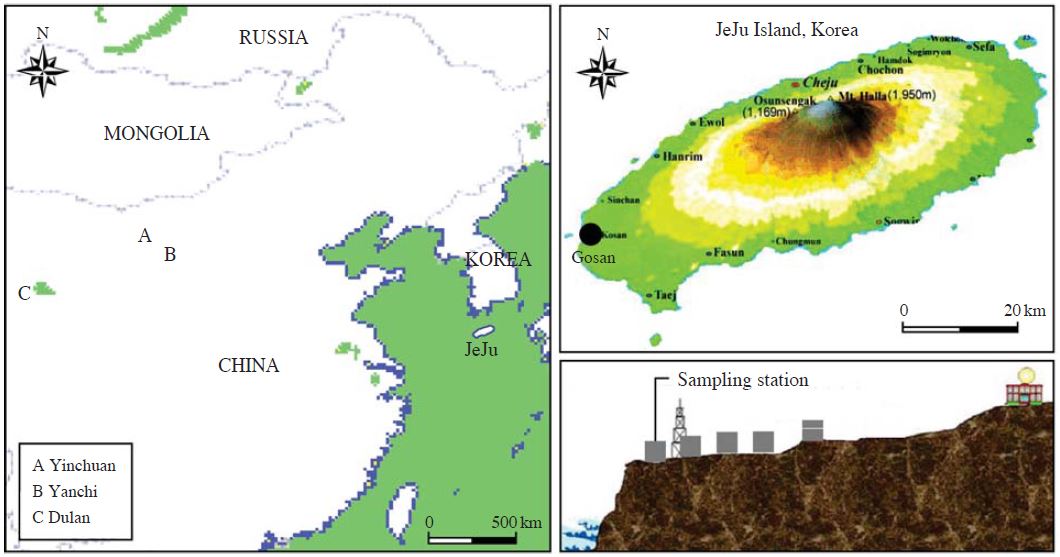
Maps showing a particle sampling site (a filled circle: 33.17°N and 126.10°E) along with three desert sand collection points in China.
The size discrimination of ambient particles has been generally recognized as fine and coarse particles. In general, fine particle (PM2.5) is defined as airborne particles which are smaller than coarse particle (PM10-2.5). This size classification of ambient particles is basically originated from a link between PM2.5 and mortality (in more detail, the relationship between human respiratory system and particle size (e.g., the thoracic particulate matter (PM10) and penetrating particle (PM2.5))) and their formation processes.
Meanwhile, in the study of AD particles, the results of previous field studies (Hwang et al., 2008; Ma et al., 2005) showed that particles larger than 1 μm were remarkably increased during AD event. In addition, the particle mass concentration on AD event showing the bimodal distribution was enriched in relatively large particles (Dp>1.6 μm) (Ma and Choi, 2007). For these reasons, in this study, a two-stage filter pack sampler (Tokyo Dylec Co.) which can collect particles in both large (>1.2 μm) and small size fractions (<1.2 μm) was operated to collect size-resolved AD particles on April 12, 2001, when the outbreak of a thick yellowish AD was recorded by the ground-based in-situ monitoring system (and aircraft measurements). In addition, as an ancillary sample of AD, the collection of non-AD samples was executed in the same way (April 30, 2001).
This sampler collects the large (>1.2 μm) and small size (<1.2 μm) fractions of aerosols separately on a prefilter (a 47 mm diameter, 8 μm rated pore size Nuclepore ® filter with 1×105 cm-2 pore density and 1 mg cm-2 nominal wt.) and a back-up filter (a 47 mm diameter, 0.4 μm rated pore size Nuclepore® filter with 1×108 cm-2 pore density and 1 mg cm-2 nominal wt.), respectively. The 50% cut-off diameter of the prefilter with 25 L min-1 flow rate was estimated to be 1.2 μm equivalent aerodynamic diameter (Ma et al., 2001a; Kasahara et al., 1996). The mechanisms by which particles are arrested on the Nuclepore® filter are Brownian diffusion, interception, and inertial impaction. Efficiencies for the separation processes relate to the governing variables such as particle size, aerosol approach velocity, and filter pore size (Smith et al., 1976).
The duration of sampling was adjusted to 20 minutes (April 12, 08:40 to 09:00 (UTC)) and 3 hours (April 30, 06:00 to 09:00 (UTC)) in AD event and non-AD days, respectively.
After sealing Petri dish (50×9 mm) containing filter with Teflon tape and wrapping with aluminum foil, every sample was placed in a cold storage bag during air transportation.
During the first sampling time, the wind speed was recorded in the range of 15.2-20.5 m s-1 with the dominant westerlies. Temperature and relative humidity in the sampling period averaged 13.6°C and 56%, respectively.
Meanwhile, on a non-AD day (April 30, 2001) wind speed was comparatively weak (5.7 m s-1) and it was blown form the south. The mean temperature and relative humidity were around 15.7°C and 73%, respectively.
2. 2 Elemental Analysis
Particle induced X-ray emission (PIXE) technique, which is well-known for its high sensitivity, was employed in the elemental detection of bulk samples. For PIXE analysis, a proton beam of 6 mm diameter and 2.0 MeV energy was accelerated by a Tandem Cockcroft accelerator. Beam intensities from 10 to 60 nA were employed with a total dose of about 20 μC. An X-ray with an energy up to 14.8 keV was emitted from the target and detected by a Si(Li) detector with a resolution of 152 eV at 5.9 keV. The target and detector were set at 90°and 135°, respectively, with respect to the direction of the ion beam. The count rates for X-rays were kept below 1,000 pulses per second to prevent a pile up. The calibration method of PIXE was similar to those described elsewhere (Kasahara et al., 1993) and can be described briefly as follows: The relationship between X-ray yield and the mass thickness was measured at first using the 18 single element standard samples prepared by a vacuum deposition method. The sensitivity, if defined by the ratio of (PIXE yield per unit dose)/(mass thickness), can be determined experimentally and theoretically for all objective elements. For instance, the sensitivity of calcium was calculated to be 1,700 (counts∙cm2/μC∙μg)with a detection limit of 9.4×10⁻³ (μg/cm2).
The ultra trace elements in the individual large size particles with their size greater than 1.2 μm were identified by an X-ray microprobe system equipped at the Super Photon ring 8 GeV (SPring-8), BL-37XU. Through this micro-analytical technique based on the X-ray fluorescence (XRF) method, multiple elements were successfully analyzed with femtogram level sensitivity.
A sample was placed on the XY scanning stage in a vacuum chamber, and the sample areas (500-1,000 μm2 each time) were selected randomly and scanned by the microbeam. The takeoff angle of 10°was used for the measurement of X-ray fluorescence. The intensity of the incident X-rays was monitored by an ionization chamber. The XRF elemental image of aerosol particles can be obtained via the scanning processes. The point analysis for individual particles was then carried out. The fluorescence X-rays were recorded with a Si(Li) detector placed in the electron orbit plane of the storage ring. The detector was mounted at 90° to the incident X-rays to minimize the background caused by the scattering. More details about analytical procedures and experimental setups used for XRF microprobe analysis were described elsewhere (Hayakawa et al., 2001). By means of this XRF analytical technique, a total of 250 particles collected on April 12, 2001 were analyzed.
3. RESULTS AND DISCUSSION
3. 1 Simulated Trajectories of AD
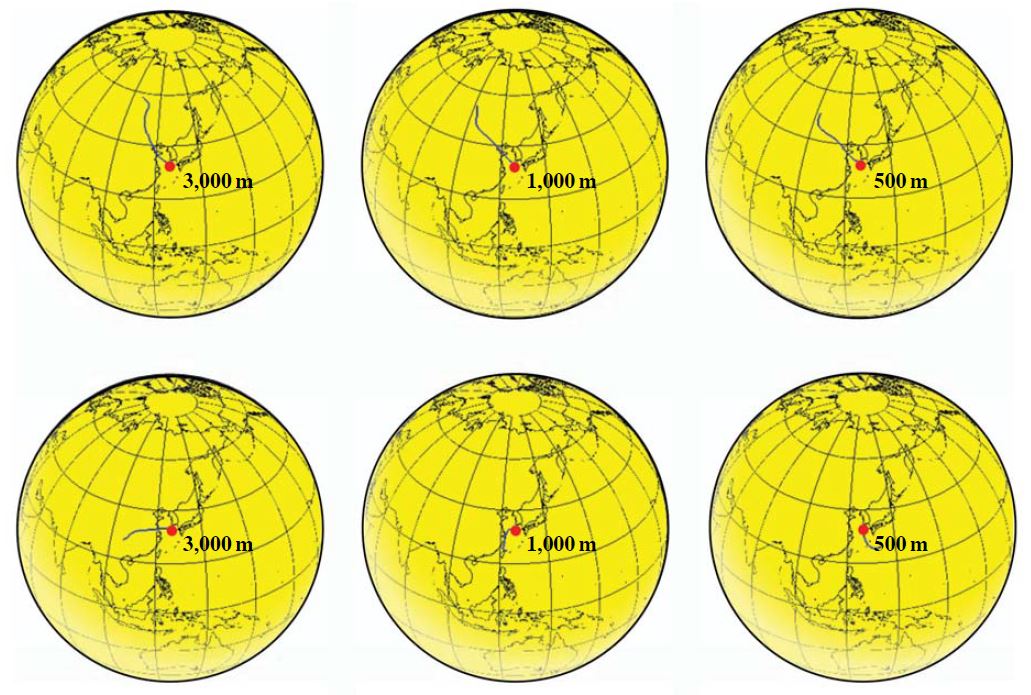
The movements of air parcel in two field events were simulated through backward trajectories starting at Gosan, Jeju based on the Meteorological Data Explorer (METEX) (Center for Global Environmental Research, 2010). Three-day backward trajectories (origin 33.17°N; 126.10°E) were computed at three different altitude levels of 500, 1,000, and 3,000 m. Fig. 2 shows the result of backward trajectories calculated at those three altitude levels in two in-situ measurements. The analysis of air parcel movement pathways suggests that air parcels were transported to the Gosan site through the desert areas on April 12, 2001 (Fig. 2). On the other hand, on April 30, 2001 the air parcel transport pathways stemmed from southwest and southern directions.
3. 2 Transport and Spatial Distribution of PM during AD Event
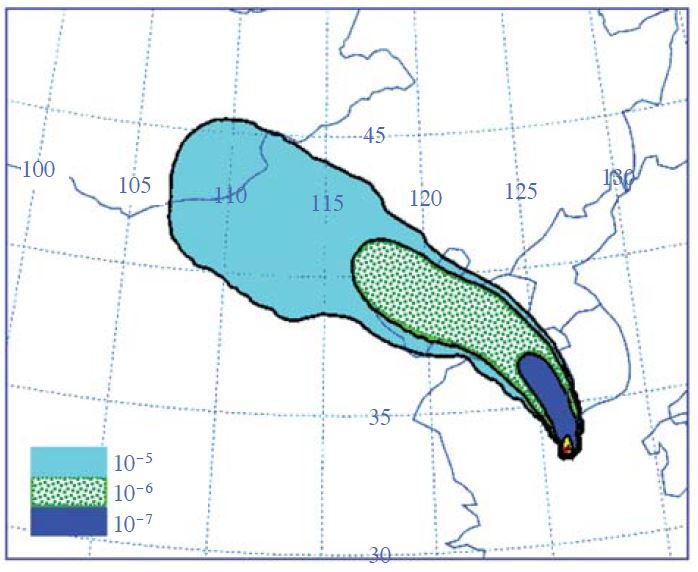
To account for the origin of enhanced PM levels encountered at the Gosan sampling location on April 12, 2001, the National Oceanic Atmospheric Administration (NOAA) HYbrid Single-Particle Lagrangian Integrated Trajectory (HYSPLIT) dispersion-trajectory model “backwards” (http://www.arl.noaa.gov) was applied. Fig. 3 displays the simulated backward aerosol dispersion started at Gosan receptor site for 72 hours. In Fig. 3, the area scales indicate the integrated aerosol concentration between in altitudes 100 and 1,000 m. As shown in Fig. 3, the aerosol dispersion on April 12, 2001 initially followed a southeastern route toward central and eastern China which then subsequently turned toward the western coast of the Korean Peninsula. Thus, the high PM value at the Gosan receptor site was undoubtedly affected by long-range transport of the particulate matter driven from the desert areas in China such as Gobi.
3. 3 Characteristics of Bulk Particles during AD
A list of particle mass, elemental concentrations, and their ratios (e.g., (large size PM/small size PM) and (b of AD/b of n-AD)) of bulk particles is made for two different cases: (1) the intensive dust storm event (i.e., an unusually huge dust storm developed on April 12, 2001) and (2) a non-dust storm day (April 30, 2001) (Table 1). Unfortunately, as the analytical sensitivity of our PIXE is relatively low for Al, Al data were excluded from further evaluation in the present study.

Mass and elemental concentration (ng m-3) of particles collected during Asian dust (AD) storm event (Apr. 12, 2001) and a non-Asian dust (n-AD) storm day (Apr. 30, 2001).
The large size particle fraction in the AD event, as expected, showed mass concentrations that are roughly 14 times higher than those measured on a non-AD day. In particular, the mass concentration of small size particles in company with large size particles was also found to be significantly high in AD relative to the non-AD period. The definite increase in small size particle masses along with AD was previously mentioned (Ma et al., 2001b). In addition, the small size particle mass in the AD event was elevated (e.g., approximately times relative to that of urban area). Hence, it confirms the potential role of AD in determining the budget of small size particles.
The mass concentration of the most representative soil components (Si, K, Ca, and Fe) in the large particle mode on AD day marked 37.2 μg m-3. These soil-originated elements accounted for 17.4% of total particle mass. In contrast, those of the non-AD day showed 0.4 μg m-3 (2.5% of total particle mass).
The ratio of elemental mass concentration (b/a) suggests that mineral origin components (e. g., Si, Ca, and Fe) were mainly distributed in large size particles during AD event. Among them, the ratios (b/a) of S and Fe during AD are higher about 2.7 and 4.6 times than those of non-AD period, respectively. The ratio (b/a) of Cl showing absolutely high level (704.5) was probably caused by the sea-salt from the bursting of sea water bubbles by strong wind speed (15.2-20.5m s-1) during AD event. As shown in the last column of Table 1, the mass concentrations of Si, Ca, and Fe in large size particles collected during AD event show overwhelmingly high levels (Si; 102.9, Ca; 83.9, and Fe; 199.5) compared to those of non-AD particles. Furthermore, the ratios of Mn and V [(b in AD)/(b in n-AD)] suggest that the episodically strong AD storm carried not only dust, but also anthropogenic pollutants to our sampling site.
As mentioned earlier, an air parcel was seen to pass over central China (i.e., our sand collection points) and then it turned toward the east. Through the characterization of the factors affecting the elemental properties between the desert sand and AD particles at a receptor area, one may collect evidence to account for the source profile and chemical aging of AD particles. Fig. 4 shows the crustal enrichment factors [(Z/Si)particle/(Z/Si)desert sand] of elements in large size particles (>1.2 μm) collected on the AD day at a ground-based site on the west coast of Jeju Island, Korea. The elemental characteristics of the local desert sand had already been referred to by Ma et al. (2008). Although Al is the most representative soil component, Si was used as reference for enrichment factor computation because, as mentioned already, Al could not be reasonably analyzed by our PIXE technique.
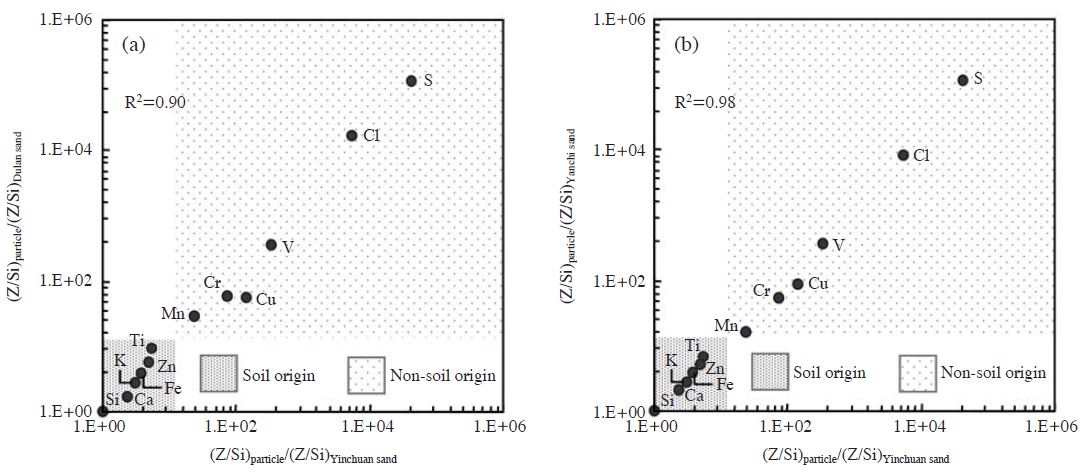
Crustal enrichment factors of elements in large size particles (>1.2 μm) collected in AD event at ground-based site on the west coast of Jeju Island. Crustal enrichment factors were calculated by the elemental components in three different desert sands ((a): Yinchuan vs. Dulan, (b): Yinchuan vs. Yanchi).
Although there is no large difference in coefficient of determination (R2) between the two plots, the plot of [(Z/Si)particle/(Z/Si)Yinchuan sand] vs. [(Z/Si)particle/(Z/Si)Yanchi sand] (R2~0.98) exhibited slightly enhanced correlations relative to [(Z/Si)particle/(Z/Si)Yinchuan sand] vs. [(Z/Si)particle/(Z/Si)Dulan sand] (R2~0.90).
According to the result of backward trajectories (Fig. 2), an air parcel was seen to travel in a south-easterly direction close to the Yinchuan and Yanch deserts. This must be the reason why the R square levels are somewhat different from each other. This result also indicates that the chemical nature of the sands distributed at each desert area should be dissimilar to each other. Moreover, as shown in Fig. 5, calculation of crustal enrichment factors allows us to fractionate soil-origin components from all detected elements.
3. 4 Characteristics of Individual Particles
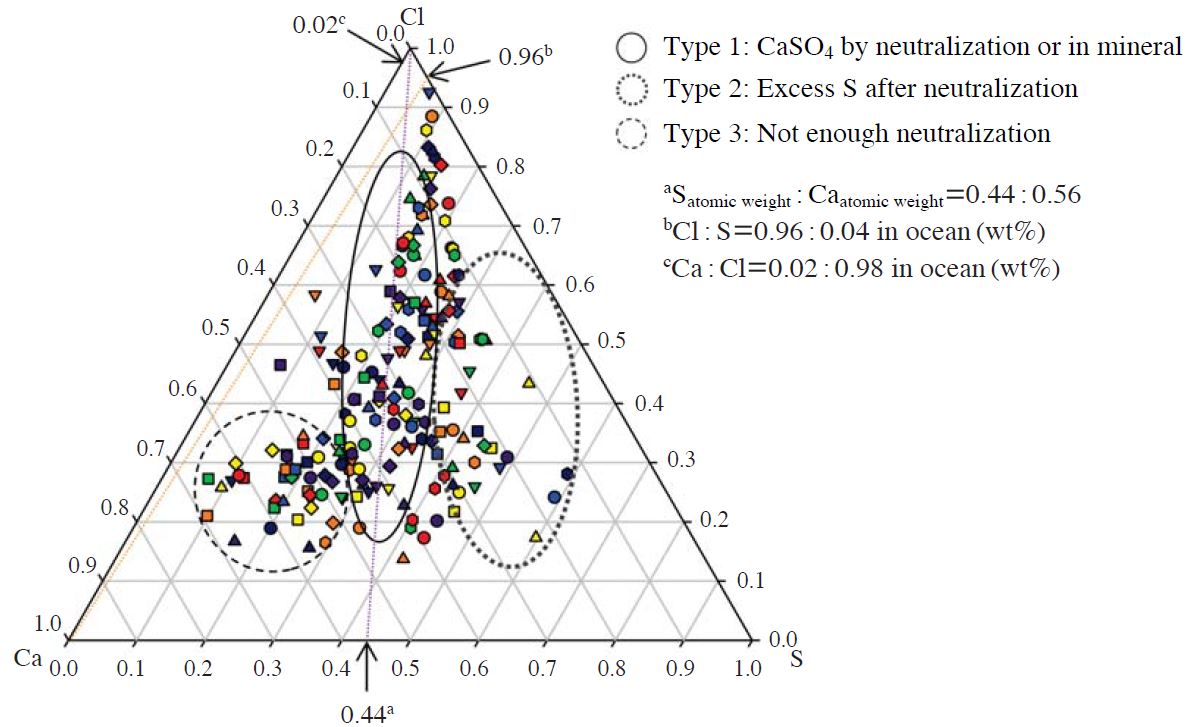
Fig. 5 displays the ternary plot of the relative mass ratios of the three major elements S, Cl, and Ca for the entire 250 individual AD particles. From the ratios of atomic weight for S and the weight % of Cl, S and Ca in ocean, individual AD particles can be classified into four distinct groups. The Type 1-group, namely, the CaSO4 particle formed from the neutralization of H2SO4 by CaCO3 (or CaSO4 as natural mineral) accounted for a large portion of the total particles. One of minor groups of particles is Type-2, in which SO2 was excessively attached to the particles along with the neutralized CaSO4. In the case of the Type-3, the particles did not go through sufficient neutralization processes.
Fig. 6 shows the particle-to-particle variation of the elemental mass in individual large particles (>1.2 μm). The length of box corresponds to the level of dispersion for elemental mass among individual particles. Almost all elements underwent a substantial change of mass among individual particles. However, there are no a noticeable difference in box length scales between the elements (with the exception of Ni and Cr). It should be noted that this unique property of elemental mass distribution among particles cannot be evaluated from a common bulk sample analysis. The Cu mass concentration, forming a box in a compact mass, probably did not origin from particles but should have been that of the sample holder of XRF system.
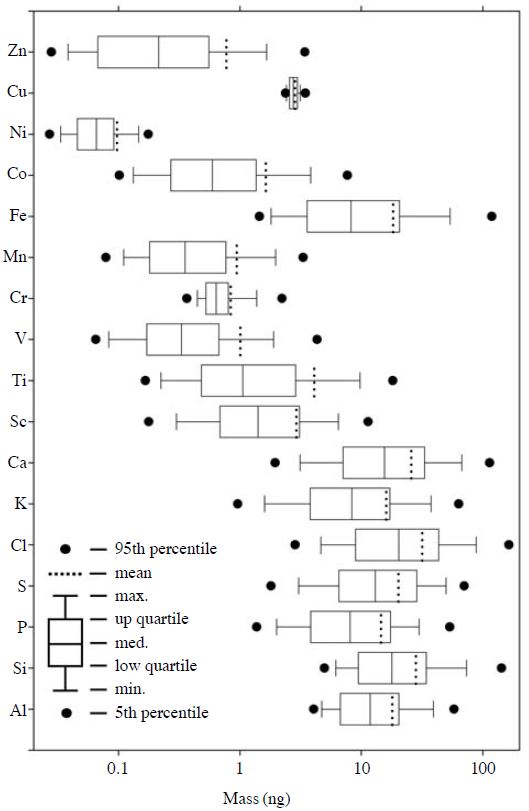
Box plots of each elemental mass of individual large size particles (>1.2 μm) collected at ground-based site on the west coast of Jeju Island, Korea.
If one assumes that S is derived mainly wholly from CaSO4, the mass of CaSO4 can be theoretically estimated by the S mass times the ratio of CaSO4molecular weight/Satomic weight. In the present study, the average S mass is 21.9 ng. CaSO4 mass is about 93.4 ng on the complete supposition of S with CaSO4. If one hypothesizes that Ca in minerals generally exists in the form of both CaSO4 and CaCO3, the mass of Ca from CaCO3 can be estimated from the difference in Ca mass between particles (and that calculated from CaSO4 mass). The average mass of Ca (see Fig. 6) in total particles is 30.04 ng, while the Ca mass in CaSO4 is 27.5 ng (93.4*Ca atomic weight/CaSO4molecular weight). The mass of Ca stemming from CaCO3 can be consequently calculated as 2.9 ng (It presumably corresponds to the Type-3 in Fig. 5).
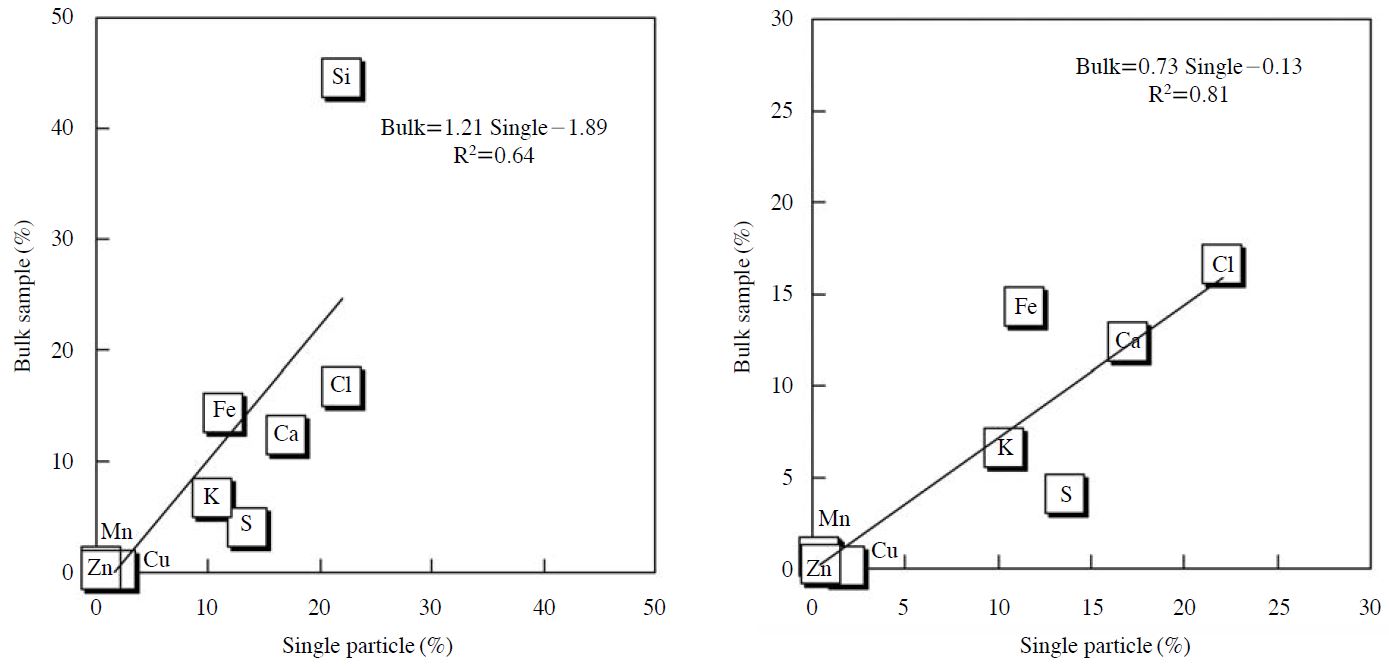
Although single particle analysis has a great many merits, it has also a significant drawback. Because only a certain portion of particles is subject to the analysis, it cannot estimate all the properties of the entire particle. Hence, it should be examined how well the result of single particle analysis can be used to represent the pattern of the whole particle. Fig. 7 shows the plots of the elemental occupation rates (%) in bulk and single particle samples. The results do not show a perfect agreement between bulk and single particles (R2~0.64). However, the entire elements (except Si) tend to maintain relative good correlations (R2~0.81). This result thus suggests that a large number of individual particles are required be analyzed to overcome the discordance with a bulk sample.
4. CONCLUSIONS
The sufficient quantity of data on chemical properties of individual AD particles is absolutely necessary to comprehensively understand the complicated aging processes of dust particles in association with their source and emission characteristics. In the present study, for the purpose of assessing the characteristics of AD particles, an orchestrated application of PIXE and synchrotron XRF analyses was put into execution. The combination of two instrumental approaches was useful to promote a real and effectual understanding of the chemical nature of AD particles arrested in receptor area. However, there is still a slight disagreement between single and bulk analyses over elemental composition. Hence, in order to complement this drawback in single particle analysis, the chemical analysis of particles was also conducted simultaneously by collecting many particles on a filter media, followed by bulk-sample analysis. As shown in this study, acquisition of the data convening the crustal enrichment factors between the receptor particles and the particular sand of local desert lying below an expected air mass pathway route was helpful enough to gain an additional understanding of the source profile as well as chemical aging of AD particles.
Acknowledgments
The synchrotron XRF experiment was performed at the SPring-8 with an approval of the Japan Synchrotron Radiation Research Institute (JASRI). The authors express sincere thanks to Professor S. Hayakawa at the Graduate School of Engineering, Hiroshima University for his experimental support. The authors gratefully acknowledge the NOAA Air Resources Laboratory (ARL) for providing the HYSPLIT transport and dispersion model website (http://www.arl.noaa.gov/ready.html) used in this publication. The METEX program (http://db.cger.nies.go.jp/metex/trajectory.html) for backward trajectory developed and proffered by the National Institute for Environmental Studies, Japan was also helpful to data interpretation.
References
- Braaten, D.A., Cahill, T.A., (1986), Size and composition Asian dust transported to Hawaii, Atmospheric Environment, 20, p1105-1109.
- Center for Global Environmental Research, (2010), Calculate Air Trajectory, http://db.cger.nies.go.jp/metex/trajectory.html.
-
Duce, R.A., Unni, C.K., Ray, B.J., Prospere, J.M., Merrill, J.T., (1980), Long-range atmospheric transport of soil dust from Asia to the tropical north Pacific: temporal variability, Science, 209, p1522-1524.
[https://doi.org/10.1126/science.209.4464.1522]

-
Hayakawa, S., Ikuta, N., Suzuki, M., Wakatsuki, M., Hirokawa, T., (2001), Generation of an X-ray microbeam for spectromicroscopy at SPring-8 BL39XU, Journal of Synchrotron Radiation, 8, p328-330.
[https://doi.org/10.1107/s0909049500018446]

-
Hwang, H.J., Kim, H.K., Ro, C.U., (2008), Single-particle characterization of aerosol samples collected before and during an Asian dust storm in Chuncheon, Korea, Atmospheric Environment, 42, p8738-8746.
[https://doi.org/10.1016/j.atmosenv.2008.08.038]

- Iwasaka, Y., Yamamoto, M., Imasu, R., Ono, A., (1988), Transport of Asian dust particles (KOSA): importance of weak KOSA events on the geochemical cycle of soil particles, Tellus, 40B, p494-503.
-
Kang, C.H., KO, H.J., Zahorowski, W., (2007), Radon and TSP concentrations in the ambient air of Gosan area, Jeju Island between 2001 and 2004, Journal of Korean Society for Atmospheric Environment, 23, p612-624.
[https://doi.org/10.5572/kosae.2007.23.5.612]

-
Kasahara, M., Park, J.H., Chatani, S., (1996), Size distribution and solubility of 15 elements in atmospheric aerosols, International Journal of PIXE, 6, p299-310.
[https://doi.org/10.1142/s0129083596000314]

-
Kasahara, M., Takahashi, K., Sakisaka, M., Tomita, M., (1993), Standard samples and calibration of PIXE analysis, Nuclear Instruments and Methods in Physics Research, B 75, p136-139.
[https://doi.org/10.1016/0168-583x(93)95629-j]

-
Kim, K.H., Choi, G.H., Kang, C.H., Lee, J.H., Kim, J.Y., Youn, Y.H., Lee, S.R., (2003), The chemical composition of fine and coarse particles in relation with the Asian Dust events, Atmospheric Environment, 37, p753-765.
[https://doi.org/10.1016/s1352-2310(02)00954-8]

- Ma, C.J., Choi, K.C., (2007), A combination of bulk and single particle analyses for Asian dust study, Water Air, and Soil Pollution, 183(1), p3-13.
- Ma, C.J., Kasahara, M., Höller, R., Kamiya, T., (2001a), Characteristics of single particles sampled in Japan during the Asian dust storm period, Atmospheric Environment, 35, p2707-2714.
- Ma, C.J., Kasahara, M., Tohno, S., Hwang, K.C., (2001b), Characterization of the winter atmospheric aerosols in Kyoto and Seoul using PIXE, EAS and IC, Atmospheric Environment, 35, p747-752.
-
Ma, C.J., Kasahara, M., Tohno, S., (2008), Physicochemical properties of Asian dust sources, Asian Journal of Atmospheric Environment, 2(1), p26-33.
[https://doi.org/10.5572/ajae.2008.2.1.026]

- Ma, C.J., Tohno, S., Kasahara, M., Hayakawa, S., (2005), A case study of the size-resolved individual particles collected at ground-based site on west coast of Japan during Asian dust storm event, Atmospheric Environment, 39, p739-747.
- Mobile Yonhapnews, (2008), The article on Feb. 12, 2008, http://www.yonhapnews.co.kr/aboutus/4223030200.html.
-
Park, M.H., Kim, Y.P., Kang, C.H., Shim, S.G., (2004), Aerosol composition change between 1992 and 2002 at Gosan, Korea, Journal of Geophysical Research, 109(D19S13), p1-7.
[https://doi.org/10.1029/2003jd004110]

-
Smith, T.N., Phillips, C.R., Melo, O.T., (1976), Diffusive collection of aerosol particles on Nuclepore membrane filter, Environmental Science and Technology, 10, p274-277.
[https://doi.org/10.1021/es60114a004]

-
Song, C.H., Carmichael, G.R., (1999), The aging process of naturally emitted aerosol (sea-salt and mineral aerosol) during long range transport, Atmospheric Environment, 33, p2203-2218.
[https://doi.org/10.1016/s1352-2310(98)00301-x]

- Szykman, J., Mintz, D., Creilson, J., Wayland, M., (2003), Impact of April 2001 Asian dust event on particulate matter concentrations in the United States, National Air Quality and Emissions Trends Report, pS1-S12.
- The Mainichi Newspaper, (2005), The article on 18 Nov. 2005, http://www.mainichi.co.jp/.
-
Wang, X., Guanghua, Z., (1996), Some characteristics of the aerosol in Beijing, International Journal of PIXE, 6, p361-365.
[https://doi.org/10.1142/s0129083596000387]

-
Zhang, J., Wu, Y., Liu, C.L., Shen, Z.B., Yu, Z.G., Zhang, Y., (2001), Aerosol characters from the desert region of Northwest China and the Yellow Sea in spring and summer: observations at Minqin, Qingdao, and Qinliyan in 1995-1996, Atmospheric Environment, 35, p5007-5018.
[https://doi.org/10.1016/s1352-2310(01)00269-2]

