A Case Study of Ionic Components in the Size-resolved Ambient Particles Collected Near the Volcanic Crater of Sakurajima, Japan
Abstract
In this study, the ionic composition of volcanogenically derived particles and their temporal and spatial distributions have been investigated to evaluate the impact of the volcanic eruption on the local ecosystem and residents. To this end, an intensive field study was conducted to measure the size-segregated particulate matters at the east part of Sakurajima in Japan. Fractionated sampling of particles into >PM10, PM10-2.5, and PM2.5 was made by a multi nozzle cascade impactor (MCI). The concentration of various ions present in the size-resolved particles was determined by Ion chromatography. The time dependent 3-dimensional Volcanic Ash Forecast Transport And Dispersion (VAFTAD) model developed by the NOAA Air Resources Laboratory (ARL) indicated that the sampling site of this work was affected by the volcanic aerosol particles plume. The temporal distributions of sulfate and PM2.5 during the field campaign were significantly variable with important contributions to particle mass concentration. The chlorine loss, suspected to be caused by acidic components of volcanic gases, occurred predominantly in fine particles smaller than 10 μm.
Keywords:
Sakurajima, Volcano, Size-resolved particle, Ionic component, Chlorine loss1. INTRODUCTION
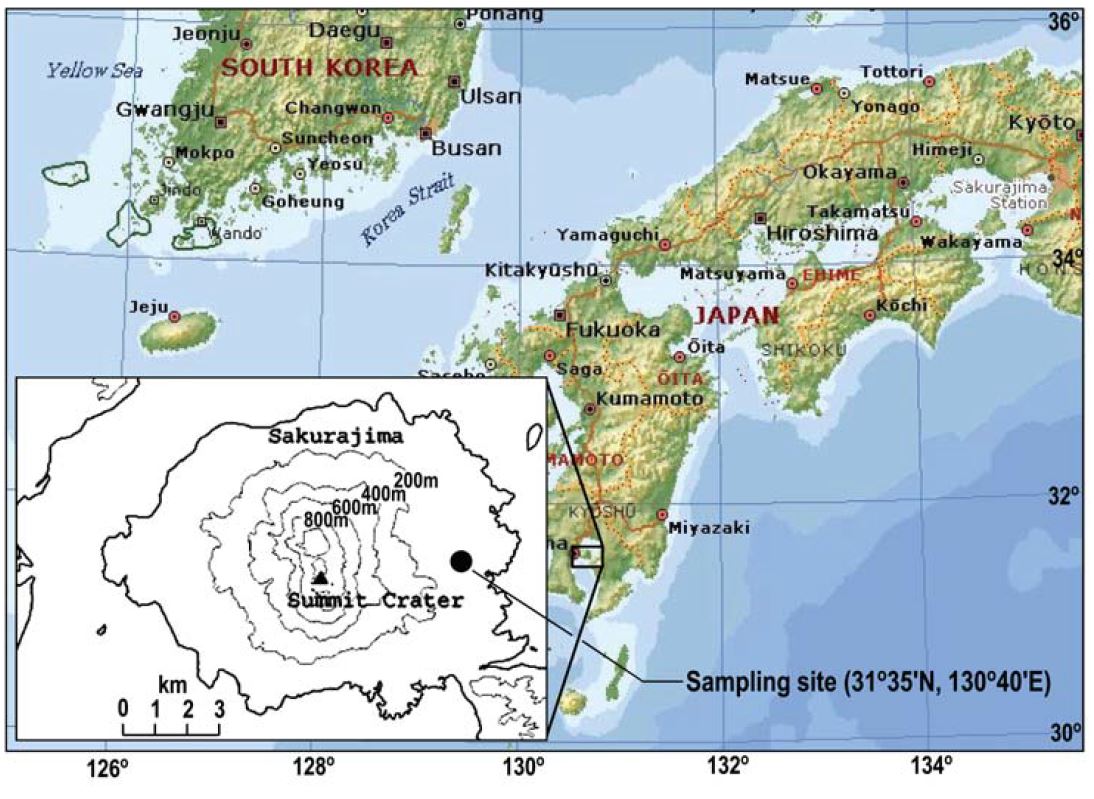
Sakurajima (31°35′N, 130°39′E) (Fig. 1) is a volcanic island located in the bosom of Kagosima bay of Kyusyu, Japan. Sakurajima is one of the most active volcanoes in Japan. It has erupted several times in recent history. The maximum eruption of volcanic aerosol particles emitted from Sakurajima volcano amount to 29×106 t in 1985. The most abundant gas typically released into the atmosphere from volcanism is water vapor, followed by carbon dioxide and sulfur dioxide (Iino and Terada, 2003; Luria et al., 1996). Volcanic eruption also releases small amounts of other trace components, including hydrogen, hydrogen sulfide, hydrogen chloride, carbon monoxide, hydrogen fluoride, and helium.
The effects of volcanogenic SO2 on residents and the environment vary widely depending on (a) the quantity of its emission from crater; (b) the range of its injection (e.g., into the troposphere or stratosphere); and (c) the regional or global meteorological conditions that control its disperse (Bates et al., 1987). These SO2 can be carried to the ground in the form of acid rain or snow after being converted into sulfuric acid (H2SO4). Acid rain has been implicated in contributing to forest degradation. There is good reason to believe that acid rain has induced long-term changes in the chemistry of some sensitive soils. The impact of acid rain on forest in Sakurajima was realized, as nearly all trees growing at the downwind section in the Mt. Sakurajima dried up.
About half of the acidity in the atmosphere falls back to earth through dry deposition as gases and dry particles. The particles containing sulfuric acid can also be settled down as dry deposition. Thus, it is informative to study the combined composition of gases and particles for volcanogenic pollution and their impact on local area. However, to date, few studies on particulate matter, especially the size-segregated particulate matters, have been carried out in this volcanic region (Kinoshita, 2000; Kinoshita and Togoshi, 2000). Hence, relatively little is known about the composition of size-resolved particles and their relationship to gaseous materials. As a primary goal of this study, we report the chemical properties of the size-resolved particles collected nearby the volcanic crater of Sakurajima, Japan.
2. EXPERIMENTAL AND METHODS
2. 1 Sampling of Size-resolved Particles
For the sampling of ambient particles, a three-stage multi nozzle cascade impactor (MCI®) (Tokyo Dylec Co.) was operated at a height of about 80 m above sea level of Kurokami observatory (31°35′N, 130°40′E) (Volcanic activity research center of Kyoto University) at the east part of Mt. Sakurajima in Kagoshima. This size-resolved particle collection system operated at a flow rate of 20 L min-1 for 24-h interval from 18-29 November, 2005.
As one of the multi-stage particle sampling instruments, this MCI combined with the 1st and 2nd stages having 12-orifice and back-up stage was employed to measure the size distribution and mass concentration levels of liquid and solid particulate matter. Particles were sampled directly on substrate material arranged behind the jet-nozzles of a cascade impactor. For the collection of particle samples, the airflow was maintained at approximately 20 L min-1. Three-stage filters were used for the collection of 3 particle-size fractions: (1) the first stage: giant (>PM10) (a 47 mm diameter, non hole Nuclepore® polycarbonate filter), (2) the second stage: coarse (PM10-2.5) (a 47 mm diameter, non hole Nuclepore® polycarbonate filter), and (3) back-up stage: fine (PM2.5) fraction (a 47 mm diameter, quartz fiber filter). During the sampling period, the temperature was around 6.4-18.7°C (average 12.9°C) with relative humidity around 34-91%(average 63.1%). During sampling period the range of wind speed was 0.1-7.8 m s-1 and it was generally blowing from the west and southwest.
2. 2 Analytical Equipments and Methodology
After sampling, all filters were placed in clean polyethylene petridishes and wrapped up with aluminum foil for refrigeration until analysis. Blank filters were handled in the same manner as the samples. For the laboratory analysis, these filters were extracted with deionized water by ultrasonic treatment. Ion Chromatography (IC) (Dionex DX-100) was used to determine the concentrations of various ions present in the size-resolved particles. Samples were analyzed for both cations (sodium, ammonium, potassium, magnesium and calcium) and anions (fluoride, chloride, nitrate, phosphate and sulfate).
2. 3 Data Validation
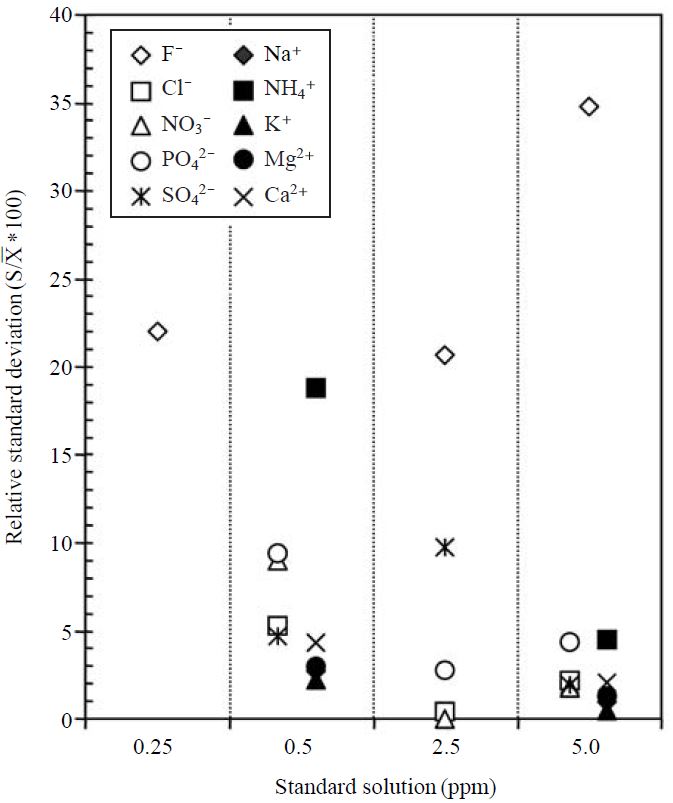
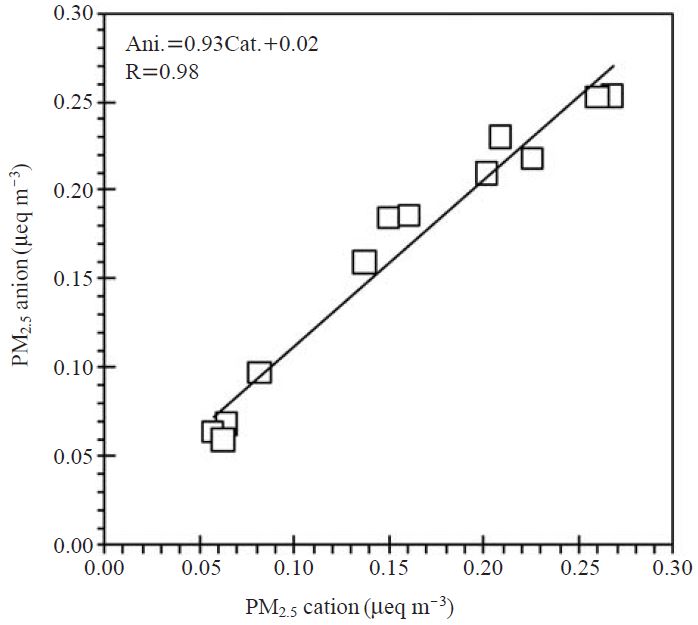
To assure the reliability of our measurement technique, the quality assurance and quality control(QA/QC) was conducted by analyzing a set of known standard species. The data obtained by IC analysis were tested for precision by checking the relative standard deviation (% RSD) of each concentration of standard solution. In probability theory and statistics, the % RSD refers to the absolute value of the coefficient of variation expressed as a percentage. In Fig. 2, most ionic components generally maintained low % RSD level. This result indicates that the absolute values of standard solutions did not vary significantly from each other. However, relatively high % RSD values were seen in the cases of fluoride (from 20 to 35%) and 0.5 ppm ammonium (18.5%) standards. The regression plot used for anion and cation balance, shown in Fig. 3, clearly shows that these ionic measurements are highly correlated, with the regression coefficient of 0.98. Although the analytical processes of IC employed in this study cannot determine the concentration of several minor anions (e.g. carbonate, bicarbonate, and water soluble organics like acetate, formate, etc.) the sums of equivalent concentration of anions for several samples are a little bit higher than those of cations. It is therefore suggested that these minor anions including their precursors were not significantly released from volcanic systems, and then they did not act on ion balance.
3. RESULTS AND DISCUSSION
To examine the transport and dispersion of the volcanic aerosol particles in the atmosphere, we ran the time dependent 3-dimensional Volcanic Ash Forecast Transport And Dispersion (VAFTAD) model developed by the National Oceanic Atmospheric Administration (NOAA) Air Resources Laboratory (ARL) developed. The VAFTAD calculates transport and dispersion of volcanic aerosol particles from an ash column extending from the volcano summit to the column top. This model uses spherical particles of density 2.5×10⁶ g m-3 with diameter ranging from 0.3 to 30 μm(Heffter and Stunder, 1993). The input data for model calculation are eruption time, coordinates (start point), and height of source. The forecast meteorological fields for VAFTAL model are routinely generated from National Centers for Environmental Prediction (NCEP) daily runs of the Global Forecast System (GFS) model and the North American Mesoscale (NAM) model. The model computation of the visual ash cloud includes the magnitude of the volcanic eruption as determined by an algorithm based on the ash column top height and column depth. A detailed model description of the VAFTAD was given by Heffter and Stunder (1993).
In this study the VAFTAL model was run four episodical days (24 Nov., 26 Nov., 27 Nov., and 28 Nov.) when showed relatively high PM2.5 during whole measurement period. Fig. 4 shows an example 8-panel chart of the forecast visual ash cloud beginning at 0900 local time on 24 Nov. 2005. As displayed in Fig. 4, the time dependent (6 h after eruption (top) and 12 h after eruption (bottom)) volcanic aerosol particles cloud dispersion is shown. The VAFTAD simulation result (FL SURFACE-550) indicates that the volcanic aerosol particles plume bounded for the east part of Sakurajima for a while after eruption and then it moved toward to the Pacific Ocean. The visually described transport and dispersion of the volcanic aerosols also gives nearly the same results for other simulated model output. Thus, the present sampling site appeared to be affected by the volcanic aerosol particles plume.
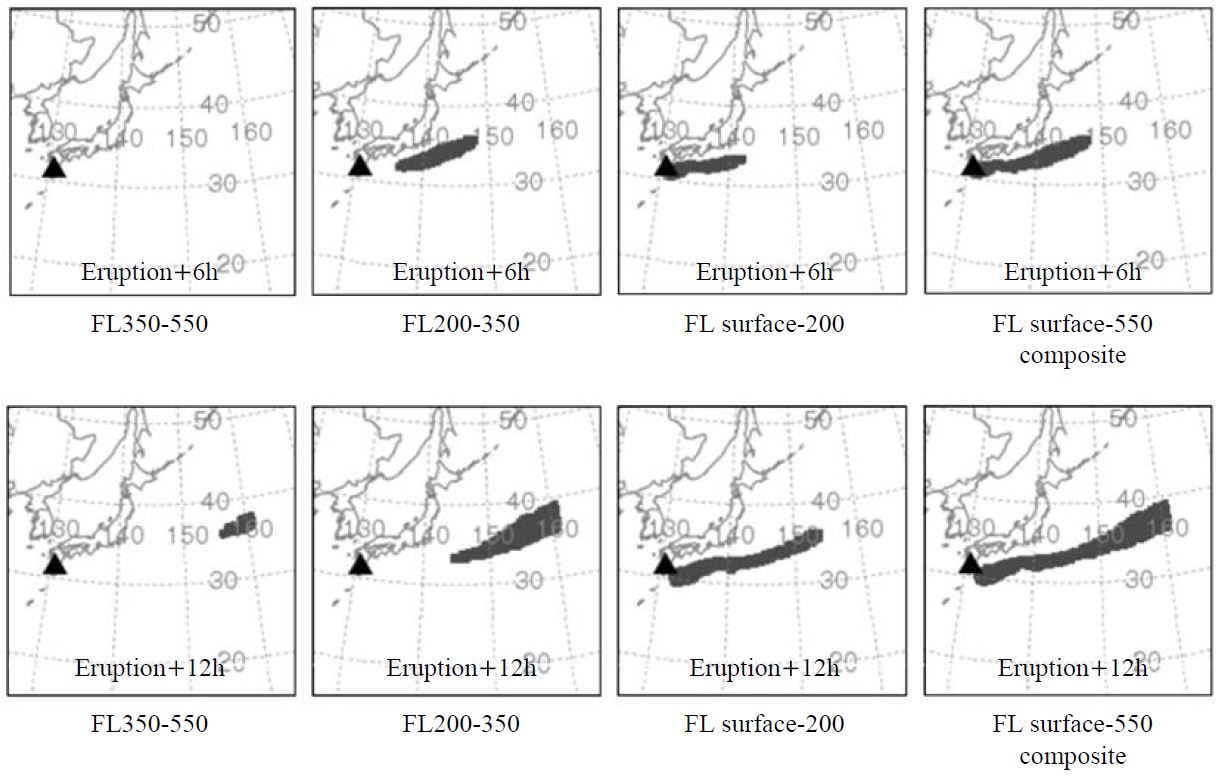
VAFTAL model output of the forecast volcanic visual ash cloud erupted on Nov. 24, 2005. FL range means the upper and lower flight level. The right column panels are the composite layer, from the surface to FL550.
Fig. 5 presents the temporal variations of sulfate and PM2.5 and their ratio (sulfate to PM2.5: indicated as bars) measured at Sakurajima during an intensive field measurement. The range of PM2.5 concentration was between 8.9 and 46.1 μg m-3 with an average of 22.1 μg m-3. On the other hand, sulfate concentration varied from 2.3 to 10.9 μg m-3 with an average of 6.94 μg m-3. Both sulfate and PM2.5 monitored during an intensive campaign showed a strong temporal variation. The time resolution of PM2.5 data collection allowed us to identify episodes and to determine the eruption trends. The time series fluctuation of sulfate was moderately comparable to that of PM2.5. The ratios of sulfate to PM2.5 ranged between 19.8% and 56.3% with an average of 33.43%. Therefore, PM2.5 mass concentration appears to be affected by the formation of sulfate thorough an eruption of the Sakurajima volcano. The ratio of sulfate to PM2.5 found in this study is comparable to those of other background and urban areas. Moon et al. (2005) measured the chemical species in fine particulate matter at Gosan, Korea, one of the most representative background sites in the East Asia. The authors reported that the concentrations of PM2.5 and sulfate were 21.3 and 3.39 μg m-3, respectively to yield the SO4/PM2.5 ratio of 15.9%. Likewise the fine particles collected recently at an urban site in Korea showed average value of 38.9 μg m-3 (PM2.5) and 7.63 μg m-3 (sulfate) and their ratio of 19.6%. (Park and Lim, 2006). The ratio of sulfate to PM2.5 obtained in the volcanic site is thus higher than those of remote and urban sites.
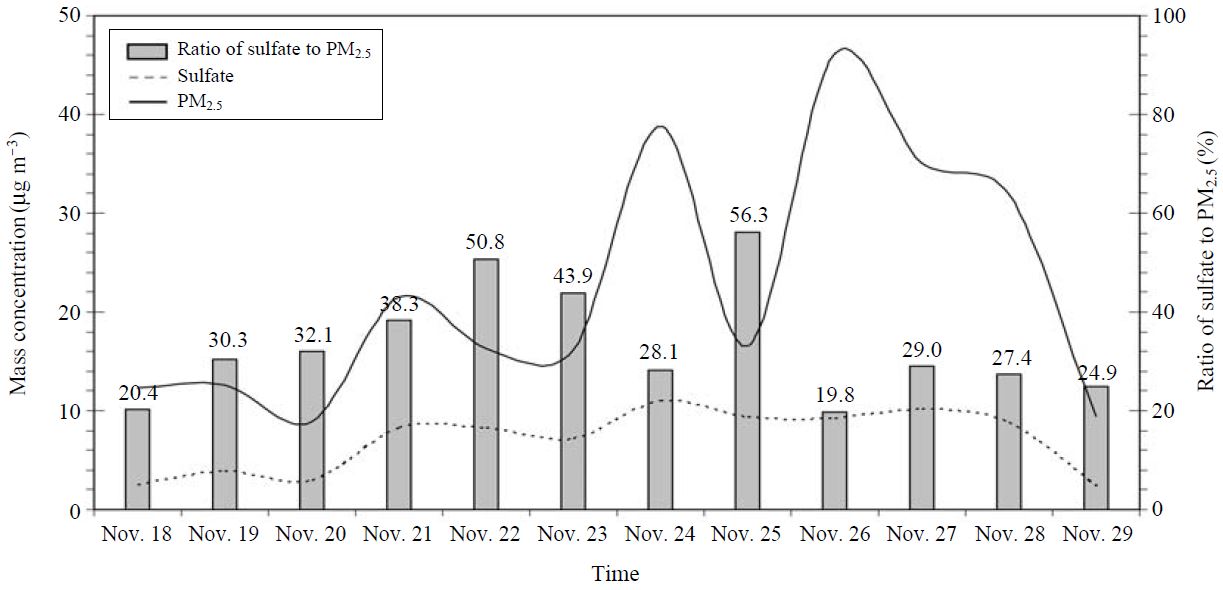
Time series variation of the ratio of sulfate to PM2.5 and concentrations of sulfate and PM2.5 measured at Sakurajima.
Most fine sulfates occur due to the oxidation of sulfur dioxide gas. In humid atmospheres, oxidation typically occurs in clouds where sulfuric acid is formed within water droplets. If there is inadequate ammonia in the atmosphere to fully neutralize the sulfuric acid, then the resulting aerosols become acidic.
As mentioned earlier, although a small amount of hydrogen fluoride is released into the atmosphere from volcano, quantification of fluoride concentration in particulate matter should be meaningful to thoroughly examine volcanic activity. An intake of excess fluorine can act as a significant cause of death and injury in livestock during ash eruptions (Sutton and Elias, 1993). It also promotes acid rain effects downwind of volcanoes like HCl (Symonds et al., 1994). As the ocean water generally contains a very small amount of sulfur (0.27 wt%) and fluoride (1.3×10⁻⁴ wt%), non-seasalt (nss) components were estimated in here. Fig. 6 shows the concentrations of nss-fluoride and nss-sulfate as a function of particle size. Their concentrations were also compared with the reference sites. As shown in Fig. 6, the concentrations of nss-F-and nss-SO42- exhibit not only strong particle size dependence but also dissimilar variation among three-step particle size to each other. The content of nss-F-was dominantly in PM10-2.5, while that of nss-SO42- in PM2.5. Although nss-F-had negligible concentration relative to nss-SO42-, the occurrence of high nss-F-level in PM10-2.5 may be ascribable to a pale yellow gas attached to fine ash particles during eruption. Fluorine also combines with metals to make fluorides (e.g., sodium fluoride and calcium fluoride). nss-F- in PM2.5 in the present study can be compared with those of rural and industrial areas in Ohio, U.S (Bates et al., 1987). The median level of nss-F- in PM2.5 collected at Athens, a rural area located approximately 105 km southeast of Columbus, Ohio, was 0.007μg m-3. On the other hand, that of Koebel located in the industrial center of the city consisting of foundries, plastic facilities, gravel/quarrying operations, and other manufacturing industries was 0.051 μg m-3 (http://www.epa.state.oh.us/dapc/atu/Section2Chapter2.pdf). In fine fraction particles smaller than 2.5 μm, nss-F-concentration measured in the present work is relatively higher than that of rural site ((a) in Fig. 6). In contrast, in comparison to urban site ((b) in Fig. 6), it is very low. Human activities releasing fluorides into the environment are mainly the combustion of coal (containing fluoride impurities) and other manufacturing processes (steel, copper, nickel, glass, brick, ceramic, glues and adhesives). Especially, aluminum smelters are sources of fluorides in various particle sizes (cryolite, aluminum fluoride, calcium fluoride, chiolite). In the case of nss-SO42- in PM2.5, the level of present study (7.64μg m-3) is overwhelmingly higher than those of rural ((c) in Fig. 6) and industrial ((d) in Fig. 6) areas in Ohio, U.S.

Concentrations of nss-fluoride and nss-sulfate in size-resolved particulate matter colleced at Sakurajima.
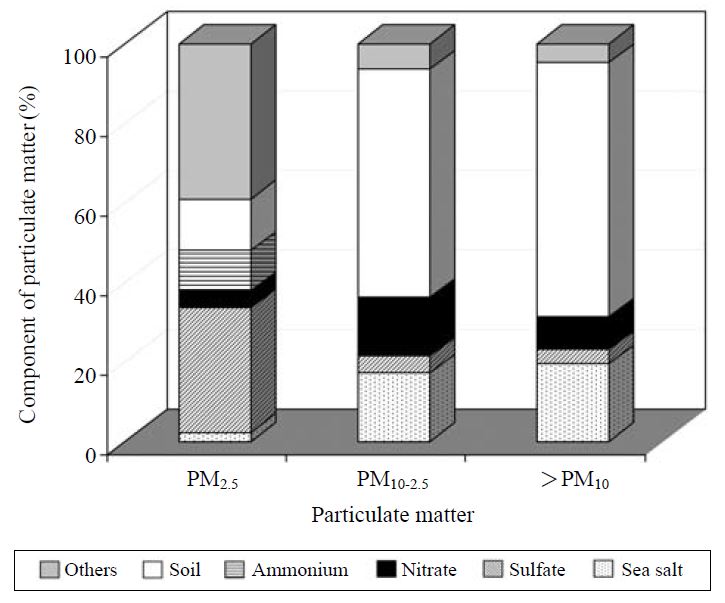
The relative contributions of the five components to the size-segregated particles were examined. In Fig. 7, the percentages of their mass loading in each size range are exhibited. The amount of sea salts was derived from Na+ concentration in aerosol and the Na+ to total salt ratio of 0.306 in sea water (sea salt=3.27×Na+). Although in order to estimate the amount of soil fraction in aerosols, aluminum was generally selected as a tracer material of soil, the soil fraction in the present study was calculated by calcium concentration in ambient particles and the ratio of calcium to aluminum of reference (Gregory et al., 1982). As explained already in the result of Fig. 5, the ratio of SO42- to PM2.5 estimated in the present study is higher than those of rural and urban sites. This high ratio of SO42- to PM2.5 might be caused by sulfate originated from the phase shift of SO2 in volcanic gases. It is also possible to infer that a high contribution SO42- to PM2.5 can reflect the positive artifact of quartz fiber filters which can effectively absorb SO2. As might be expected, sea salt and soil fractions mainly contribute to the mass loading of coarse particles larger than 2.5 μm.
Among the acidic compounds detected in volcanic gases, SO2 and NOx can participate in the chlorine loss to make the content of particle Cl- in the atmosphere less than that of the sea salt. The chlorine loss may be caused either by the reaction of gaseous HNO3 with NaCl in sea salt particles or by the reaction between H2SO4 and NaCl in sea salt. Fig. 8 illustrates the measured versus theoretically estimated chlorides in size-classified particulate matters. The estimated Cl- mass concentration was theoretically calculated by [Na+ mass concentration×1.8]. As shown in Fig. 8, all regression lines are far from the one-to-one line, suggests that the estimated Cl- concentrations are higher than the measured ones. This result indicates that chlorine loss occurred actively. The ranges of chlorine loss (%) in size-resolved particles were also calculated. It ranged from 20.0-78.8% with an average 54.1% in PM2.5, whereas relatively high chlorine loss (28.6-85.5% with average 61%) was found in PM10-2.5. The chlorine losses in PM2.5 and PM10-2.5 collected at Jeju Island, Korea were calculated as 32.4% and 39.6%, respectively (Moon et al., 2005). As a consequence, the amount of chlorine loss calculated in the present study was relatively higher than that of remote site without volcanic activity.
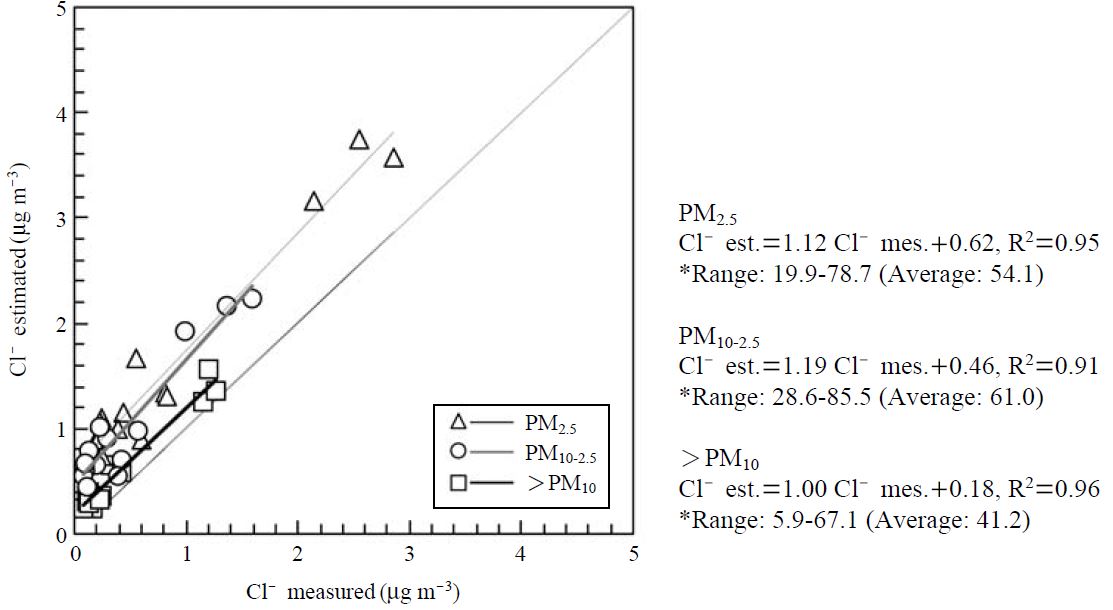
Plotting of the measured vs. theoretical chlorides to estimate the chlorine loss.*[Cl-]loss(%)=([Cl-]est.-[Cl-]mea.)/[Cl-]est.×100.
Coarse particle fraction of sulfate in the atmosphere mainly exists in the form of Na2SO4, MgSO4, and CaSO4. Na2SO4 in coarse particles may be formed by the absorption of gaseous SO2 in sea salt droplets due to its oxidation to H2SO4 and release of gaseous HCl from the sea salt;
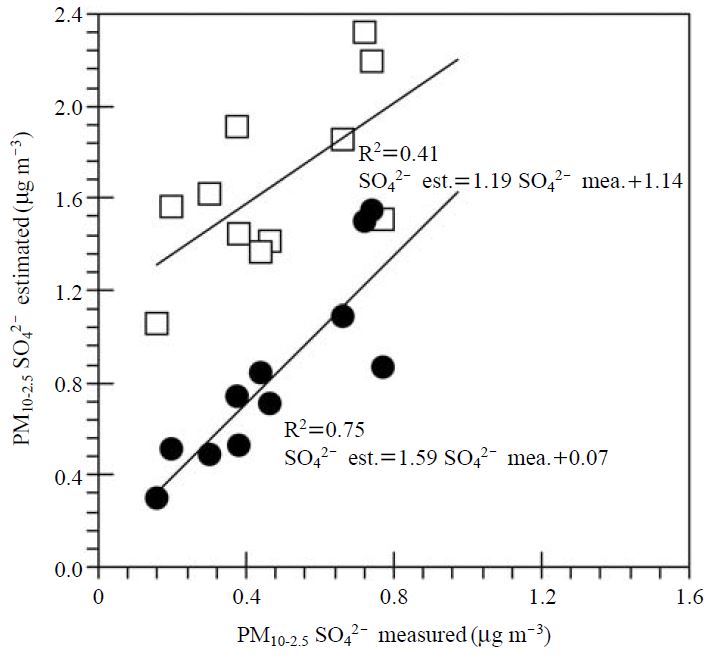
A thorough investigation of sulfate in coarse particles will be critical to understanding not only the existing types of sulfate but also the chlorine loss by sulfuric acid. Hence, the theoretically predicted concentrations of sulfate in PM10-2.5, which showed the highest amount of chlorine loss in Fig. 8, were compared with the actually measured sulfate concentrations. Fig. 9 presents a scatter plot of PM10-2.5 sulfate between the measured and theoretically calculated values. The latter was calculated by [concentration of counter ion×MW of sulfate/MW of counter ion]. Here, the counter ions are Na+, Mg2+, and Ca2+. MW denotes molecular weight (in case of Na+, MW was multiplied by two). As shown in Fig. 9, the theoretically calculated sulfate concentrations from Na2SO4, MgSO4, and CaSO4 were significantly overestimated. Moreover, their determination coefficient (0.41) was too low. On the contrary, the theoretically estimated sulfate concentrations from MgSO4 and CaSO4 had a relatively close relevance to the measured sulfate concentrations with a relatively good R square level (0.75). It can, therefore, reasonably be said that most sulfate in PM10-2.5 are explained by MgSO4 and CaSO4. In other words, the Na2SO4 formed by the reaction between H2SO4 and NaCl in sea salt can be disregarded. If it is the case, the chlorine loss in PM10-2.5 may be caused mainly by HNO3 instead by H2SO4.
4. CONCLUSIONS
In this study, an intensive field measurement was conducted to elucidate the characteristics of size-classified ambient particles near the Sakurajima volcano in Japan. The time resolution data of sulfate and PM2.5 concentrations with strong time serial variations allowed us to identify episodes and to determine the eruption trends during the intensive campaign. Sulfate concentration, which accounted for 31% of PM2.5, seems to reflect oxidation of volcanically derived sulfur dioxide gas to sulfate particles. A comparison of the measured and theoretically estimated chlorides in size-segregated particulate matters suggested that the acidic compounds detected in volcanic gases can be actively engaged in chlorine loss. This chlorine loss, especially in PM10-2.5 fraction, is suspected to be caused by HNO3. Although a limited data were discussed, the data from our intensive field measurement helped us improve understanding of several important phenomena regarding the size-resolved particulate matters in volcanic region. However, to cope with the disaster of a volcanic eruption, it will be necessary to continue the monitoring of not only particulate matters but also gaseous materials.
Acknowledgments
We express our sincere thanks to all the members of the volcanic activity research center of Kyoto University, the members of Air Quality Lab. of GIST (Gwangju Institute of Science and Technology), and 2007 alumna of the Lab. of environmental inorganic chemistry in Dept. of Environmental Science, Fukuoka Women’s University for their experimental support. The authors gratefully acknowledge the NOAA Air Resources Laboratory (ARL) for the provision of the VAFTAD model used in the present study. The model result of VAFTAD was very helpful to data interpretation.
References
-
Bates, T.S., Cline, J.D., Gammon, R.H., Kelly-Hansen, S.R., (1987), Regional and seasonal variations in the flux of oceanic dimethyl sulfide to the atmosphere, Journal of Geophysical Research, 92, p2930-2938.
[https://doi.org/10.1029/jc092ic03p02930]

- Gregory, S.K., Glen, E.G., Scott, W.R., (1982), Identification of atmospheric particulate sources in Washington, DC using chemical element balances, Environmental Science Technology, 16(2), p79-90.
-
Heffter, J.L., Stunder, B.J.B., (1993), Volcanic ash forecast transport and dispersion (VAFTAD) model, Weather Forecasting, 8, p534-541.
[https://doi.org/10.1175/1520-0434(1993)008<0533:vaftad>2.0.co;2]

- Iino, N., Terada, A., (2003), Analysis of high volcanic gas concentrations at the foot of Miyakejima volcano, Japan, Journal of National Disaster Science, 25, p85-91.
- Kinoshita, K., (2000), Volcanic smoke/gases and atmospheric environment, Applied Meteorological and Climate Resources, 13, p61-65, (in Japanese).
-
Kinoshita, K., Togoshi, H., (2000), Rise and flow of volcanic clouds observed from the ground and from satellites, Journal of Visualization, 3, p71.
[https://doi.org/10.1007/bf03182442]

- Luria, M., Peleg, M., Sharf, G., Tov-Alper, D.S., Spitz, N., BenAmi, Y., Gawii, Z., Lifschits, B., Yitzchake, A., Seter, I., (1996), Atmospheric sulfur over east Mediterranean region, Journal of Geophysical Research, 101, p25917-25930.
- Moon, K.J., Han, J.S., Kong, J.B., Lee, M.D., Jung, I.R., (2005), Characteristics of chemical species in gaseous and aerosol phase measured at Gosan, Korea during ABS-EAREX2005, Journal of Korean Society for Atmospheric Environment, 21(6), p675-687, (in Korean).
- Ohio Environmental Protection Agency, (2003), Characterization of PM2.5 in central and southeast Ohio, http://www.epa.state.oh.us/dapc/atu/Section2Chapter2.pdf.
- Park, J.Y., Lim, H.J., (2006), Characteristics of water soluble ions in fine particle during the winter and spring in Daegu, Journal of Korean Society for Atmospheric Environment, 22(5), p627-641, (in Korean).
- Sutton, A.J., Elias, T., (1993), Volcanic gases create air pollution on the Island of Hawaii: U.S., Geological Survey Earthquakes and Volcanoes, 24(4), p178-196.
- Symonds, R.B., Rose, W.I., Bluth, G., Gerlach, T.M., (1994), Volcanic gas studies: methods, results, and applications, Mineralogical Society of America Reviews in Mineralogy, 30, p1-66.
