Rapid Changes in CO Concentration Levels at Seven Roadside Locations in Seoul before and after 2000
Abstract
Concentrations of carbon monoxide (CO) in air were analyzed from seven urban roadside (U-RS) stations in Seoul, Korea over an 11-year period (1998-2008). As noticeable changes in CO levels coincided with the Natural Gas Vehicle Supply (NGVS) program in the year 2000, its concentration data were examined between 1998-2000 (period I) and 2001-2008 (period II). The mean values of CO from all 7 stations for the whole study period were recorded as 1.19±0.22 ppm with large drops in its mean from 1.83±0.43 ppm in period I to 0.94±0.21 ppm in period II. As such, CO levels between the two periods undertook the mean reduction rate of 46.9±16.2% (range of 18.3 to 59.9%). According to the analysis of long-term trends of CO, its concentrations in the U-RS stations decreased very rapidly with the annual mean reduction rate of 9.5% yr-1. A line of evidence collected in this study suggests that the implementation of the NGVS program has been quite effective to induce the alterations in CO levels in all urban roadside locations throughout the city of Seoul.
Keywords:
Carbon monoxide, Methane, Long-term, Natural gas vehicle, Urban roadside1. INTRODUCTION
The demand of gasoline and diesel fuels is closely tied to growth in the number of motor vehicles on the road and the extension of their traveling distances (Singh et al., 2008; Chan et al., 2002). Enormous studies focusing on the air quality change in urban roadside (U-RS) locations were thus able to collect hard pieces of evidence that the emissions of airborne pollutants are reflected by such changes in the road transport sector (Cofala et al., 2007; Gokhale and Pandian, 2007; Yli-Tuomi et al., 2005; Zhao et al., 2004).
Knowing that the vehicular activity is the predominant source of air pollution in most urban areas, the use of clean fuel has been recommended as one of the promising options to reduce the pollutant emissions and to clean the air (Boddy et al., 2005). In fact, it is demonstrated that vehicles fueled with natural gas can dramatically reduce emissions of major pollutants like carbon monoxide, carbon dioxide, and reactive hydrocarbons leading to the production of ozone. The consumption of natural gas for vehicles has been widespread and welcomed both in the United States and Europe since the 1960s. In fact, there are currently more than 30,000 natural gas vehicles on U.S. roads and over 700,000 worldwide.
For the purpose of improving the urban air quality, Korean government launched natural gas vehicle supply (NGVS) program from 2000 through which a total of 20,000 diesel fuel buses are ultimately replaced with the natural gas bus by 2007 (Kang, 2004). These replacement processes actively proceeded in the major urban areas of Korea including Seoul prior to 2002 World Cup Games and were extended further to small-scaled urban locations from 2003. This active clean-up activity, as it is based on the replacement of fuel as well as engine system, seemed to induce large changes in urban air quality, especially with respect to carbon monoxide. Our preliminary study conducted to examine CO and CH4 levels from one urban roadside and one urban background locations in Seoul clearly demonstrated that the changes induced by such program have greatly contributed to the reduction of CO after 2000 (Nguyen et al., 2010).
In this study, we attempted to examine the rate of CO level changes that took place in seven U-RS locations in Seoul both before and after the implementation of NGVS program. The selected 7 stations which include Dong Dae Moon, Shin Chon, and others (Table 1) represent all the stations which allowed the comparison of the CO data both before and after 2000 (i.e., from 1998). The CO concentration data measured from these stations were analyzed to assess the rate of CO level changes throughout the study period. Through the application of diverse statistical analyses, we attempted to elucidate the temporal pattern of CO data throughout most urban roadside locations in Seoul. On the basis of this study, the long-term variation trends of CO are also discussed to understand its behavior with rapidly changing environmental conditions. This study aims to extend the spatial coverage of our preliminary work on CO distribution which specifically focused on one of the urban roadside stations in relaion to a reference urban background station in Seoul (Nguyen et al., 2010).
2. MATERIALS AND METHODS
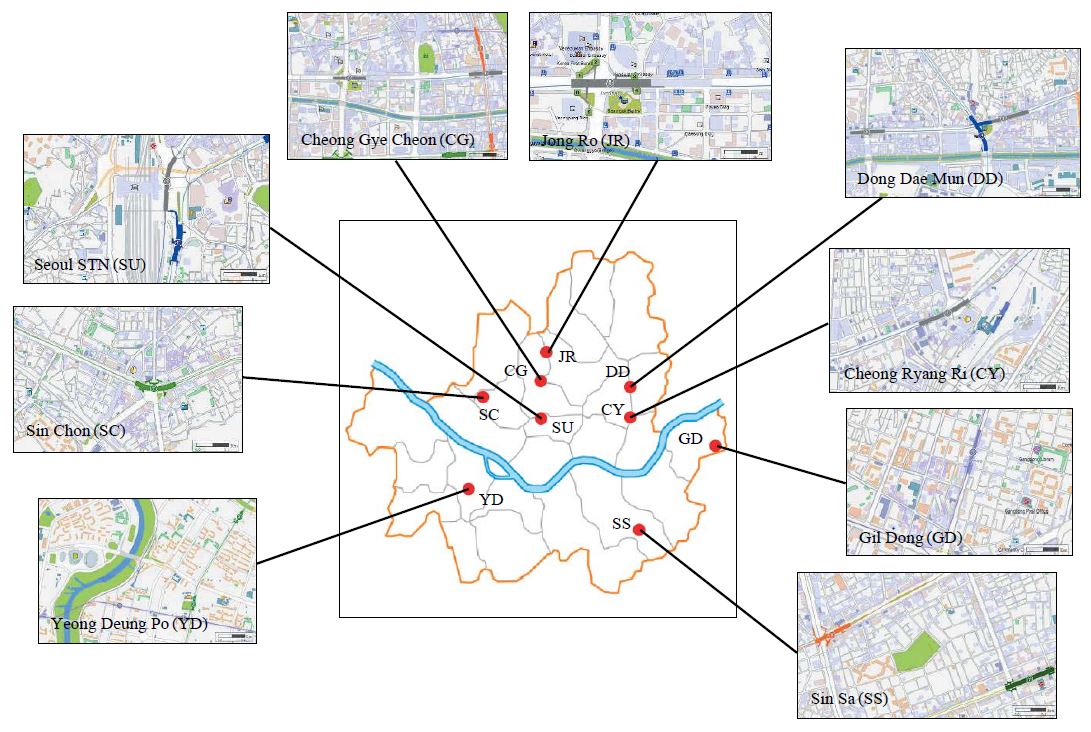
To investigate the changes in the airborne pollutant levels between before and after the NGVS program, the CO concentration data collected from 7 out of all 9 urban roadside stations in Seoul were analyzed (Table 1). Note that the two sites of JR and GD were excluded from such comparison, as they were added to the monitoring network since April 2008 (Fig. 1). Most of these study sites are exposed to the direct influence of traffic activities so that the behavior of CO can be assessed in response to such source processes (Pandey et al., 2008). For instance, the SC site is located on the ground (sampling height of 3.8 m) 1m from an 8-lane road (30 m width). Although all the CO data were initially recorded routinely at hourly intervals, they were stored at monthly intervals in the data management network system operated by the Korea Ministry of Environment (KMOE, 2008). The analysis of the CO data in this study was hence made using its monthly mean values throughout the study period.
The initial acquisition of CO data was made with a CO analyzer unit (response time (RT)=60 sec), which belongs to on-line air quality measurement equipment (Maxsam-series, Kimoto, Japan). According to the manufacturer’s specifications, the minimum detectable sensitivity of CO corresponds to 0.05 ppm with a precision of 0.5 to 2%. Because of the noticeable change in air quality after the implementation of NGVS policy in 2000, detailed evaluation of data was made after grouping them into two periods: I (January 1998-December 2000) and II (January 2001-December 2006).
3. RESULTS AND DISCUSSION
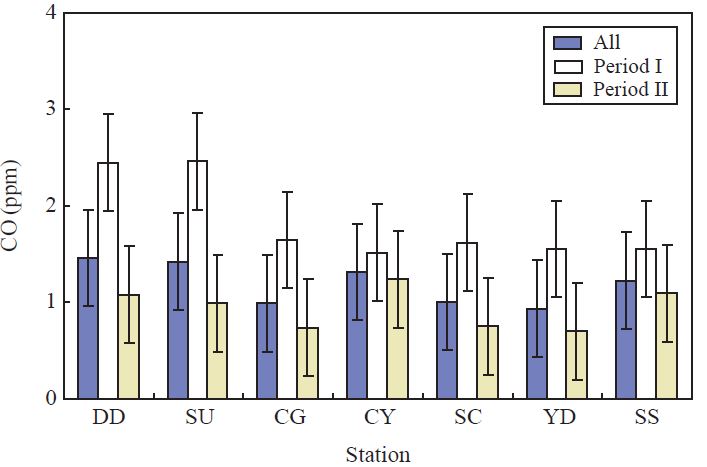
In Table 2, a statistical summary of the CO data is given for each station on an annual basis. Because of large differences in the pollutant distribution patterns after 2000, comparison of the data is also made between period I and II. As a result, the general trends of the CO data were also compared by three temporal criteria of month, year, and period. To simplify the comparison of CO level changes between the two periods, the mean CO levels for each period are also compared in Fig. 2. The results of CO data measured throughout the entire period generally fell in the range of 0.94 (YD) to 1.46 ppm (DD). However, when the results are compared between the two periods of I and II, dramatic shifts in CO levels are recognized from all 7 seven stations without a single exception. During period I, the mean CO concentrations generally varied in the range of 1.52 (CY) to 2.46 ppm (SU). However, during period II, its counterpart values changed from 0.69 (YD) to 1.24 ppm (CY).

Comparison of the mean CO concentrations (ppm) between different periods: 1998-2000 (period I) and 2001-2008 (period II).
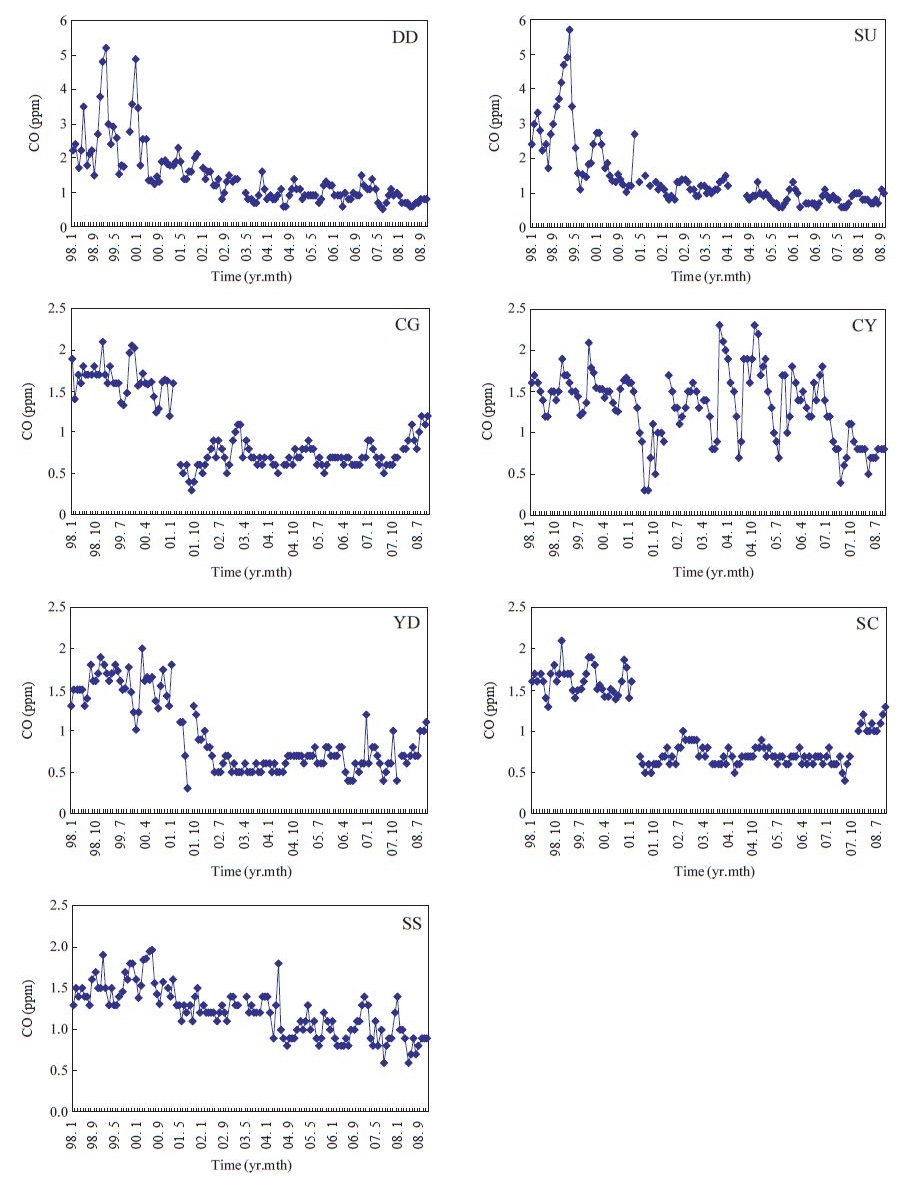
A simple comparison of the mean CO data between the two periods showed large shifts in CO levels. According to the results shown in Fig. 3, the concentrations of CO measured at all 7 U-RS sites exhibited a large reduction in its concentration level in a fairly systematic manner. It is interesting to note that changes from a number of stations like DD, SU, and SS appeared to proceed fairly gradually throughout the study period. In contrast, some others like CG, YD, and SC exhibited the rapid shifts between the two periods. These diverse patterns of reduction, although cannot be specifically pointed out, are suspected to be related to the differences in their CO exposure pattern. One may assume that NGVS effect should be reflected more directly and effectively in certain monitoring sites due to differences in the operation pattern of NGVS or distance from the road. It is also noted that unlike all other stations, the results seen from CY is rather unique, as the CO data tend to vary with large amplitudes. Nonetheless, the results derived from this comparison are highly consistent in that CO concentration levels have been reduced considerably after the initiation of the NGVS program in 2000. For the reader’s reference, the temporal trends of CO have been described in detail in our recent publications dealing with one of these monitoring sites (SC) using the hourly measurement data (Nguyen et al., 2010).

Plot of CO concentration (ppm) changes in seven U-RS sites in Seoul, Korea throughout the entire study period (’98-’08).
To quantitatively assess the extent of CO level drop throughout the study period, the rate of its reduction has been assessed by linear regression analysis. In Table 3, the results of linear regression analyses are compared between different stations using the data sets grouped into: (a) all period, (b) period I, and (c) period II. According to this analysis, the mean reduction rate of CO for all 7 sites is computed to be -9.5% yr-1 with a range of -3.36 to -14% yr-1 during the 10 year period between 1998 and 2008. If the results for the two periods of I and II are compared between different stations, the patterns are greatly differentiated. Although the stations like DD and SU show large reduction rates (e.g., values far larger than -10% yr-1) from either period I or II, all other sites show fairly small reductions or slight gain within the boundary of each period, i.e., either during I or II. This comparison thus implies that the changes over a 10 year period took place in a more abrupt manner than in a gradual manner.
To evaluate the long-term trends of CO observed between different studies, the results of CO measurements made by other researchers need to be examined with similar criteria. The pattern seen from the present work can be first compared with those measured from other urban areas in Korea such as Daegu metropolitan city in which NGVS program was also initiated in the similar time frame. Based on measurements made from 1997-2002, Jo and Park (2005) reported that the reduction rates of CO at the U-RS sites in Daegu also ranged from 9.4 (Manchon) to 17.1% yr-1 (Namsan), while the rate for the U-BG was 2.7% yr-1 at Samdeok. In our future study, we will attempt to extend both spatial and temporal coverage of this study to a nationwide scale to elucidate the factors underlying this notable CO level changes across Korean peninsula.
4. CONCLUSIONS
In this study, the concentration data of CO measured from seven urban roadside (U-RS) sites in Seoul, Korea over an 11-year period were examined with respect to a noticeable shift after 2000 and its causes. A line of evidence collected in this study supports the idea that such change in CO levels occurred ubiquitously throughout all roadside stations around Seoul and that is closely coinciding with the initiation of NGVS program in 2000. Evaluation of CO distribution data at all sites confirmed that their concentrations tend to decrease with the mean reduction rate of 9.5% yr-1 from all seven sites for the 11 year period. In many sites, the significant reduction in CO levels is recognizable during such transition period, and the pattern during period II generally resumed temporal stability to a certain extent. Considering the fact that there strong reductions in CO levels were basically accompanied after NGVS, the effect of fuel type changes (e.g., from diesel fuel to natural gas) appears to be one of the highly effective strategies to reduce air pollution. Although we cannot examine the effect of such changes from other relevant species like CO2 or VOC, it is most likely that the NGVS program may have exerted great influences on their concentration levels as well. As a result, it is highly recommendable to develop strategies to implement these policies in an more effective manner.
Acknowledgments
This work was supported by the National Research Foundation of Korea (NRF) grant funded by the Ministry of Education, Science and Technology (MEST) (No. 2009-0093848).
References
-
Boddy, J.W.D., Smalley, R.J., Goodman, P.S., Tate, J.E., Bell, M.C., Tomlin, A.S., (2005), The spatial variability in concentrations of a traffic-related pollutant in two street canyons in York, UK-Part II: The influence of traffic characteristics, Atmospheric Environment, 39, p3163-3176.
[https://doi.org/10.1016/j.atmosenv.2005.01.044]

-
Chan, L.Y., Lau, W.L., Zou, S.C., Cao, Z.X., Lai, S.C., (2002), Exposure level of carbon monoxide and respirable suspended particulate in public transportation modes while commuting in urban area of Guangzhou, China, Atmospheric Environment, 36, p5831-5840.
[https://doi.org/10.1016/s1352-2310(02)00687-8]

-
Cofala, J., Amann, M., Klimont, Z., Kupiainen, K., Höglund-Isaksson, L., (2007), Scenarios of global anthropogenic emissions of air pollutants and methane until 2030, Atmospheric Environment, 41, p8486-8499.
[https://doi.org/10.1016/j.atmosenv.2007.07.010]

-
Gokhale, S., Pandian, S., (2007), A semi-empirical box modeling approach for predicting the carbon monoxide concentrations at an urban traffic intersection, Atmospheric Environment, 41, p7940-7950.
[https://doi.org/10.1016/j.atmosenv.2007.06.065]

-
Jo, W.-K., Park, J.-H., (2005), Characteristics of roadside air pollution in Koran metropolitan city (Daegu) over last 5 to 6 years: Temporal variations, standard exceedances, and dependence on meteorolotical conditions, Chemosphere, 59, p1557-1573.
[https://doi.org/10.1016/j.chemosphere.2004.12.021]

- Kang, K.K., (2004), Environmental policies for fuel switching, Korea Environmental Policy Bulletin, 2(1), p1-19.
- KMOE(Korean Ministry of Environment), (2008), Environmental Statistics Yearbook 2008, p122.
- Nguyen, H.T., Kim, K.-H., Ma, C.-J., Cho, S.-J., (2010), Long-term study of CO and CH4 behavior at an urban roadside and urban background locations in Seoul, Korea, Environmental Research, 110, p396-409.
-
Pandey, S.K., Kim, K.-H., Chung, S.-Y., Cho, S.-J., Kim, M.-Y., Shon, Z.-H., (2008), Long-term study of NOx behavior at urban roadside and background locations in Seoul, Korea, Atmospheric Environment, 42, p607-622.
[https://doi.org/10.1016/j.atmosenv.2007.10.015]

-
Singh, A., Gangopadhyay, S., Nanda, P.K., Bhattacharya, S., Sharma, C., Bhan, C., (2008), Trends of greenhouse gas emissions from the road transport sector in India, Science of the Total Environment, 390, p124-131.
[https://doi.org/10.1016/j.scitotenv.2007.09.027]

-
Yli-Tuomi, T., Aarnio, P., Pirjola, L., Mäkelä, T., Hillamo, R., Jantunen, M., (2005), Emissions of fine particles, NOx, and CO from on-road vehicles in Finand, Atmospheric Environment, 39, p6696-6706.
[https://doi.org/10.1016/j.atmosenv.2005.07.049]

-
Zhao, L., Wang, X., He, Q., Wang, H., Sheng, G., Chanb, L.Y., Fua, J., Blakec, D.R., (2004), Exposure to hazardous volatile organic compounds, PM10 and CO while walking a long streets in urban Guangzhou, China, Atmospheric Environment, 38, p6177-6184.
[https://doi.org/10.1016/j.atmosenv.2004.07.025]


