Status of Ambient PM2.5 Pollution in the Seoul Megacity (2020)
 ; Eun-Han Kwon1) ; Young-Jun Kim1) ; Ji-Hye Seong1) ; Hyeji Ju1) ; Jun-Hyuk Ahn1) ; Il-Sang Bae1) ; Yong-Suk Choi1) ; Seog-Ju Cho1) ; Yong-Seung Shin1)
Copyright © 2021 by Asian Association for Atmospheric Environment
This is an open-access article distributed under the terms of the Creative Commons Attribution Non-Commercial License (http://creativecommons.org/licenses/by-nc/4.0/), which permits unrestricted non-commercial use, distribution, and reproduction in any medium, provided the original work is properly cited.
Abstract
The Center for Air Quality & Control at the Seoul Research Institute of Public Health and the Environment (SIHE) has monitored changes in the concentration of fine dust in Seoul over the past 10 years and investigated meteorological factors as well as fine particulate matter (PM2.5), sulfur dioxide (SO2), and nitrogen dioxide (NO2) concentrations in northeastern China and its contribution to the PM2.5 concentration in Seoul. The concentration of fine dust in Seoul in 2020 was 21 μg/m3, which is down 16% from 2019 and the lowest since 2010. In 2020, China’s emissions of pollutants such as NO2 have decreased significantly due to regional blockades, social distancing, and factory shutdowns caused by COVID-19. As a results, the concentration of precursors such as SO2 and NO2, and PM2.5 in northeastern China are also decreased, which contributed to the reduction in PM2.5 concentration in Seoul caused by westerly winds blowing. In addition, the ratio of east and south winds that usually contain low concentrations of pollutants was more than 30% of the total air currents into Seoul, which is the highest in the last three years. Moreover, the mean wind velocity and the amount of precipitation were also the highest recorded values of 2.4 m/s and 1651.0 mm, respectively. Calculations using Comprehensive Air quality Model with eXtensions (CAMx)-Particulate Source Apportionment Technology (PSAT) show that the contribution of external inflows to the PM2.5 concentration in Seoul was 65%. We believe that the reasons for the low PM2.5 concentration in 2020 are due to meteorological factors and a decrease in air pollution in northeastern China. Meanwhile, the major contribution of emissions in Seoul (resuspended road dust and non-exhaust dust) was high. When the concentration of PM2.5 was high, the contribution of resuspended road dust was reduced due to an increase of secondary generating materials. Currently, data on emission reduction due to the COVID-19 cannot be assessed, which we believe will enable more accurate contribution calculations in the future.
Keywords:
PM2.5, Seoul, Contribution, CAMx, Meteorological factors1. INTRODUCTION
Industrialization and economic growth in the 20th century have resulted in urbanization and increased air pollution emission that not only damages individuals’ health but also causes many social and economic problems. Air pollution has become one of the most important challenges in many metropolitan areas around the world, including Seoul. In response, the city of Seoul provides real-time air quality data obtained from air pollution monitoring network and operates an air pollution warning system to reduce citizen’s exposure to harmful substances. At the national level, a special Act on the Improvement of Air Quality in the Seoul metropolitan area was implemented to reduce air pollution in the metropolitan area. In addition, efforts are continually being made to improve the air quality by enacting the ‘Comprehensive Plan on Fine Dust’ and ‘Special Act on the Reduction and Management of Fine Dust’. As a result, the concentrations of primary air pollutants such as total suspended particles (TSP), nitrogen dioxide (NO2), sulfur dioxide (SO2), and carbon monoxide (CO) have clearly been reduced, which has confirmed the effectiveness of the reduction policies (Kim et al., 2018; MOE, 2013). Although the annual average concentration of fine particulate matter (PM2.5) in Seoul, which was around 30 μg/m3 in the early 2000s, has decreased to around 25 μg/m3, it has been shown only small changes each year from 2010 to 2019 suggesting it is not easy to reduce it any further.
Among the air pollutants, PM2.5 is an irregular particle substance with a diameter of 2.5 μm or less that can penetrate cell tissues and blood vessels and cause inflammation or serious illness. It is also known that there is a high risk to human health because other harmful substances such as organic compounds and heavy metals can be absorbed and become concentrated in the tissues (Lee et al., 2017; Leem et al., 1998). To minimize the damage caused by PM2.5 and prepare countermeasures, it is necessary identify the current status of PM2.5 concentration and analyze the factors that affect it.
High concentrations of air pollutants in a specific area are affected by their emission sources, air inflow and outflow from the boundary areas, the secondary generation and extinction due to the photochemical reactions, atmospheric depression and redistribution, etc. (Huang et al., 2014). Therefore, weather conditions that can cause physical and chemical changes in the atmosphere are the most important factors in determining the concentrations of air pollutants. Moreover, it is essential to take into account changes in the weather conditions to understand why the PM2.5 concentration changes (Dawson et al., 2014). According to many prior studies on the effects of weather on the PM2.5 concentration, low wind speed, high humidity, a low atmospheric boundary layer, and low amounts of precipitation contribute to a rise of PM2.5 concentration (Roldan-Henao et al., 2020; Yoo et al., 2020; Xu et al., 2018; Xu et al., 2015).
In air quality research, not only observational data analysis but also research through modeling is actively underway. Through meteorological and back trajectory models, potential emission areas that affect the air quality concentration in a particular area can be estimated, and atmospheric diffusion models such as the Community Multiscale Air Quality Modeling System (CMAQ) and Comprehensive Air Quality Model with eXtensions (CAMx) can be utilized to evaluate the diffusion and concentration of air pollutants (Ju et al., 2018; Kim et al., 2017). In addition, to evaluate the effect of improving air quality and human risk through emission reduction, it is necessary to apply air quality modeling along with observational data. In line with this trend, the Air Quality Analysis & Control Center at the Seoul Research Institute of Public Health and the Environment (SIHE) established an air quality evaluation system to analyze and evaluate the air quality of Seoul in 2019 that has been officially operating since May 2020.
In this study, the status of the air quality and weather conditions in Seoul in 2020 was examined and a contribution analysis was conducted using back trajectory model and photochemical models of air quality diagnostic evaluation system. At the same time, China’s air quality and satellite data were used to examine trends in the concentration of air pollutants around the Korean Peninsula, which can affect the PM2.5 concentration, in Seoul.
2. DATA
2. 1 Weather and Air Pollution Data
To understand the weather conditions in Seoul, weather data such as wind direction, wind speed, temperature, and precipitation observed at the Automatic Synoptic Observation System (ASOS) from 2010 to 2020 were collected. Precipitation days are days when the sum of the daily precipitation was more than 0.1 mm and stagnation days are days when the daily average wind speed was less than 2 m/s. The daily wind direction was classified as when the wind blew mainly to the north (320° to 50°), east (50° to 140°), south (140° to 230°), and west (230° to 320°) on any given day.
Currently, the city of Seoul operates 25 urban air quality monitoring stations (one station per district) that automatically measure air pollutants such as coarse dust, fine dust, ozone (O3), SO2, CO, and NO2. The hourly air pollution data measured at the 25 monitoring stations are managed by SIHE and open to the public through websites (https://cleanair.seoul.go.kr, https://www.airkorea.or.kr). Detailed information on the 25 urban air quality monitoring stations of Seoul can be found on the websites. In this study, we used PM2.5, NO2, SO2 data measured at the 25 stations for the past 10 years from 2010 to 2020 were collected along with meteorological data to analyze the air quality in Seoul. In addition, air quality data provided by the China National Environmental Monitoring Center (CNEMC), an affiliate of the Ministry of Environmental Protection of the People’s Republic of China, was used to investigate air pollutant concentrations in China from 2017 to 2020.
2. 2 Satellite NO2 Data
A TROPOspheric Monitoring Instrument (TROPOMI; Veefkind et al., 2012) is a sensor mounted on the European Copernicus Sentinel-5 Precursor (S5P) satellite launched in October 2017. TROPOMI observes over the wavelength range of 270-2385 nm, including ultraviolet, visible, and short-wavelength infrared regions, to provide information on various air pollutants such as O3, NO2, SO2, formaldehyde, aerosols, etc. The advantage is that it enables detailed urban-scale pollution level analysis with a spatial resolution of 7×3.5 km2, which is superior to pre-existing similar satellite sensors.
The tropospheric NO2 vertical column density (VCD) data measured by TROPOMI used in this study were obtained from monthly averaged data from the Tropospheric Emission Monitoring Internet Service (TEMIS) operated by the Royal Netherlands Meteorological Institute (KNMI). For more information on TROPOMI NO2 data, see van Geffen et al. (2019), and the data can be found at http://temis.nl/airpollution/no2col/no2month_tropomi.php.
2. 3 Trajectory Clustering
Air masses are useful data for estimating potential sources of air pollutants. In this study, data from the United States Environmental Protection Agency’s HYbrid Single-Particle Lagrangian Integrated Trajectory Model (HYSPLIT; Draxler et al., 2012) was utilized. The meteorological field used in the HYSPLIT model comprises reanalysis data with a spatial resolution of 2.5°×2.5° provided by the National Centers for Environmental Prediction/National Center for Atmospheric Research (NCEP/NCAR).
96 hours back trajectory modeling was performed at three-hour intervals at 500 m above the Seoul area and cluster classification was performed through Euclidean distance analysis of the trajectory; this is a method that calculates the distance between two trajectories and classifies them into several clusters with similar characteristics (Sirois and Bottenheim, 1995).
2. 4 Air Quality Modeling System
In this study, the influence of each region and emission source on the PM2.5 concentration in Seoul was analyzed using the Comprehensive Air quality Model with eXtensions (CAMx), which is a three-dimensional photochemical air quality model, and PSAT (Dunker et al., 2002), which is a tool for analyzing the contribution of the model.
To prepare meteorological input data for air quality simulation, a weather research and forecasting (WRF, Skamarock and Klemp, 2008) model was created with the National Centers for Environmental Prediction-Final (NCEP-FNL) as the base site. The input data for domestic and foreign anthropogenic emissions were prepared using the Sparse Matrix Operation Kernel Emission (SMOKE; Benjey et al., 2001) model based on Clean Air Policy Supporting System (CAPSS) 2015 provided by the National Institute of Environmental Research (NIER) and Work Plans for Model Inter Comparison Study - Asia Phase III (MICS-Asia; Li et al., 2017). The simulation analysis period was from May to December 2020 and two-way grid nesting was conducted with a grid resolution of 27 km for East Asia, 9 km for the Korean Peninsula, and 3 km and 1 km for Seoul.
2. 5 PM2.5 Contribution Rate Analysis
When performing the CAMx-PSAT, the emission areas were classified into Seoul, Incheon, Gyeonggi-do, Chungnam, other domestic areas, and overseas areas such as China; the impact of each area on the air quality in Seoul was calculated. In addition, Seoul’s emissions were reclassified at the level of CAPSS’s source classification code (SCC) division to understand the impact of Seoul’s emissions according to the source. The emission sources were classified as Non-industrial, Energy transport and storage, Solvent use, and Others from the 13 major categories of SCC emission. Emissions were grouped into non-combustion, and emission sectors were classified into road transport, non-road transport, fugitive dust, biomass burning, agriculture, and industry (energy production, manufacturing industry, industrial processes, and waste management).
3. RESULTS AND DISCUSSION
3. 1 Air Quality Status in 2020
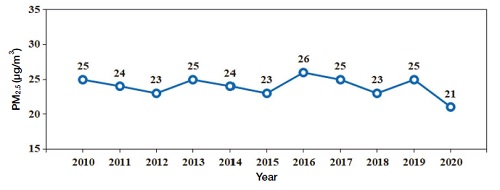
From 2010 to 2019, the average annual concentration of PM2.5 in Seoul was 23-26 μg/m3, with only small changes each year. In 2020, the PM2.5 concentration in Seoul was 21 μg/m3, a 16% (4 μg/m3) decrease compared to the previous year (25 μg/m3) and the lowest level since observations began (Fig. 1).
According to the average monthly fine dust concentration observed at the 25 urban air quality monitoring networks in Seoul, it is high in winter and spring and low in summer and autumn. This monthly change was largely influenced by foreign pollution via west winds, as well as the amount of fuel used for heating in winter and spring. On the other hand, the increasing precipitation and atmospheric diffusion in summer and autumn lower the PM2.5 concentration. As shown in Fig. 2, the lowest and highest PM2.5 concentrations in the monthly average data in 2020 were 11 μg/m3 in September and 29 μg/m3 in January, respectively.
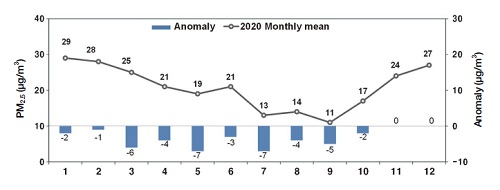
Average monthly PM2.5 concentration in 2020 (line) and anomalies compared with the observed average values over the last 10 years from 2010 to 2019 (bars).
A comparison of the average monthly PM2.5 concentrations for 2020 with the average values observed over the past 10 years from 2010 to 2019 revealed a decrease over the entire period, excluding November and December. In particular, the average monthly concentration decrease from March to September was significant, while November and December showed the same values.
Table 1 reports the monthly average concentrations of SO2 and NO2 in Seoul in 2020. The SO2 concentration was maintained at around 0.003 ppm throughout the year and showed no significant change, while the NO2 concentrations tended to be similar to the PM2.5 concentrations but were higher in winter.
3. 2 Weather Status in 2020
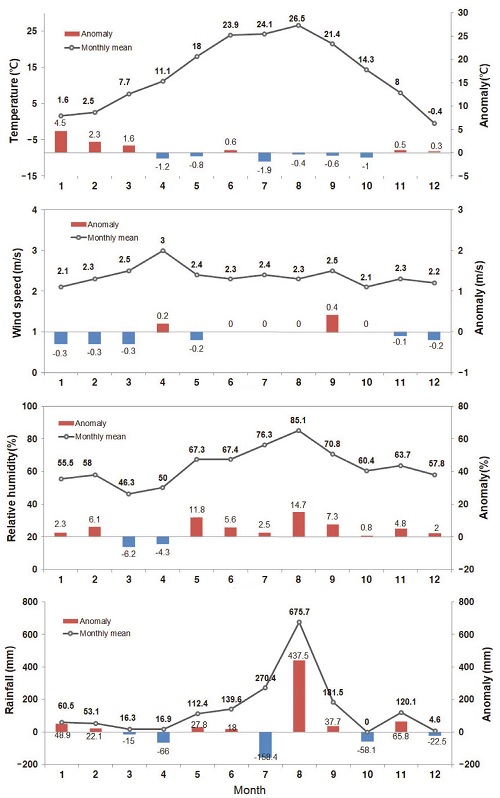
The total annual rainfall in Seoul in 2020 was 1651.0 mm, which is higher than the 10-year average and the highest in the past three years. Meanwhile, the annual average temperature was 13.2°C, which is higher than the average for the past 10 years, and the wind speed was 2.4 m/s, which is the highest in the past three years. In addition, the number of stagnation days when the daily average wind speed was less than 2 m/s was 117 days, which is the lowest value in the last three years. The number of east wind days in 2020 was the highest compared to 2018 and 2019 in terms of the number of days of the main wind direction.
The monthly weather data for Seoul in 2020 were compared with the average for the last 10 years. In 2020, Seoul showed higher temperatures in January-March than in the last decade, and temperatures were relatively low in April, May, and July-October. Relative humidity was generally higher than the average of the last 10 years except for March and April. The average wind speed was weak from January to March while relatively strong in September. Precipitation was the highest in August and was very high compared to the average over the past decade. Among these monthly average weather factors, high relative humidity is thought to be due to heavy precipitation. In addition, some studies have shown that PM2.5 concentrations are rather reduced at higher relative humidity (daily average) of more than 80% due to such precipitation (Yoo et al., 2020). The contribution to variations in PM2.5 concentrations of precipitation and relative humidity is difficult to assess. Besides, it is difficult to directly compare PM2.5 concentrations with monthly mean RH, as shown in the study (Zhang et al., 2017) that the average relative humidity was observed to have a less impact on the rise of PM2.5 concentration compared to the fluctuation in RH. Therefore, changes in PM2.5 concentrations and correlations with weather factors need to be studied in more detail in the future. Comprehensively, it seems that in 2020, weather conditions such as a large amount of precipitation, strong wind speeds, and increased east and south winds were favorable conditions for reducing the PM2.5 concentration.
3. 3 Trajectory Clustering
From January to December 2020, the results of 96 hour back trajectory modeling on the air mass above 500 m in Seoul were classified into five clusters (C1-C5) through the Euclidean distance analysis (Fig. 4). The geographical position of Korea means that it is in the path of the westerlies, and so 70.1% of the air currents flowing into Seoul originate from the northwest of the Korean Peninsula. Air currents occurring in the northwest region are clusters C1, C2, and C3 at rates of 29.5%, 13.3%, and 27.3%, respectively. C1 flows into Seoul from Lake Baikal in Siberia through Liaodong in China, and C2 from the Ural Mountains through Liaodong in Mongolia. C1 and C2 allow long-distance movement at strong wind speeds when the Siberian high pressure expands in spring and winter. C3 enters Seoul via the West Sea from the Liaodong region of China, and it appears to be under the influence of slow-moving high pressure that is only a short distance away from the air mass for 96 hours. C5 is an air current originating in the North Pacific and occurs mainly in summer. However, C4 occurs steadily without showing a distinct pattern for each season due to the influence of low pressure in the East Sea and high pressure moving in the northern part of the Korean Peninsula. By analyzing the clusters except for C4 in Fig. 5, the difference in the passage area of the air mass according to the seasons could be confirmed. These results are related to seasonal synoptic patterns in Korea and are similar to the cluster classification of Song et al. (2017).
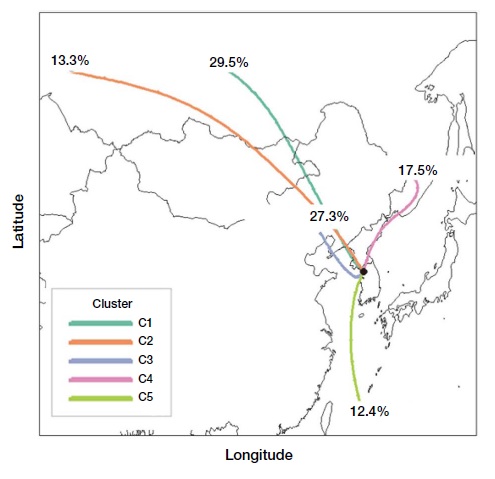
Cluster analysis of the back trajectories calculated for Seoul in 2020 and showing the mean trajectory for each cluster.
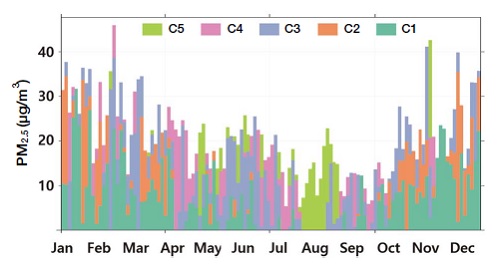
Temporal variation in three-daily PM2.5 concentration in Seoul according to the contribution from each cluster.
The average concentration of PM2.5 per cluster was the highest at 26.4 μg/m3 in C2, followed by C1 (22.0 μg/m3) and C3 (21.4 μg/m3). It means that the average concentration was high when it originated in the western part of the Korean Peninsula, where there are emission sources from China and Mongolia. On the other hand, the average concentrations of PM2.5 in C4 and C5 originating in marine areas without emission sources were 15.9 μg/m3 and 16.6 μg/m3, respectively, which were relatively lower than those of C1-C3 where emission sources exist.
These results indirectly confirm the impact of the movement process of the air current entering Seoul and the discharge effect of the passing area. Fig. 6 shows the results of a seasonal frequency analysis of back trajectory air currents, which are similar to the cluster analysis results. In spring and winter, the inflow frequency was high from the western part of the Korean Peninsula, the southern part in summer, and the northwest and east in autumn.
3. 4 Seoul PM2.5 Contribution Rate by Region and Source
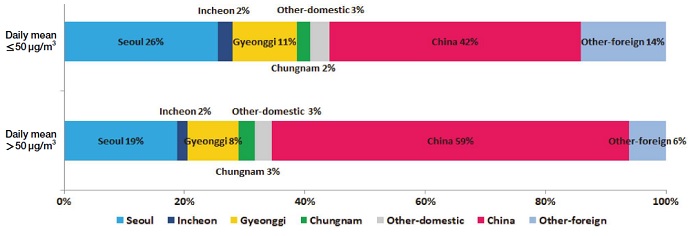
Using the CAMx-PSAT data, the domestic and foreign contribution rates to Seoul’s PM2.5 concentration were analyzed by dividing the number of days below and exceeding the daily average concentration (50 μg/m3) from May to December 2020. When the daily average PM2.5 concentration was less than 50 μg/m3, the self-contribution rate for Seoul was 26% and the influences of other cities and provinces were 11% and 2-3%, respectively. Therefore, the total domestic contribution rate was 44% and the overseas contribution rate is 56%. On the other hand, when the daily average PM2.5 concentration exceeded 50 μg/m3, the domestic contribution rate was 35% and the overseas contribution rate was 65%, indicating that the influence of foreign inflow is significant. However, the average concentrations for days below and above the daily average concentration (50 μg/m3) were 18 μg/m3 and 59 μg/m3, respectively, which constitutes a wide range. In the case of high PM2.5 concentration days, the domestic self-contribution rate decreased whereas the absolute amount of PM2.5 increased. Therefore, efforts to reduce domestic emissions are also deemed necessary to improve air quality at high concentrations (Fig. 7).
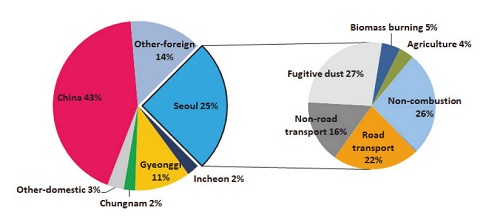
Fig. 8 shows the result for contribution by region and emission source to the PM2.5 concentration of 18 μg/m3 from May to December 2020. The self-contribution rate was 25%, and the contribution rates by emission sources were determined. During the analysis period, fugitive dust (27%), non-combustion (26%), road transport (22%), non-road transport (16%), biomass burning (5%), and agriculture (4%), in that order, with the contribution rate from industrial processes being very slight. However, when the average daily PM2.5 concentration exceeded 50 μg/m3, the contribution rate of non-combustion increased by more than 10% due to an increase in secondary generating materials, and the contribution rate of fugitive dust and non-road transport decreased. The main sources of emissions classified as non-combustion are residential and commercial facility boilers and organic solvents. The results of a detailed monitoring analysis study for PM2.5 in Seoul (SI, 2019) conducted in 2018 attained similar results as follows: road transport (26%), non-road transport (18%), fugitive dust (22%), biomass combustion (3%), and point sources and other regional sources (31%).
There may be some limitations in this study concerning the period for the analysis. Perhaps we did not reflect the recent emission reduction policies very well, especially the rapid change in emissions caused by the COVID-19 pandemic. In the future, we expect that further improvement in the results for PM2.5 contributions in Seoul can be achieved by using a self-contribution evaluation modeling system along with the updated emissions data.
3. 5 Air Quality Changes in China
As Korea is located downwind of the westerlies blowing in from China, it is affected by China’s emissions (Lee et al., 2014). Therefore, the Ministry of Environment analyzed the contribution of each country along with China and Japan (NIER, 2019). In this study, the PM2.5 concentration in China in 2020 was analyzed overall and by region: Beijing, Tianjin, Hebei, Shandong, and Liaoning. In addition, the concentrations of NO2 and SO2, which are major precursors of PM2.5 that produce ammonium nitrate (NH4NO3) and ammonium sulfate ((NH4)2SO4), respectively, were reviewed together.
As shown in Fig. 9, the monthly PM2.5 concentration (line) in China increased from autumn to winter in 2020, but in the case of Beijing, Tianjin, and Hebei (BTH) regions, concentrations in November and December decreased slightly compared to October. We consider that the increases in SO2 and NO2 concentrations in November and December in these regions were not significant. The rate of change in PM2.5 concentration (bars) was the greatest in February and March compared to the last three years (2017-2019). Because of COVID-19 pandemic, the strong lockdown policy implemented in early 2020, and there was sharp drop of pollutants emission (Zhang et al., 2021; Feng et al., 2020). And then, there have been some fluctuations after March, the BTH regions have seen relatively high concentration decreases in September, November, and December.
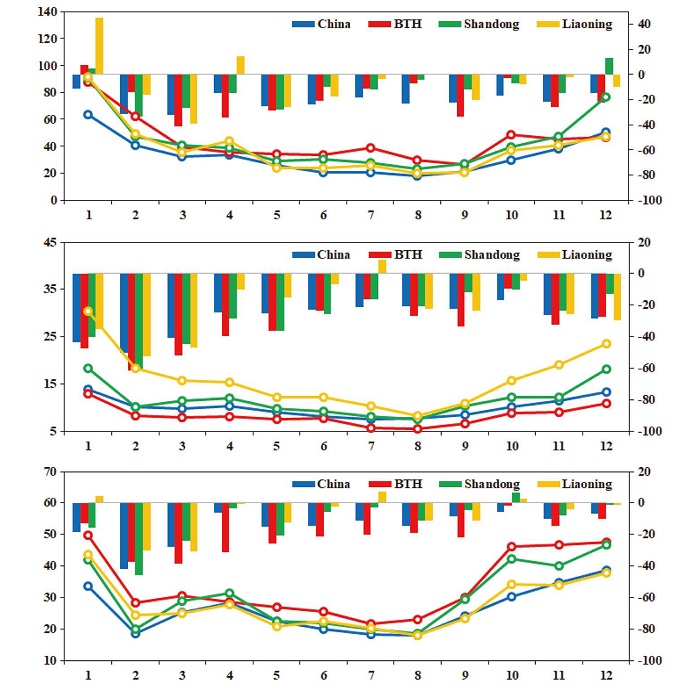
Monthly PM2.5, NO2, and SO2 concentrations in 2020 (line) and the anomalies compared to the average for the past three years (bars).
The SO2 concentration in 2020 generally showed a significant decrease compared to the last three years, and the SO2 concentration in February showed a 50-62% decrease compared to the last three years. By season, the pattern was similar to the change in PM2.5 concentration and increased in winter. The concentration in the Liaoning region was higher than in the others throughout the year, especially in the late autumn to winter when heating is switched on. This is around twice that of the BTH regions where sanctions on solid fossil fuel use are relatively strong. We anticipate that heating and industrial activities using flaming coal are still active in the Liaoning region caused this change in SO2 concentration.
On the other hand, the concentration change was relatively small for NO2. The concentration of NO2 in February 2020 decreased by 30% to 46% compared to the average concentration in February for the last three years, which we also believe to be due to regional blockades. However, after June, NO2 concentrations in regions other than BTH recovered and the rate of change decreased to around 10%, which is not significantly different from the average concentrations over the past three years.
3. 6 NO2 Concentration Changes in Northeast Asia
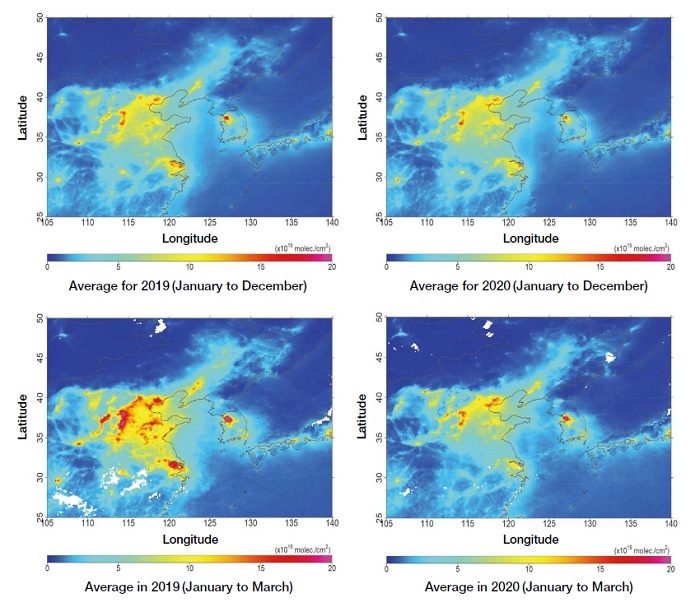
Fig. 10 shows the tropospheric NO2 vertical column concentrations in the Northeast Asia region observed by TROPOMI in 2019 and 2020. The overall NO2 distribution has not changed significantly, and it has decreased some-what around the metropolitan area in Korea and China in 2020. However, early 2020 (January-March) represents a clear pattern of declining NO2 concentrations in China compared to 2019 when containment measures began due to the COVID-19 pandemic. Comparing the average values from January to March with high emissions and high pollution in central China (30-40N, 110-120E), the NO2 reduction rate in 2020 was much higher at 38.3% compared to 2019. Given that the variability in NO2 emissions is in good agreement with changes in the vertical column concentration of NO2 observed from satellites (Foy et al., 2016), this great change observed by TROPOMI implies that China’s NO2 emissions have significantly decreased as socio-economic activities have been restricted due to the COVID-19 pandemic.
4. SUMMARY AND CONCLUSIONS
To evaluate the PM2.5 concentration in Seoul in 2020, the trend of the last 10 years from 2011 to 2020 and the current status of PM2.5 concentration were examined. For a more accurate analysis, changes in emissions and air pollution trends around the Korean Peninsula, which can affect the PM2.5 concentration in Seoul, were examined using satellite observations of air quality in China. In addition, the self-contribution of Seoul to the PM2.5 concentration was evaluated using back trajectory modeling and atmospheric diffusion modeling.
From the results, the concentration of PM2.5 in Seoul has shown a long-term decreasing trend; it has recently dropped to around 25 μg/m3 and has been as low as 21 μg/m3, which is the lowest record in 2020. We believe that this is due to the favorable weather conditions for reducing the PM2.5 concentration, as well as a reduction of particle-forming precursors in China, and decrease of energy consumption in Korea (KEEI, 2021) because of COVID-19.
For a cluster analysis in the back trajectory modeling, the air current entering Seoul was classified into 5 clusters according to seasonal characteristics. In spring and winter, when the concentration of PM2.5 is frequently high, air currents originate from the west of the Korean Peninsula (C1+C2+C3=70.1%). On the other hand, in the summer when the PM2.5 concentration is usually low, the air currents originating from the North Pacific Ocean were strong.
From the analysis of the contribution rate of PM2.5 in Seoul using CAMx-PSAT data from May to December 2020, the domestic self-contribution rate is 44% (26% in Seoul, 11% in Gyeonggi-do, and 2-3% from other cities), and the overseas contribution rate was 56% when the daily average concentration was less than 50 μg/m3, and when the average daily PM2.5 concentration exceeded this, the domestic contribution rate was 35% and the overseas contribution rate was 65%, which shows an increased contribution by foreign inflows.
As for the contribution by emission source, fugitive dust showed the highest contribution rate of 27%, followed by non-combustion (26%), road transport (22%), and non-road transport (16%). However, we did not reflect the drastic changes in emissions caused by the COVID-19 pandemic, and research is already underway to consider its impact, which will be reported on in the future.
According to satellite observations of air quality in China, the amounts of SO2 and NO2 (precursors of PM2.5) around the Korean Peninsula decreased significantly by 50% and 30%, respectively, from February to March. We believe that they were affected by the overall social situation caused by the COVID-19 pandemic. Even though we did not include carbon matter, which is another major component of PM2.5, in the analysis, we still suggest that decreases in the concentrations of SO2 and NO2 significantly influenced the PM2.5 concentration in China, reflected by a 10-40% decrease in PM2.5 concentration in February and March, depending on the region. In the case of Seoul, the PM2.5 decline began to be noticeable from March, and after the rainy season, PM2.5 began to increase again from October. Changes in NO2 concentration also follow the same trend, although it showed little change throughout the year. Meanwhile, this period coincides with the period when PM2.5, SO2, and NO2 concentrations began to increase again in the BTH, Shandong, and Liaoning regions in China. Therefore, the overseas contribution rate to the PM2.5 concentration in Seoul increased from 56% to 65%, which is considered to have partially influenced the Korean PM2.5 concentration along with the northwest wind according to the season.
References
- Benjey, W., Houyoux, M., Susick, J. (2001) Implementation of the SMOKE emission data processor and SMOKE tool input data processor in models-3, US EPA.
-
Dawson, J.P., Bloomer, B.J., Winner, D.A., Weaver, C.P. (2014) Understanding the meteorological drivers of US particulate matter concentrations in a changing climate. Bulletin of the American Meteorological Society, 95, 521-532.
[https://doi.org/10.1175/BAMS-D-12-00181.1]

- Draxler, R., Stunder, B., Rolph, G., Stein, A., Taylor, A. (2012) HYSPLIT4 user’s guide. http://www.arl.noaa.gov/documents/reports/hysplit_user_guide.pdf, (Last accessed December 2020).
-
Dunker, A.M., Yarwood, G., Ortmann, J.P.W., Wilson, G.M. (2002) Comparison of source apportionment and source sensitivity of ozone in a three-dimensional air quality model. Environmental Science and Technology, 36(13), 2953-2964.
[https://doi.org/10.1021/es011418f]

-
Feng, S., Jiang, F., Wang, H., Wang, H., Ju, W., Shen, Y., Zheng, Y., Wu, Z., Ding, A. (2020) NOx emission changes over China during the COVID-19 epidemic inferred from surface NO2 observations. Geophysical Research Letters, 47(19), e2020GL090080.
[https://doi.org/10.1029/2020GL090080]

-
Foy, B., Lu, Z., Streets, D. (2016) Satellite NO2 retrievals suggest China has exceeded its NOx reduction goals from the twelfth Five-Year Plan. Scientific Reports, 6, 35912.
[https://doi.org/10.1038/srep35912]

-
Huang, R.J., Zhang, Y., Bozzetti, C., Ho, K.F., Cao, J.J. (2014) High secondary aerosol contribution to particulate pollution during haze events in China. Nature, 514, 218-222.
[https://doi.org/10.1038/nature13774]

-
Ju, H., Bae, C., Kim, B.-U., Kim, H.C., Yoo, C., Kim, S. (2018) PM2.5 Source Apportionment Analysis to Investigate Contributions of the Major Source Areas in the Southeastern Region of South Korea. Journal of Korean Society for Atmospheric Environment, 34(4), 517-533.
[https://doi.org/10.5572/KOSAE.2018.34.4.517]

-
Kang, Y.H., You, S., Bae, M., Kim, E., Son, K., Bae, C., Kim, Y., Kim, B., Kim, H.C., Kim, S. (2020) The impacts of COVID-19, meteorology, and emission control policies on PM2.5 drops in Northeast Asia. Scientific Reports, 10(1), 1-8.
[https://doi.org/10.1038/s41598-020-79088-2]

- Kim, S., Bae, C., Kim, B.-U., Kim, H.C. (2017) PM2.5 simulations for the Seoul Metropolitan Area: (I) contributions of precursor emissions in the 2013 CAPSS emissions inventory. Journal of Korean Society for Atmospheric Environment, 33(2), 139-158, (in Korean with English abstract).
-
Kim, Y.P., Lee, G. (2018) Trend of Air Quality in Seoul: Policy and Science. Aerosol and Air Quality Research, 18, 2141-2156.
[https://doi.org/10.4209/aaqr.2018.03.0081]

- KEEI (Korea Energy Economics Institute) (2021) Korea energy review monthly, 25.
-
Lee, H.-J., Kim, S.-W., Brioude, J., Cooper, O.R., Frost, G.J., Kim, C.-H., Park, R.J., Trainer, M., Woo, J.-H. (2014) Transport of NO2 in East Asia identified by satellite and in-situ measurements and Lagrangian particle dispersion model simulations. Journal of Geophysical Research: Atmospheres, 119, 2574-2596.
[https://doi.org/10.1002/2013JD021185]

- Lee, T.J., Jeon, W.-B., Lee, H.W. (2017) Analysis of meteorological patterns causing high concentration of PM10 in the Korean peninsula during the last 10 years. Proceedings of the Korea Environmental Sciences Society Conference, 26.
-
Leem, J.H., Lee, J.T., Kim, D.G., Shin, D.C., Roh, J.H. (1998) Short-term-Effects of Air Pollution on Hospital Visits for Respiratory Diseases in Seoul. Korean Journal of Occupational and Environmental Medicine, 10(3), 333-342.
[https://doi.org/10.35371/kjoem.1998.10.3.333]

-
Li, M., Zhang, Q., Kurokawa, J., Woo, J.-H., He, K.B., Lu, Z., Ohara, T., Song, Y., Streets, D.G., Carmichael, G.R., Cheng, Y.F., Hong, C.P., Huo, H., Jiang, X.J., Kang, S.C., Liu, F., Su, H., Zheng, B. (2017) MIX: a mosaic Asian anthropogenic emission inventory for the MICS-Asia and the HTAP projects. Atmospheric Chemistry and Physics, 17(2), 935.
[https://doi.org/10.5194/acp-17-935-2017]

- MOE (Ministry of Environment) (2013) Basic Plan on the 2nd stage Metropolitan Area Air Quality Management, (in Korean).
-
Roldan-Henao, N., Hoyos, C.D., Herrera-Mejia, L., Isaza, A. (2020) Investigation of the Precipitation Net Effect on the Particulate Matter Concentration in a Narrow Valley: Role of Lower Troposphere Stability. Journal of Applied Meteorology and Climatology, 59(3), 401-426.
[https://doi.org/10.1175/JAMC-D-18-0313.1]

- SI (The Seoul Institute) (2019) Research on detailed monitoring of PM2.5 concentration in Seoul.
-
Sirois, A., Bottenheim, J.W. (1995) Use of backward trajectories to interpret the five-year record of PAN and O3 ambient air concentrations at Kejimkujik National Park, Nova Scotia. Journal of Geophysical Research - Atmospheres, 100, 2867-2881.
[https://doi.org/10.1029/94JD02951]

-
Skamarock, W.C., Klemp, J.B. (2008) A time-split nonhydrostatic atmospheric model for weather research and forecasting applications. Journal of Computational Physics, 227, 3465-3485.
[https://doi.org/10.1016/j.jcp.2007.01.037]

- Song, H., Lee, D., Lee, K., An, S., Lee, S., Yang, Y., Kim, S., Juen, H., Seo, G., Do, W., Cho, Y. (2017) Characterization of PM10 Concentration in Urban Gwangju and Its Source Identification Based on Cluster Analysis of Air Mass Trajectory. Journal of Korean Society for Environment Analysis, 20(4), 239-251.
- van Geffen, J.H.G.M., Eskes, H.J., Boersma, K.F., Maasakkers, J.D., Veefkind, J.P. (2019) TROPOMI ATBD of the total and tropospheric NO2 data products, Report S5P-KNMIL2-0005-RP, KNMI, De Bilt, The Netherlands.
-
Veefkind, J.P., Aben, I., McMullan, K., Forster, H., De Vries, J., Otter, G., Claas, J., Eskes, H.J., de Hann, J.F., Kleipool, Q., Van Weele, M., Hasekamp, O., Hoogeveen, R., Landgraf, J., Snel, R., Tol, P., Ingmann, P., Voors, R., Kruizinga, B., Vink, R., Visser, H., Levelt, P.F. (2012) TROPOMI on the ESA Sentinel-5 Precursor: A GMES mission for global observations of the atmospheric composition for climate, air quality and ozone layer applications. Remote Sensing of Environment, 120, 70-83.
[https://doi.org/10.1016/j.rse.2011.09.027]

-
Xing, J., Li, S., Jiang, Y., Wang, S., Ding, D., Dong, Z., Zhu, Y., Hao, J. (2020) Quantifying the emission changes and associated air quality impacts during the COVID-19 pandemic on the North China Plain: a response modeling study. Atmospheric Chemistry and Physics, 20(22), 14347-14359.
[https://doi.org/10.5194/acp-20-14347-2020]

-
Xu, J., Yan, F., Xie, Y., Wang, F., Wu, J., Fu, Q. (2015) Impact of meteorological conditions on a nine-day particulate matter pollution event observed in December 2013, Shanghai, China. Particuology, 20, 69-79.
[https://doi.org/10.1016/j.partic.2014.09.001]

-
Xu, Y., Xue, W., Lei, Y., Zhao, Y., Cheng, S., Ren, Z., Huang, Q. (2018) Impact of Meteorological Conditions on PM2.5 Pollution in China during Winter. Atmosphere, 9(11), 429.
[https://doi.org/10.3390/atmos9110429]

-
Yoo, H.-H., Hong, J.-W., Hong, J.-K., Sung, S.-Y. (2020) Impact on Meteorological Conditions on the PM2.5 and PM10 concentrations in Seoul. Journal of Climate Change Research, 11(5-2), 521-528.
[https://doi.org/10.15531/KSCCR.2020.11.5.521]

-
Zhang, L., Cheng, Y., He, Y., Gu, Z., Yu, C. (2017) Impact of Air Humidity Fluctuation on the Rise of PM Mass Concentration Based on the High-Resolution Monitoring Data. Aerosol and Air Quality Research, 17, 543-552.
[https://doi.org/10.4209/aaqr.2016.07.0296]

- Zhang, Q., Pan, Y., He, Y., Walters, W.W., Ni, Q., Liu, X., Xu, G., Shao, J., Jiang, C. (2021) Substantial nitrogen oxides emission reduction from China due to COVID-19 and its impact on surface ozone and aerosol pollution. Science of the Total Environment, 753, 142238.
