Impact of Lockdown on Air Pollutants during COVID-19 at Patna, India
Copyright © 2021 by Asian Association for Atmospheric Environment
This is an open-access article distributed under the terms of the Creative Commons Attribution Non-Commercial License (http://creativecommons.org/licenses/by-nc/4.0/), which permits unrestricted non-commercial use, distribution, and reproduction in any medium, provided the original work is properly cited.
Abstract
Many countries shut their borders, imposed nationwide lockdown, and restricted several anthropogenic activities to arrest the spread of COVID-19. In the present study, the concentration of several air pollutants (PM10, PM2.5, NO2, NH3, SO2, CO and O3) during different phases of lockdown from monitoring stations of Patna was analyzed to assess the effect of lockdown restriction on air quality. Reduction in PM2.5, NH3, NO2, PM10 and CO concentration was observed by 59.79%, 58.2%, 49.49%, 39.57% and 24.04%, respectively during the lockdown period. National Air Quality Index (NAQI) value in the year 2020 had been observed to lower by 57.88% compared to the year 2019, during the same period. A more significant fall in the concentration of air pollutants was observed during the early phase of post-lockdown compared to the late stages of post-lockdown. The study reflects the significance of restriction on anthropogenic activities in improving air quality and provides clues for future action plans for improving air quality.
Keywords:
Lockdown, NAQI, PM2.5, Air pollutants, Patna1. INTRODUCTION
The world has recently faced a global pandemic COVID-19, first detected in Wuhan, Central China, in December 2019 (He et al., 2020; Zhang et al., 2020; Zhu et al., 2020). The virus has gradually affected all nations since December 2019 (Rajbhandari et al., 2020; Wang et al., 2020). Until 13th December 2020, nearly 70 million confirmed COVID cases, and 1.6 million deaths owing to COVID-19 was reported (WHO, 2020a). In response to the increase in the number of cases and contagion nature of COVID-19, the Government of India has imposed a 14-hour Janta Curfew on 22nd March 2020, followed by a complete nation-wide lockdown from 24th March to 30th June 2020 in four phases. During that time, all commercial, industrial and educational activities were closed to limit the spread of infection. The unlock phase was slow, gradual, and completed in seven stages, and restricted commercial and transportation activities were permitted in non-containment zones. Lockdown has slowed down the pace of living, but it has positive outcomes regarding environmental issues including air quality across many cities in India (Agarwal et al., 2020; Gautam, 2020; Kumari and Toshniwal, 2020; Mahato et al., 2020; Sharma et al., 2020; Singh and Chauhan, 2020; Srivastava et al., 2020) and in other countries also (Hashim et al., 2021; Baldasano, 2020; Dantas et al., 2020; Mesas-Carrascosa et al., 2020; Tobías et al., 2020; Wang et al., 2020; Zhu et al., 2020).
Patna, the capital of Bihar, is among the most populous and developing city in the Indo-Gangetic Plain. It has emerged as the second-largest economic center of eastern India after Kolkata and was ranked 32nd among the top 100 polluted cities in the world and 24th in India as per The World Air Quality report, 2020 (IQAir, 2020). The increasing population, economic and urban development have enhanced the burden on different sectors (industrial, transportation, domestic, constructional, biomass burning, etc.) as significant sources of air pollutants at Patna (Guttikunda et al., 2019). The literature review reveals that vehicular emissions (Jain et al., 2019; Sharma et al., 2016; Pandey and Venkataraman, 2014), use of biofuels in traditional cookstoves (Singh et al., 2021; Sen et al., 2018; Saud et al., 2012), municipal solid waste and agricultural biomass burning and 388 functional brick kilns (Joshi, 2019) were the major contributors to PM2.5 and PM10 in the Indo-Gangetic Plains (Kumar et al., 2020a; Arif et al., 2018). Several researchers reported a high concentration of air pollutants over the Indo-Gangetic plain (Mhawish et al., 2020; Mishra and Kulshrestha, 2020; Ojha et al., 2020; Shastri et al., 2017; Acharya and Sreekesh, 2013).
Among air pollutants, PM2.5 and PM10 constitute significant concern at Patna as these parameters often exceed the standard limits prescribed by NAAQS. Under the business-as-usual (BAU) scenario, the concentration level of PM2.5 is expected to increase by 28%, from 104.4 μg/m3 in 2018 to 134.0 μg/m3 by 2030 (PCAAP, 2019). An increase in emission load for PM2.5 in the city is also attributed to natural phenomena like climatic and meteorological conditions, the presence of very soft alluvial soil and atmospheric reactions generating secondary particulate matters (PCAAP, 2019).
The degradation in air quality has caused an increase in significant health risks and enhanced considerable premature mortality (Arif and Parween, 2021; Barzeghar et al., 2020; Hama et al., 2020; Sharma et al., 2020; Shukla et al., 2020; Stanaway et al., 2018). Nearly 980,000 deaths reported in India in 2019 were attributable to PM2.5, which has increased by 61% or 343,000 deaths between 2010-2019 (HEI and IHME, 2020 (https://www.stateofglobalair.org/resources)). As per the (BSPCB, 2014) report, 2,600 premature deaths were recorded in 2012 at Patna that could reach 4,900 premature deaths in 2030 if no control measures are introduced and enforced.
During this lockdown, it has been noticed that the air pollution levels came within or below the permissible limit set by the CPCB of India (Gour et al., 2015). Most of the recent literature published in air quality during the COVID-19 pandemic lockdown in various Indian cities is illustrated in Table 1. The majority of the studies conducted (Bedi et al., 2020; Gautam, 2020; Kotnala et al., 2020; Kumar et al., 2020b; Mahato et al., 2020; Singh and Chauhan, 2020) revealed early trends as they were confined to the lockdown period only and ignored the post-lockdown scenario. Our area of interest, Patna, is part of the Indo-Gangetic Plain where air pollution is at its peak in the last quarter of the year (Mishra and Kulshrestha, 2020; Ojha et al., 2020). Moreover, the study conducted by Bedi et al. 2020 and Navinya et al. 2020 focused on various Indian cities at a time. However, only a single monitoring station was considered per city, which is insufficient for spatial analysis. The obtained data cannot truly depict the air quality of the entire city. Masum and Pal (2020) reported that changes in air quality due to the COVID-19 pandemic do not follow a similar trend in different regions; hence, a regional study is essential to determine the pattern of changes. Therefore, this paper aimed to study the impact of complete lockdown on the air quality of Patna by comparing air quality parameters during pre-lockdown, lockdown and post-lockdown phases in the year 2020 with those of the corresponding period in 2019. In our study, Correlational analysis GIS-based spatial maps was also used to provide in-depth insights to the authorities concerned to formulate a better management plan to improve the anthropogenic air pollutant exposure in Patna and provide a baseline for other important cities of the Indo-Gangetic Plain.
2. MATERIALS AND METHODS
2. 1 Study Area
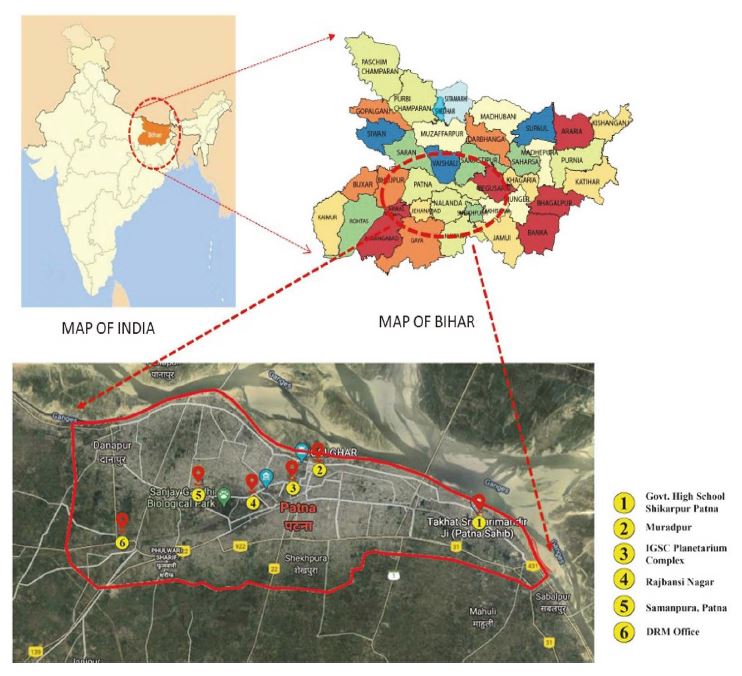
The area under investigation is Patna, the capital and largest city of Bihar situated 15 km along the bank of River Ganga between 25°56′N to 25°69′N latitude and 85°02′E to 85°25′E longitude in the Indo-Gangetic Plains. The city experiences a subtropical climate with a hot summer, a cold winter, and heavy rainfall during the monsoon season. Relative humidity can reach up to 100% during the summer season. At present, the Bihar State Pollution Control Board (BSPCB) monitors the air quality of Patna with the help of 6 Continuous Air Monitoring Stations (CAMS) distributed throughout the city (Fig. 1).
2. 2 Data Collection and Methodology
To study the effect of lockdown on the air quality of Patna, primary data from 6 different monitoring stations was collected from the CPCB online portal (https://app.cpcbccr.com/AQI_India/) and the BSPCB online portal (http://bspcb.bih.nic.in/environment-monitoring-data.html). The concentration of 7 different air pollutants was considered, including PM2.5, PM10, NO2, NH3, SO2, O3 and CO. For contaminants such as PM2.5, PM10, NO2, NH3 and SO2, the daily average (24h) subindex value and CO and O3 daily maximum (8h) average sub-index value had been taken. This was further analysed to see the change in their mean concentration between different phases. The fluctuation in AQI value and mean concentration have been studied in four phases in the year 2020 from pre-lockdown (1st January to 24th March) to lockdown (25th March to 31st May) to early phases of post-lockdown (1st June to 31st August) to the late phase of post-lockdown (1st September to 15th December). The method adopted to calculate NAQI is tabulated in (CPCB, 2014) briefly outlined here. AQI uses PM2.5, PM10, NO2, SO2, CO and O3 as criteria pollutants, where the selection of parameters depends on AQI objective(s), data availability, averaging period and monitoring frequency (CPCB, 2014). Of all the air pollutants, the calculation of AQI requires a concentration of a minimum of three pollutants, with at least one being either PM2.5 or PM10. The maximum sub-index AQIi of the corresponding pollutant is the overall AQI, where the sub-index AQIi of each pollutant can be calculated using Eq. (1).
| (1) |
Where Ci is the concentration of pollutant ‘i’; BHI and BLO are breakpoint concentrations higher and lower than Ci and IHI and ILO are corresponding AQI values equivalent to BHI and BLO respectively. The health breakpoint of each pollutant is given in Table 2.
3. RESULTS AND DISCUSSION
3. 1 Variation in Air Pollutants Concentration
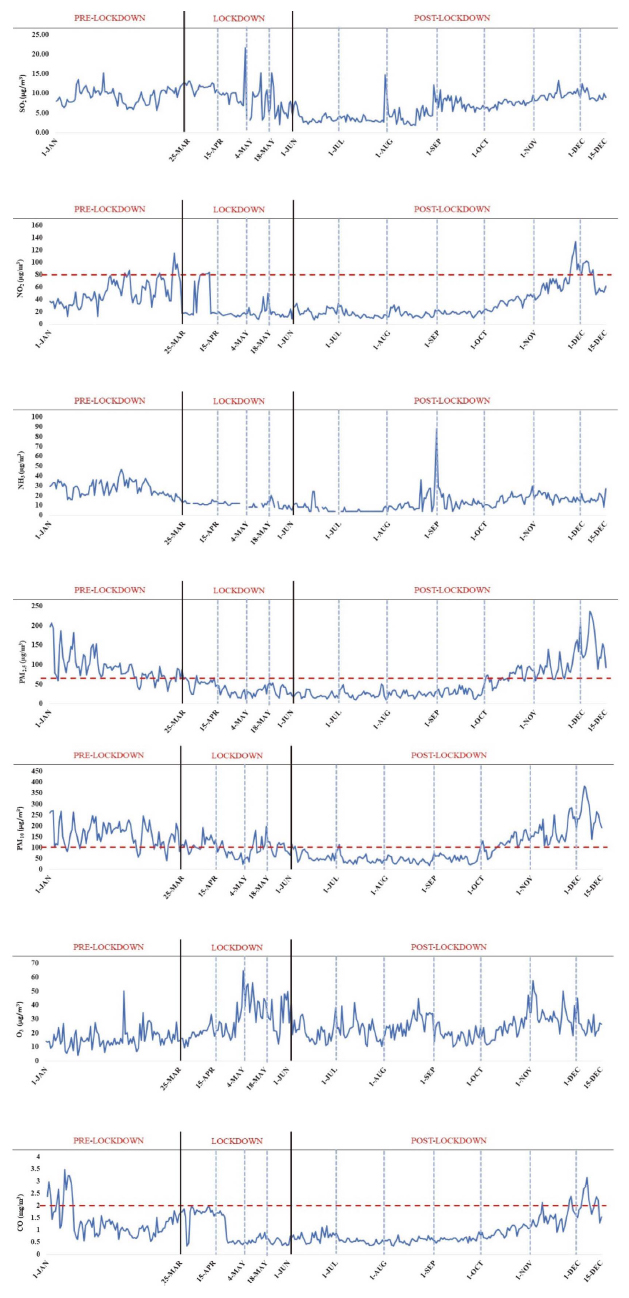
The minimum, maximum and mean value of the daily average concentration of different air pollutants have been summarized in Table 3. The results revealed particulate matter (PM2.5 and PM10) as the dominant and indicatory air pollutant during the entire study period. The concentration of PM10 ranged from 17.33 μg/m3 to 382.12 μg/m3 while PM2.5 was observed between 9.00 μg/m3 to 236.38 μg/m3 during the study period. The dominance of particulate matter among the air pollutants in the study area might be due to various anthropogenic activities like re-suspension of road dust, construction activities, open burning of solid waste, emission from vehicles and brick kilns etc. Patna is situated along the bank of river Ganga and ¾th of its soil is alluvial and makes the soil soft and prone to the formation of dust which is blown into the city from the sandy riverbank adding to the particulate matter level as outside contributors (PCAAP, 2019). Various atmospheric reactions producing secondary particulate matter also add to the level of PM2.5 and PM10 in the study area. Fig. 2 represents the variation in daily average (24h) concentration of PM10, PM2.5, NO2, SO2, NH3 and daily maximum (8h) average of O3 and CO between 1st January 2020 and 15th December 2020 in the city of Patna. The result revealed a reduction in the daily average value of PM10, PM2.5, NO2, SO2, NH3 and CO from pre-lockdown to lockdown and from lockdown to early phases of post-lockdown. The daily average PM10 value was beyond the NAAQS standard limit of 100 μg/m3 during the pre-lockdown. The daily average concentration of PM10 and PM2.5 has been reduced by 39.57% and 59.79%, respectively, from pre-lockdown to lockdown (Table 3). A higher decrease in PM2.5 value compared to PM10 could be due to reduction in transport activities as the contribution of vehicular emissions and emissions from the combustion of gasoline or other such fuels to PM2.5 is much more pronounced than that of PM10 (PCAAP, 2019; ARAI and TERI, 2018; Guttikunda and Jawahar, 2014). Interestingly, the scenario gets reversed when the percent change between lockdown and the early stages of post-lockdown are analyzed. PM10 declined by 49.49%, while PM2.5 dropped only by 36.44%, which might be due to the relaxation in inter-state and intra-state travel in the early post-lockdown period as vehicular emission contributes more to PM2.5 (Kumar et al., 2020b). Further, negligible construction, industrial activities, waste burning reduction, landfills, and intermittent rainfall might be responsible for a significant drop in PM10 level during the early post-lockdown period (CARB 2021; Sahoo et al., 2021; Sathe et al., 2021; Kumar et al., 2020a). A decline in the average concentration of NO2 and NH3 was also observed. The NO2 value can be seen at an alarming level during pre-lockdown and has decreased by 52.52% from pre-lockdown to lockdown and 18.74% from lockdown to initial unlock stages, mainly due to a reduction in the transport sector. The NH3 daily average concentration has been reduced by 58.20% from pre-lockdown to lockdown. Although the anthropogenic source of NH3 originates mainly from agricultural activities, including the use of soil fertilizer, domestic animal waste and the use of ammonia-based fertilizers, the reduction of NH3 can be attributed to industrial and traffic emissions in the urban areas (Farren et al., 2020; Li et al., 2020; Wang et al., 2015). No significant change in SO2 concentration has been observed during the entire study period except in early post-lockdown ( June to September) that suggests vehicular restriction might have not much impact on SO2 concentration (Lokhandwala and Gautam, 2020). Decrease in SO2 concentration during the early post-lockdown period is due to substantial rainfall during this period (Fig. 2). Several researchers reported a reduction in the concentration of SO2 during the rainy season, probably due to the washout effect (Ngarambe et al., 2021; Xue et al., 2020). The result revealed that the average concentration of CO had declined by 24.04% during the lockdown, and it had further decreased by 40.54% during the early post-lockdown period. A decrease in CO concentration during the lockdown period might be due to restrictions on combustion engines, heating furnaces and automobile exhaust. Further decrease in CO concentration during the early post-lockdown period may be due to the precipitation washout effect (Ngarambe et al., 2021; Yoo et al., 2014). Strikingly, the mean average concentration of O3 has increased by 73.75% from pre-lockdown to lockdown, which is due to a decrease in NOx and VOCs concentration because of the complete restriction on industrial activity and vehicular movement (Filonchyk and Hurynovich, 2020; Kumari and Toshniwal, 2020; Mahato et al., 2020). Sharma et al. (2020) reported that a decrease in the concentration of particulate matter could result in more sunlight penetration, thereby increasing the photochemical reaction that can uplift O3 production.

Summarizing daily average concentration and % change of air pollutants in different phases of the year 2020.
The pollutant concentration data also revealed the effect of sequential unlock phases on air pollutants. PM2.5 has experienced a maximum increase of about 235.01% from the early stages of post-lockdown to the late stages, followed by PM10 (176.57%), NO2 (137.29%), SO2 (105.18%), CO (94.94%), NH3 (87.36%) and O3 (4.06%). An increase in the concentration of these pollutants during sequential unlock phases might have resulted from resumption of anthropogenic origin pollutants and changing weather and meteorological conditions (Mahato et al., 2020; Sharma et al., 2020; Srivastava et al., 2020).
The daily, weekly, and monthly variations of different air pollutants are conditionally formatted (Fig. 3). The higher value has been colored by red that decreases to green at the lower values. PM10, PM2.5, NO2, NH3 and CO remained high during the pre-lockdown (January to March) and late post-lockdown (October to December). During the lockdown, each of them experiences a reduction in their daily average concentration. The concentration of O3 on the other hand, was observed to be high in May. The result suggests the reduction in transportation and industrial activities has a predominant impact on the concentration of particulate matter, NO2, and NH3, as their concentration started dropping with the implementation of the lockdown (near the end of March). CO and SO2 have begun to decline at the tail end of April, suggesting restrictions on vehicular emissions might not have much to do with these pollutants, specifically SO2, and incomplete combustion of fossil fuel from biomass burning might have contributed to CO. The concentration of NH3 shows an unusual increase towards the end of August (Fig. 3). This increase was explicitly marked in the data collected from the Danapur site, which might be due to some agriculturally based activities (CGWB, 2015) in addition to vehicular emissions.
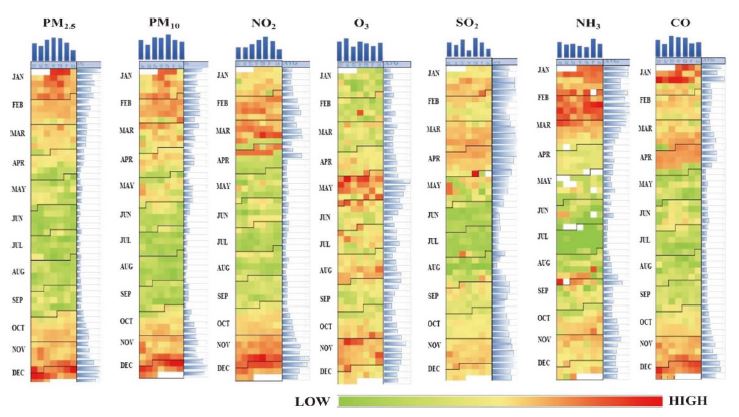
Conditional formatting representing daily, weekly and monthly variation in air pollutants level in 2020.
The concentration of pollutants showed a further decrease in their daily average concentration during the early stages of the post-lockdown (1st June to 31st August). The effect of lockdown coupled with substantial monsoon rainfall, the contribution of clean air from the Bay of Bengal and Arabian Sea, and little input from brick kilns and biomass burning might be the reason behind such a drop (Arif et al., 2018). The diagrams also reveal a gradual increase in the deterioration of air quality from October onwards due to the relaxation in lockdown, the emergence of the winter season, prevailing westerly wind, and other anthropogenic factors that sum up to degrade air quality during the late phase of lockdown.
3. 2 Spatial Variation
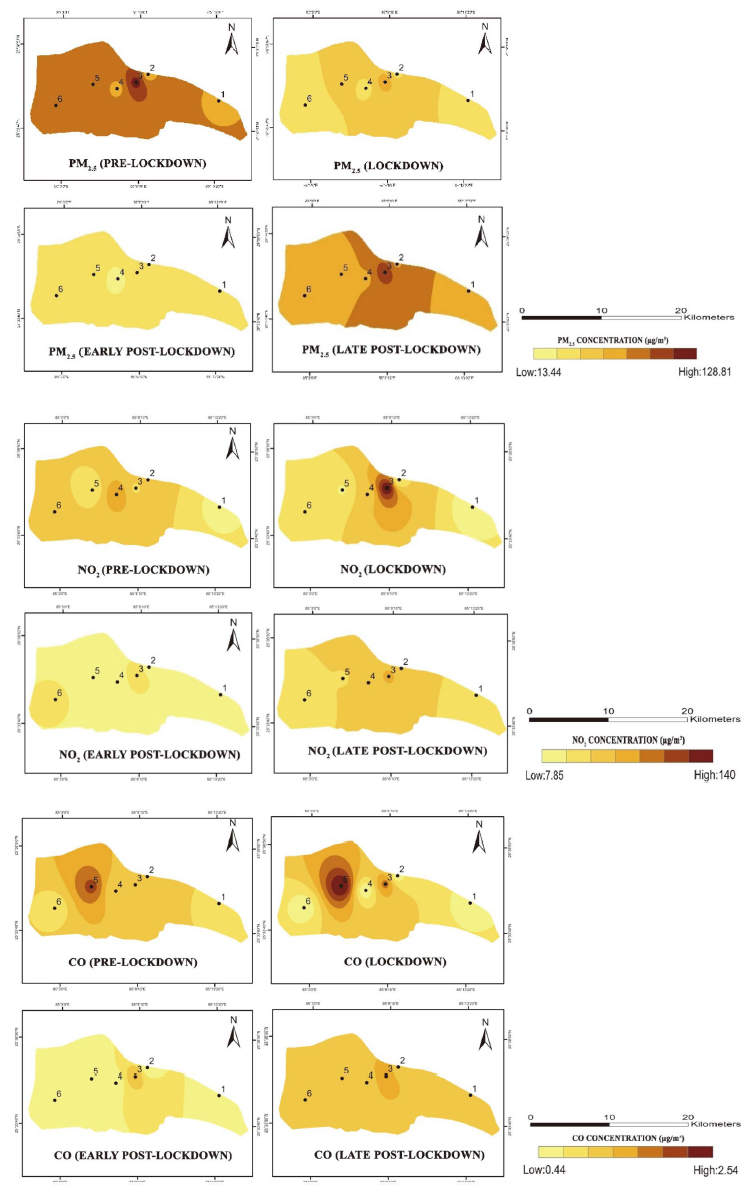
Fig. 4 depicts the spatial variation of different air pollutants in the study area. PM2.5 showed a significant reduction during the lockdown phase at nearly every sampling site in the city. During the first week of lockdown, it was reduced to 47.22% from the pre-lockdown level. NO2, on the other hand, has recorded maximum reduction of 63.18% within seven days since lockdown, suggesting restrictions on transport and other anthropogenic activities have played an essential role in lowering their concentrations. The concentration of NO2 and CO was found to be greater at site 3 during the lockdown phase than that of the pre-lockdown phase, which might be due to biomass burning (Beig et al., 2020; Biswal et al., 2020; Ravindra et al., 2020) for household purposes by the population residing in two densely populated slum areas located near this monitoring site. An increase in NO2 levels during the early phases of post-lockdown, especially in the western and central pockets of the study area (Fig. 4) might be due to relaxation in transport activity. Towards the end of the year, an increase in air pollutants was noticed owing to various anthropogenic and natural factors. Spatial variation revealed that pollutants load prevailed mainly in the city’s central region during the entire study period. The result is confined to the pollutants including PM2.5, NO2, and CO; the rest do not vary very much or are excluded due to the unavailability of data for some phases.
3. 3 Statistical Correlation between Air Pollutants
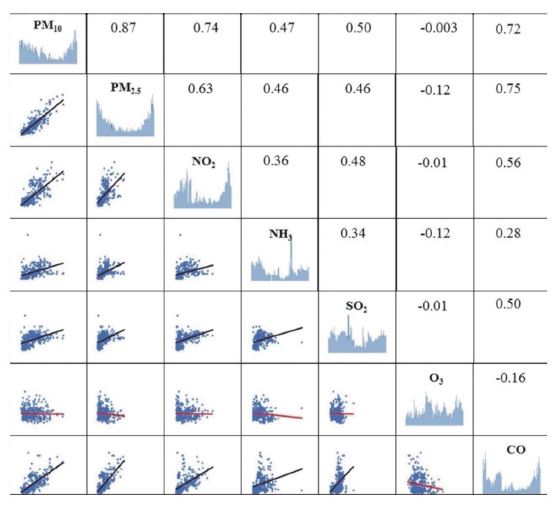
Correlation between different air pollutants was computed for the study period (Fig. 5). The correlation analysis revealed the daily average concentration of PM10 to be very strongly correlated with PM2.5 (r=0.87), which suggests they both contribute to the air from common sources. PM10 and PM2.5 showed moderate correlation with NH3 (r=0.47; r=0.46), indicating a favorable role of ammonia conversion from gas to particle phase in particulate matter formation (Wang et al., 2015). The correlation of particulate matter with NO2 (r10=0.74, r2.5=0.63) and SO2 (r10=0.50, r2.5=0.46) suggests the presence of secondary pollutants generated by the photochemical reaction of gaseous pollutants mainly SO2 and NO2 (CARB, 2021; Botkin and Keller, 2000; Xu et al., 2020a). O3 showed a negative correlation with all other pollutants, predominantly with PM2.5, and NH3 during our study period and similar findings were also observed by Kumari and Toshniwal, 2020; Mahato et al., 2020; Sharma et al., 2020; Xu et al., 2020b.
3. 4 Comparison of Air Pollutants between 2019 and 2020
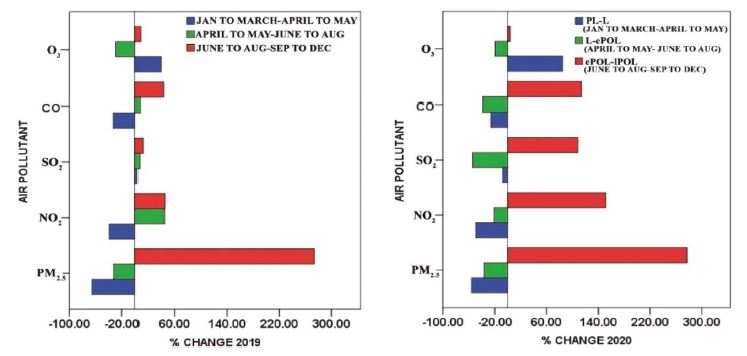
A comprehensive comparison of the concentration of five air pollutants (PM2.5, NO2, SO2, CO, O3) during pre-lockdown, lockdown and different phases of post-lockdown in the year 2020 was made with corresponding period in the year 2019 (Fig. 6). The result revealed that a significant impact of lockdown is noticeable when the deviation was evaluated from lockdown to early stages of post-lockdown (from 1st June 2020 to 31st August 2020). In 2020, all the air pollutants showed a negative % change where the maximum reduction was observed for SO2 that has decreased from 8.79 μg/m3 to 4.05 μg/m3 (53.95%) in 2020, followed by CO (38.57%), PM2.5 (36.38%), NO2 (20.82%) and O3 (19.37%). Compared with the previous year’s data, the monthly average concentration of NO2, SO2, CO was indeed higher during the same time (Fig. 6). Nearing the end of the study period, air pollutants have remarkably shown an increase in their concentration for both years. However, air pollutants have come across a more tremendous % increase in the year 2020 compared to 2019. The monthly average concentration of PM2.5 has been maximum during the late phase of post-lockdown, which was noted at 88.70 μg/m3 in 2020 and 139.35 μg/m3 in 2019. Similarly, NO2 has increased from 17.26 μg/m3 to 43.42 μg/m3 in the year 2020 and from 21.53 μg/m3 to 31.23 μg/m3 in the corresponding period of the year 2019. 43.18% and 113.70% increase can also be noticeable for CO in 2019 and 2020 respectively (Fig. 6). An increase in the concentration of these pollutants during this phase might be due to the lowering of mixing layer height hindering the complete dispersion of pollutants (Guttikunda and Jawahar, 2014), winter inversion (Mahato et al., 2020; Mishra and Kulshrestha, 2020). Increase in biomass burning during winter that contributes 18-30% of the total concentration level during winter (PCAAP, 2019), burning of crackers during festive and marriage occasions at the tail end of the year (Mahato et al., 2020; Chauhan and Singh, 2017) also increase the concentration of pollutants. Besides these factors, high biomass residue burning in Northwest countries and the Northern regions of India sums up with dust aerosol from the west during winter and pre-monsoon (Srivastava et al., 2020; Arif et al., 2018), resumption of brick manufacturing during winter and pre-monsoon period and westerly air mass coming from Indo-Gangetic Plain resulted in a comparatively elevated level of PM2.5 and PM10 during winters (Agarwal et al., 2020; Singh and Chauhan, 2020; Arif et al., 2018).
3. 5 Aqi Interpretation
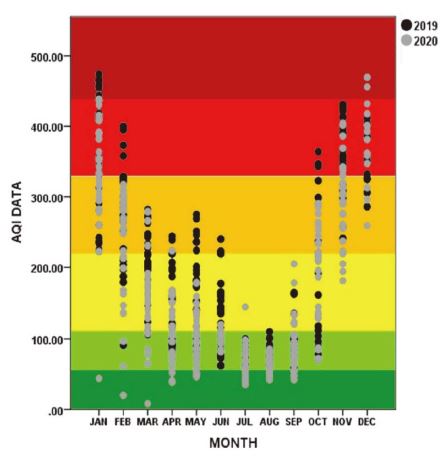
Fig. 7 shows changes in the monthly average AQI value from 1st January to 15th December for 2019 and 2020. Since the beginning of the year, the air quality has improved slightly compared to the previous year. However, compared to the AQI value for the same period in 2019, the most significant drop in the AQI value in 2020 occurs from April to June. The AQI value ranged from 30 to 224 in 2020, peaking at 275 in 2019 with a 30.91% decline in the average AQI value during the lockdown period. The AQI value remained in a good to the moderately polluted zone during the lockdown and early post-lockdown phases that were in the poor category last year (Fig. 7). Compared to 2019, the AQI value this year has declined by 57.88% from pre-lockdown to lockdown, which was recorded as 47.57%. Such a drop in the AQI values in the pandemic and early stages of post-pandemic phases again justifies our discussion that the implementation of lockdown was a powerful reason for the changes observed in the air quality this year.
4. CONCLUSION
The main focus of the study was to investigate the influence of emission reductions due to restrictions on transportation, industrial and various anthropogenic contributors of air pollutants on the air quality of Patna during the COVID-19 lockdown and also to examine the changes in air pollutants levels throughout the year. The study concludes that the implementation of lockdown certainly had a significant positive impact on improving the quality of the air in Patna. The pollutants that experienced maximum reduction during the lockdown period include particulate matter, NO2, and NH3. On the contrary, SO2 had not declined by much and O3 rose amid this period due to a drop in PM and NO2 levels. A higher pollution load was reported by spatial analysis in the central part of the city. The results also revealed a notable contribution of biomass burning to NO2 during the lockdown. A drop observed in the early stages of post-lockdown was due to the influence of the monsoon season and southerly wind. Together with the lockdown, the consequences have lowered the pollutant’s concentration even further to a greater extent than the previous year. In addition, the relaxation in pandemic restrictions and the impact of climatic conditions once again paved the way for an increase in these pollutants towards the end of the year. The study eventually concluded that the problem determining air quality is mainly anthropogenic. However, lockdown is not a permanent solution to expect improvement in water or air quality. Instead, it provides us with evidence that improvement in air quality can be achieved if proper measures are drafted/worked out in the existing regulatory plans and are implemented strictly by the concerned authorities in a phase-wise manner.
Acknowledgments
The authors declare that they have no known competing financial interests or personal relationships that could have influenced the work reported in this paper. The authors are thankful to members of the Environmental Biology Laboratory. This research did not receive any funding.
References
-
Acharya, P., Sreekesh, S. (2013) Seasonal variability in aerosol optical depth over India: A spatio-temporal analysis using the MODIS aerosol product. International Journal of Remote Sensing, 34, 4382-4849.
[https://doi.org/10.1080/01431161.2013.782114]

-
Agarwal, A., Kaushik, A., Kumar, S., Mishra, R.-K. (2020) Comparative study on air quality status in Indian and Chinese cities before and during the COVID-19 lockdown period. Air Quality, Atmosphere and Health, 13(10), 1167-1178.
[https://doi.org/10.1007/s11869-020-00881-z]

-
Amann, M., Purohit, P., Bhanarkar, A.-D., Bertok, I., Borken-Kleefeld, J., Cofala, J., Heyes, C., Kiesewetter, G., Klimont, Z., Liu, J., Majumdar, D. (2017) Managing future air quality in megacities: A case study for Delhi. Atmospheric Environment, 161, 99-111.
[https://doi.org/10.1016/j.atmosenv.2017.04.041]

-
Ambade, B., Sankar, T.-K., Kumar, A., Gautam, A.-S., Gautam, S. (2021) COVID-19 lockdowns reduce the Black carbon and polycyclic aromatic hydrocarbons of the Asian atmosphere: Source apportionment and health hazard evaluation. Environment, Development and Sustainability, 23, 12252-12271.
[https://doi.org/10.1007/s10668-020-01167-1]

- ARAI and TERI (Automotive Research Association of India and The Energy and Resources Institute) (2018) Source Apportionment of PM2.5 & PM10 Concentrations of Delhi NCR for Identification of Major Sources, The Energy and Resources Institute (August). https://www.araiindia.com
-
Arif, M., Kumar, R., Kumar, R., Eric, Z., Gourav, P. (2018) Ambient black carbon, PM2.5 and PM10 at Patna: Influence of anthropogenic emissions and brick kilns. Science of the Total Environment, 624, 1387-1400.
[https://doi.org/10.1016/j.scitotenv.2017.12.227]

-
Arif, M., Parveen, S. (2021) Carcinogenic effects of indoor black carbon and particulate matters (PM2.5 and PM10) in rural households of India. Environmental Science and Pollution Research, 28, 2082-2096.
[https://doi.org/10.1007/s11356-020-10668-5]

-
Baldasano, J.-M. (2020) COVID-19 lockdown effects on air quality by NO2 in the cities of Barcelona and Madrid (Spain). Science of the Total Environment, 741(2), 140353.
[https://doi.org/10.1016/j.scitotenv.2020.140353]

-
Barzeghar, V., Sarbakhsh, P., Hassanvand, M.-S., Faridi, S., Gholampour, A. (2020) Long-term trend of ambient air PM10, PM2.5, and O3 and their health effects in Tabriz city, Iran, during 2006-2017. Sustainable Cities and Society, 54, 101988.
[https://doi.org/10.1016/j.scs.2019.101988]

-
Bedi, J.-S., Dhaka, P., Vijay, D., Aulakh, R.-S., Gill, J.P.-S. (2020) Assessment of air quality changes in the four metropolitan cities of India during COVID-19 pandemic lockdown. Aerosol and Air Quality Research, 20(10), 2062-2070.
[https://doi.org/10.4209/aaqr.2020.05.0209]

-
Beig, G., Sahu, S.-K., Singh, V., Tikle, S., Sobhana, S.-B., Gargeva, P., Ramakrishna, K., Rathod, A., Murthy, B.-S. (2020) Objective evaluation of stubble emission of North India and quantifying its impact on air quality of Delhi. Science of the Total Environment, 709, 136126.
[https://doi.org/10.1016/j.scitotenv.2019.136126]

-
Biswal, A., Singh, T., Singh, V., Ravindra, K., Mor, S. (2020) COVID-19 lockdown and its impact on tropospheric NO2 concentrations over India using satellite-based data. Heliyon, 6(9), e04764.
[https://doi.org/10.1016/j.heliyon.2020.e04764]

- Botkin, B.D., Keller, E.A. (2000) Environmental science, Earth as a living Planet.
- CARB (California Air Resources Board)(2021) Inhalable Particulate Matter and Health (PM2.5 and PM10), Calfornia Air Resources Board. https://ww2.arb.ca.gov/resources/inhalable-particulate-matter-and-health
-
Chauhan, A., Singh, R.-P. (2017) Poor air quality and dense haze/smog during 2016 in the indo-gangetic plains associated with the crop residue burning and diwali festival. International Geoscience and Remote Sensing Symposium (IGARSS), 2017, 6048-6051.
[https://doi.org/10.1109/IGARSS.2017.8128389]

- CPCB (Central Pollution Control Board) (2014) National Air Quality Index, Central Pollution Control Board, (January), 1-44.
-
Dantas, G., Siciliano, B., França, B.-B., da Silva, C.-M., Arbilla, G. (2020) The impact of COVID-19 partial lockdown on the air quality of the city of Rio de Janeiro, Brazil. Science of the Total Environment, 729, 139085.
[https://doi.org/10.1016/j.scitotenv.2020.139085]

-
Farren, N.-J., Davison, J., Rose, R.-A., Wagner, R.-L., Carslaw, D.-C. (2020) Underestimated Ammonia Emissions from Road Vehicles. Environmental Science & Technology, 54, 15689-15697.
[https://doi.org/10.1021/acs.est.0c05839]

-
Filonchyk, M., Hurynovich, V. (2020) Validation of MODIS Aerosol Products with AERONET Measurements of Different Land Cover Types in Areas over Eastern Europe and China. Journal of Geovisualization and Spatial Analysis, 4, 10.
[https://doi.org/10.1007/s41651-020-00052-9]

-
Gautam, S. (2020) The Influence of COVID-19 on Air Quality in India: A Boon or Inutile. Bulletin of Environmental Contamination and Toxicology, 104(6), 724-726.
[https://doi.org/10.1007/s00128-020-02877-y]

-
Gour, A.-A., Singh, S.-K., Tyagi, S.-K., Mandal, A. (2015) Variation in parameters of ambient air quality in National Capital Territory (NCT) of Delhi (India). Atmospheric and Climate Sciences, 5(1), 13-22.
[https://doi.org/10.4236/acs.2015.51002]

-
Gulia, S., Mittal, A., Khare, M. (2018) Quantitative evaluation of source interventions for urban air quality improvement - A case study of Delhi city. Atmospheric Pollution Research, 9(3), 577-583.
[https://doi.org/10.1016/j.apr.2017.12.003]

-
Guo, H., Kota, S.-H., Sahu, S.-K., Hu, J., Ying, Q., Gao, A., Zhang, H. (2017) Source apportionment of PM2.5 in North India using source-oriented air quality models. Environmental Pollution, 231, 426-436.
[https://doi.org/10.1016/j.envpol.2017.08.016]

-
Guo, H., Kota, S.-H., Sahu, S.-K., Zhang, H. (2019) Contributions of local and regional sources to PM2.5 and its health effects in north India. Atmospheric Environment, 214, 116867.
[https://doi.org/10.1016/j.atmosenv.2019.116867]

- Guttikunda, S.-K., Jawahar, P. (2014) Characterizing Patna’s ambient air quality and assessing opportunities for policy intervention. UrbanEmissions. Info, New Delhi, India.
-
Guttikunda, S.-K., Nishadh, K.-A., Jawahar, P. (2019) Air pollution knowledge assessments (APnA) for 20 Indian cities. Urban Climate, 27, 124-141.
[https://doi.org/10.1016/j.uclim.2018.11.005]

-
Hama, S.-M., Kumar, P., Harrison, R.-M., Bloss, W.-J., Khare, M., Mishra, S., Namdeo, A., Sokhi, R., Goodman, P., Sharma, C. (2020) Four-year assessment of ambient particulate matter and trace gases in the Delhi-NCR region of India. Sustainable Cities and Society, 54, 102003.
[https://doi.org/10.1016/j.scs.2019.102003]

-
Hashim, B.-M., Al-Naseri, S.-K., Al-Maliki, A., Al-Ansari, N. (2021) Impact of COVID-19 lockdown on NO2, O3, PM2.5 and PM10 concentrations and assessing air quality changes in Baghdad, Iraq. Science of the Total Environment, 754(2), 141978.
[https://doi.org/10.1016/j.scitotenv.2020.141978]

-
He, G., Pan, Y., Tanaka, T. (2020) The short-term impacts of COVID-19 lockdown on urban air pollution in China. Nature Sustainability, 3, 1005-1011.
[https://doi.org/10.1038/s41893-020-0581-y]

- HEI & IHME (Health Effects Institute & Institute for Health Metrics and Evaluation) (2020) State of Global Air 2020. https://www.stateofglobalair.org/resources
- IQ Air (2020) World’s Most Polluted Cities in 2020 - PM2.5 Ranking | AirVisual (iqair.com). https://www.iqair.com/world-most-polluted-cities
-
Jain, S., Sharma, S.-K., Srivastava, M.-K., Chaterjee, A., Singh, R.-K., Saxena, M., Mandal, T.-K. (2019) Source apportionment of PM10 over three tropical urban atmospheres at indogangetic plain of India: an approach using different receptor models. Archives of Environmental Contamination and Toxicology, 76(1), 114-128.
[https://doi.org/10.1007/s00244-018-0572-4]

-
Jain, S., Sharma, T. (2020) Social and travel lockdown impact considering coronavirus disease (COVID-19) on air quality in megacities of India: Present benefits, future challenges and way forward. Aerosol and Air Quality Research, 20(6), 1222-1236.
[https://doi.org/10.4209/aaqr.2020.04.0171]

- Joshi, H. (2019) Mining and Brick Kilns Hasten Ganga’s Shift From Patna. The Wire. https://thewire.in/environment/mining-and-brick-kilns-hasten-gangas-shift-from-patna
-
Kanawade, V.-P., Srivastava, A.-K., Ram, K., Asmi, E., Vakkari, V., Soni, V.-K., Varaprasad, V., Sarangi, C. (2020) What caused severe air pollution episode of November 2016 in New Delhi?. Atmospheric Environment, 222, 117125.
[https://doi.org/10.1016/j.atmosenv.2019.117125]

-
Kotnala, G., Mandal, T.-K., Sharma, S.-K., Kotnala, R.-K. (2020) Emergence of blue sky over Delhi due to Coronavirus disease (COVID-19) lockdown implications. Aerosol Science and Engineering, 4, 228-238.
[https://doi.org/10.1007/s41810-020-00062-6]

-
Kumar, A., Yadav, I.-C., Shukla, A., Devi, N.-L. (2020a) Seasonal variation of PM2.5 in the central Indo-Gangetic Plain (Patna) of India: chemical characterization and source assessment. SN Applied Sciences, 2(8), 1-13.
[https://doi.org/10.1007/s42452-020-3160-y]

-
Kumar, P., Hama, S., Omidvarborna, H., Sharma, A., Sahani, J., Abhijith, K.-V., Debele, S.-E., Zavala-Reyes, J.-C., Barwise, Y., Tiwari, A. (2020b) Temporary reduction in fine particulate matter due to ‘anthropogenic emissions switch-off’ during COVID-19 lockdown in Indian cities. Sustainable Cities and Society, 62, 102382.
[https://doi.org/10.1016/j.scs.2020.102382]

-
Kumari, P., Toshniwal, D. (2020) Impact of lockdown measures during COVID-19 on air quality - A case study of India. International Journal of Environmental Health Research, (May), 1-22.
[https://doi.org/10.1080/09603123.2020.1778646]

-
Lepeule, J., Laden, F., Dockery, D., Schwartz, J. (2012) Chronic exposure to fine particles and mortality: An extended follow-up of the Harvard six cities study from 1974 to 2009. Environmental Health Perspectives, 120(7), 965-970.
[https://doi.org/10.1289/ehp.1104660]

-
Li, S., Lang, J., Zhou, Y., Liang, X., Chen, D., Wei, P. (2020) Trends in ammonia emissions from light-duty gasoline vehicles in China, 1999-2017. Science of The Total Environment, 700, 134359.
[https://doi.org/10.1016/j.scitotenv.2019.134359]

-
Lokhandwala, S., Gautam, P. (2020) Indirect impact of COVID-19 on environment: A brief study in Indian context. Environmental Research, 188, 109807.
[https://doi.org/10.1016/j.envres.2020.109807]

-
Mahato, S., Pal, S., Ghosh, K.-G. (2020) Effect of lockdown amid COVID-19 pandemic on air quality of the megacity Delhi, India. Science of the Total Environment, 730, 1-58.
[https://doi.org/10.1016/j.scitotenv.2020.139086]

-
Mesas-Carrascosa, F.-J., Porras, F.-P., Triviño-Tarradas, P., GarcíaFerrer, A., Meroño-Larriva, J.-E. (2020) Effect of lockdown measures on atmospheric nitrogen dioxide during SARS-CoV-2 in Spain. Remote Sensing, 12(14), 2210.
[https://doi.org/10.3390/rs12142210]

-
Mhawish, A., Banerjee, T., Sorek-Hamer, M., Bilal, M., Lyapustin, A.-I., Chatfield, R., Broday, D.-M. (2020) Estimation of high-resolution PM2.5 over the indo-gangetic plain by fusion of satellite data, meteorology, and land use variables. Environmental Science & Technology, 54(13), 7891-7900.
[https://doi.org/10.1021/acs.est.0c01769]

-
Mishra, M., Kulshrestha, U.-C. (2020) Extreme air pollution events spiking ionic levels at urban and rural sites of indogangetic plain. Aerosol and Air Quality Research, 20(6), 1266-1281.
[https://doi.org/10.4209/aaqr.2019.12.0622]

-
Navinya, C., Patidar, G., Phuleria, H.-C. (2020) Examining effects of the COVID-19 national lockdown on ambient air quality across urban India. Aerosol and Air Quality Research, 20(8), 1759-1771.
[https://doi.org/10.4209/aaqr.2020.05.0256]

-
Ngarambe, J., Joen, S.-J., Han, C.-H., Yun, G.-Y. (2021) Exploring the relationship between particulate matter, CO, SO2, NO2, O3 and urban heat island in Seoul, Korea. Journal of Hazardous Materials, 403, 123615.
[https://doi.org/10.1016/j.jhazmat.2020.123615]

-
Ojha, N., Sharma, A., Kumar, M., Girach, I., Ansari, T.-U., Sharma, S.-K., Singh, N., Pozzer, A., Gunthe, S.-S. (2020) On the widespread enhancement in fine particulate matter across the Indo-Gangetic Plain towards winter. Scientific Reports, 10(1), 1-9.
[https://doi.org/10.1038/s41598-020-62710-8]

-
Pandey, A., Venkataraman, C. (2014) Estimating emissions from the Indian transport sector with on-road fleet composition and traffic volume. Atmospheric Environment, 98, 123-133.
[https://doi.org/10.1016/j.atmosenv.2014.08.039]

- PCAAP (Patna Clean Air Action Plan) (2019) Comprehensive Clean Air Action Plan For The City of Patna.
-
Rajbhandari, B., Phuyal, N., Shrestha, B., Thapa, M. (2020) Air medical evacuation of nepalese citizen during epidemic of COVID-19 from Wuhan to Nepal. Journal of the Nepal Medical Association, 58(222), 125-133.
[https://doi.org/10.31729/jnma.4857]

-
Ravindra, K., Singh, T., Pandey, V., Mor, S. (2020) Air pollution trend in Chandigarh city situated in Indo-Gangetic Plains: Understanding seasonality and impact of mitigation strategies. Science of the Total Environment, 729, 138717.
[https://doi.org/10.1016/j.scitotenv.2020.138717]

-
Ravindra, K., Singh, T., Biswal, A., Singh, V., Mor, S. (2021) Impact of COVID-19 lockdown on ambient air quality in megacities of India and implication for air pollution control strategies. Environmental Science and Pollution Research, 28(17), 21621-21632.
[https://doi.org/10.1007/s11356-020-11808-7]

-
Sahoo, P.-K., Mangla, S., Pathak, A.-K., Salãmao, G.-N., Sarkar, D. (2021) Pre-to-post lockdown impact on air quality and the role of environmental factors in spreading the COVID-19 cases-a study from a worst-hit state of India. International Journal of Biometeorology, 65(2), 205-222.
[https://doi.org/10.1007/s00484-020-02019-3]

-
Sarkar, S., Singh, R.-P., Chauhan, A. (2018) Crop Residue Burning in Northern India: Increasing Threat to Greater India. Journal of Geophysical Research: Atmospheres, 123(13), 6920-6934.
[https://doi.org/10.1029/2018JD028428]

-
Sarkar, S., Chauhan, A., Kumar, R., Singh, R.-P. (2019) Impact of Deadly Dust Storms (May 2018) on Air Quality, Meteorological, and Atmospheric Parameters Over the Northern Parts of India. GeoHealth, 3(3), 67-80.
[https://doi.org/10.1029/2018GH000170]

-
Sathe, Y., Gupta, P., Bawase, M., Lamsal, L., Patadia, F., Thipse, S. (2021) Surface and satellite observations of air pollution in India during COVID-19 lockdown: Implication to air quality. Sustainable Cities and Society, 66, 102688.
[https://doi.org/10.1016/j.scs.2020.102688]

-
Saud, T., Gautam, R., Mandal, T.-K., Gadi, R., Singh, D.-P., Sharma, S.-K., Dahiya, M., Saxena, M. (2012) Emission estimates of organic and elemental carbon from household biomass fuel used over the Indo-Gangetic Plain (IGP), India. Atmospheric Environment, 61, 212-220.
[https://doi.org/10.1016/j.atmosenv.2012.07.030]

-
Sen, A., Karapurkar, S.-G., Saxena, M., Shenoy, D.-M., Chaterjee, A., Choudhuri, A.-K., Das, T., Khan, A.-H., Kuniyal, J.-C., Pal, S., Singh, D.-P. (2018) Stable carbon and nitrogen isotopic composition of PM10 over Indo-Gangetic Plains (IGP), adjoining regions and Indo-Himalayan Range (IHR) during a winter 2014 campaign. Environmental Science and Pollution Research, 25(26), 26279-26296.
[https://doi.org/10.1007/s11356-018-2567-0]

-
Sharma, S., Zhang, M., Anshika, Gao, J., Zhang, H., Kota, S.-H. (2020a) Effect of restricted emissions during COVID-19 on air quality in India. Science of the Total Environment, 728, 1-9.
[https://doi.org/10.1016/j.scitotenv.2020.138878]

-
Sharma, S.-K., Mandal, T.-K., Srivastava, M.-K., Chatterjee, A., Jain, S., Saxena, M., Singh, B.-P., Sharma, A., Adak, A., Ghosh, S.-K. (2016) Spatio-temporal variation in chemical characteristics of PM10 over indo Gangetic plain of India. Environmental Science and Pollution Research, 23(18), 18809-18822.
[https://doi.org/10.1007/s11356-016-7025-2]

-
Shastri, H., Barik, B., Ghosh, S., Venkataraman, C., Sadavarte, P. (2017) Flip flop of Day-night and Summer-Winter Surface Urban Heat Island Intensity in India. Scientific Reports, 7, 40178.
[https://doi.org/10.1038/srep40178]

-
Shen, F., Ge, X., Hu, J., Nie, D., Tian, L., Chen, M. (2017) Air pollution characteristics and health risks in Henan Province, China. Environmental Research, 156, 625-634.
[https://doi.org/10.1016/j.envres.2017.04.026]

-
Shukla, K., Kumar, P., Mann, G.-S., Khare, M. (2020) Mapping spatial distribution of particulate matter using Kriging and Inverse Distance Weighting at supersites of megacity Delhi. Sustainable Cities and Society, 54, 101997.
[https://doi.org/10.1016/j.scs.2019.101997]

-
Singh, R.-P., Chauhan, A. (2020) Impact of lockdown on air quality in India during COVID-19 pandemic, Air Quality. Atmosphere and Health, 13(8), 921-928.
[https://doi.org/10.1007/s11869-020-00863-1]

-
Singh, N., Banerjee, T., Murari, V., Deboudt, K., Khan, M.-F., Singh, R.-S., Latif, M.-T. (2021) Insights into size-segregated particulate chemistry and sources in urban environment over central Indo-Gangetic Plain. Chemosphere, 263, 128030.
[https://doi.org/10.1016/j.chemosphere.2020.128030]

-
Srivastava, S., Kumar, A., Bauddh, K., Gautam, A.-S., Kumar, S. (2020) 21-Day Lockdown in India Dramatically Reduced Air Pollution Indices in Lucknow and New Delhi, India. Bulletin of Environmental Contamination and Toxicology, 105(1), 9-17.
[https://doi.org/10.1007/s00128-020-02895-w]

-
Stanaway, J.-D., Afshin, A., Gakidou, E., Lim, S.-S., Abate, D., Abate, K.-H., Abbafati, C., Abbasi, N., Abbastabar, H., Abd-Allah, F., Abdela, J. (2018) Global, regional, and national comparative risk assessment of 84 behavioural, environmental and occupational, and metabolic risks or clusters of risks for 195 countries and territories, 1990-2017: a systematic analysis for the Global Burden of Disease Study 2017. The Lancet, 392(10159), 1923-1994.
[https://doi.org/10.1016/S0140-6736(18)32225-6]

-
Tobías, A., Carnerero, C., Reche, C., Massagué, J., Via, M., Minguillón, M.-C., Alastuey, A., Querol, X. (2020) Changes in air quality during the lockdown in Barcelona (Spain) one month into the SARS-CoV-2 epidemic. Science of the Total Environment, 726, 138540.
[https://doi.org/10.1016/j.scitotenv.2020.138540]

-
Venkataraman, C., Brauer, M., Tibrewal, K., Sadavarte, P., Ma, Q., Cohen, A., Chaliyakunnel, S., Frostad, J., Klimont, Z., Martin, R.-V., Millet, D.-B. (2018) Source influence on emission pathways and ambient PM2.5 pollution over India (2015-2050). Atmospheric Chemistry and Physics, 18 (12), 8017-8039.
[https://doi.org/10.5194/acp-18-8017-2018]

-
Wang, P., Chen, K., Zhu, S., Wang, P., Zhang, H. (2020) Severe air pollution events not avoided by reduced anthropogenic activities during COVID-19 outbreak. Resources, Conservation and Recycling, 158, 104814.
[https://doi.org/10.1016/j.resconrec.2020.104814]

-
Wang, S., Nan, J., Shi, C., Fu, Q., Gao, S., Wang, D., Cui, H., Saiz-Lopez, A., Zhou, B. (2015) Atmospheric ammonia and its impacts on regional air quality over the megacity of Shanghai, China. Scientific Reports, 5, 15842.
[https://doi.org/10.1038/srep15842]

- WHO (World Health Organization) (2020) Coronavirus disease (COVID-2019) situation reports, World Health Organisation.
- WHO (World Health Organization) (2020a) Coronavirus Disease 2019 (COVID-19) Situation Report-36, February 25, 2020, World Health Organization Geneva. https://www.who.int/docs/default-source/coronaviruse/situationreports/20200225-sitrep-36-covid-19.pdf?sfvrsn=2791b4e0_2
-
Xu, K., Cui, K., Young, L.-H., Hsieh, Y.-K., Wang, Y.-F., Zhang, J., Wan, S. (2020a) Impact of the COVID-19 event on air quality in central China. Aerosol and Air Quality Research, 20, 915-929.
[https://doi.org/10.4209/aaqr.2020.04.0150]

-
Xu, K., Cui, K., Young, L.-H., Wang, Y.-F., Hsieh, Y.-K., Wan, S., Zhang, J. (2020b) Air quality index, indicatory air pollutants and impact of covid-19 event on the air quality near central China. Aerosol and Air Quality Research, 20(6), 1204-1221.
[https://doi.org/10.4209/aaqr.2020.04.0139]

-
Xue, R., Wang, S., Li, D., Zou, Z., Chan, K.-L., Valks, P., SaizLopez, A., Zhou, B. (2020) Spatio-temporal variations in NO2 and SO2 over Shanghai and Chongming Eco-Island measured by Ozone Monitoring Instrument (OMI) during 2008-2017. Journal of Cleaner Production, 258, 120563.
[https://doi.org/10.1016/j.jclepro.2020.120563]

-
Yoo, J.-M., Lee, Y.-R., Kim, D., Jeong, M.-J., Stockwell, W.-R., Kundu, P.-K., Oh, S.-M., Shin, D.-B., Lee, S.-J. (2014) New indices for wet scavenging of air pollutants (O3, CO, NO2, SO2, and PM10) by summertime rain. Atmospheric Environment, 82(2), 226-237.
[https://doi.org/10.1016/j.atmosenv.2013.10.022]

-
Zhang, L., Wang, B., Zhou, J., Kirkpatrick, J., Xie, M., Johri, A.-M. (2020) Bedside Focused Cardiac Ultrasound in COVID-19 from the Wuhan Epicenter: The Role of Cardiac Point-of-Care Ultrasound, Limited Transthoracic Echocardiography, and Critical Care Echocardiography. Journal of the American Society of Echocardiography, 33(6), 676-682.
[https://doi.org/10.1016/j.echo.2020.04.004]

-
Zhu, N., Zhang, D., Wang, W., Li, X., Yang, B., Song, J., Zhao, X., Huang, B., Shi, W., Lu, R., Niu, P. (2020) A Novel Coronavirus from Patients with Pneumonia in China, 2019. New England Journal of Medicine, 382, 727-733.
[https://doi.org/10.1056/NEJMoa2001017]


