Effect of the Eruption of Nishinoshima Volcano in the Summer of 2020 on Air Quality in Fukuoka and Busan
Copyright © 2022 by Asian Association for Atmospheric Environment
This is an open-access article distributed under the terms of the Creative Commons Attribution Non-Commercial License (http://creativecommons.org/licenses/by-nc/4.0/), which permits unrestricted non-commercial use, distribution, and reproduction in any medium, provided the original work is properly cited.
Abstract
A thick foggy weather and worst visibility in Fukuoka, Japan and Busan, South Korea occurred from the late July to early August 2020 due to the Nishinoshima volcanic eruption. In this study, an intensive measurement was made to clarify the chemical nature of the ambient particulate matter (PM) and rain water collected in Fukuoka and Busan during the Nishinoshima volcanic eruption (episode period) and non-eruption (non-episode period). In this study, one week after volcanic eruption, which recorded the usual PM concentration, was defined as the non-episode period. Compared to non-episode period, the PM2.5 concentration during the episode period increased 4.32 times in Busan and 6.03 times in Fukuoka. The sulfur and chlorine concentrations in the total suspended particles (TSP) and rainwater of episode period were particularly higher than those of non-episode period. The sulfate concentration in PM2.5 was 1.81 and 27.98 μg/m3 in non-episode and episode periods, respectively. The sulfate concentration during the episode period accounted for 55.4% of PM2.5 (50.45 μg/m3). Strong correlation between trace elements in TSP and those in rainwater during the episode period indicates that the volcanic ashes could be incorporated into raindrops.
Keywords:
Nishinoshima, Volcanic eruption, PM10, PM2.5, SO2, Sulfate1. INTRODUCTION
In Kyushu, Japan, a thick smog was observed unusually in many areas from late July to early August 2020. During this period, due to foggy weather, the visibility has dropped to around 7 km in most Kyushu regions. During this period, the concentration of ambient PM was also recorded as a fairly high concentration.
In spring, visibility is often bad due to the influx of Asian dust storm and PM from China, but it is rarely common to get worse in summer. Furthermore, this unusual phenomenon also occurred in Busan, South Korea close to Kyushu during the same period.
According to the research groups of Fukuoka University and Yamanashi University, the reason of the high concentration of PM in Kyushu was the volcanic eruption of Nishinoshima (The fukudaism on Aug. 7, 2020). They reported that a ground observation showed a significant increase in the concentrations of PM2.5 and sulfur dioxide (SO2). PM2.5 refers to particles that have diameter less than 2.5 micrometres and remain suspended in the air for a long time. Furthermore, the observations by the Light Detection And Ranging (LIDAR) installed at Fukuoka University showed that PM2.5 was increasing near the surface of the earth (at an altitude of less than 2 km). Many aspherical particles that are considered mineral particles were also observed (The fukudaism on Aug. 7, 2020).
Japan is one of the countries with many volcanoes in the world and has suffered many volcanic disasters in the past. According to the Japan Meteorological Agency (JMA), which is always focused on observing volcanic activity with the volcano observation system nationwide, there were 110 active volcanoes in Japan (Yamasato, 2005).
One of the most active volcanoes in Japan recently is Nishinoshima (27°14′49″N, 140°52′28″E). It is located in the Pacific Ocean (Fig. 1), about 1,000 km from Tokyo and 130 km from Chichijima. It belongs to the Shichijima-Iwo Jima ridge, which is the same geographical elevation as the Iwo-Jima Islands, and undersea volcanic activity of Nishinoshima is active in the vicinity. Before the eruption, Nishinoshima was a small island of the area of 0.29 km2 and elevation of 25 m, however after several large-scale eruptions its main body had a huge edifice rising 4,000 m from the sea floor and a diameter of 30 km.
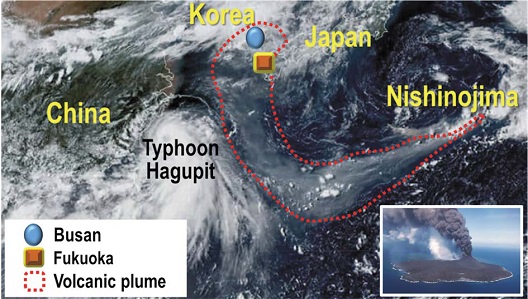
The plumes of the Nisinojoshima volcano (27°14′49″N, 140°52′28″E), and volcanic eruptions (bottom right) on Aug. 4.
Generally, volcanic gas contains usually hot water vapor, but its components also contain several acidic gases like carbon dioxide (CO2), SO2, hydrogen sulfide (H2S), hydrogen chloride (HCl), and hydrogen fluoride (HF). These gases can be attached to volcanic ash during the eruption or generate secondary PM while floating in the atmosphere (Gilbert et al., 1991).
Volcanic ash may have different health hazards compared to general ambient PM. Since Horton and McCaldin’s first report in 1964, many researchers have reported on the health hazards of volcanic ash (Forbes et al., 2003; Buist et al., 1983; Craighead et al., 1983). The irritation of the lining of the airways by fine volcanic PM can cause cough, breathlessness, chest tightness, and wheezing (Horwell and Baxter, 2006). Moreover, the electrical charges of volcanic PM may affect reactions in the lung (Williamson et al., 2001).
This article focused on clarifying the chemical nature of ambient PM and rain water collected in Fukuoka and Busan during the Nishinoshima volcanic eruption.
2. MATERIALS AND METHODS
2. 1 Monitored Data
The one-hour interval data of PM2.5 and PM10 in Fukuoka and Busan were subject to evaluation. They were measured at the air quality monitoring stations (AQMSs) of the Kashii (33°40′22″N, 130°26′18″E), Fukuoka and the Sinhang (35°07′45″N, 128°83′43″E), Busan, respectively from Aug. 1 to Aug. 15, 2020. The two AQMSs are the closest among other Fukuoka and Busan AQMSs with a straight distance of 215 km.
2. 2 Collection of TSP and Rain Water
To clarify the chemical properties of the PM related to volcanic eruption, the TSP samples were collected during the volcanic eruption (on Aug. 6) and non-eruption (on Sep. 1) periods, respectively. The ambient TSP was collected using a one-stage filter pack sampler equipped with quartz filter (47 mm in diameter).
Moreover, the precipitations fell during the volcanic eruption (on Aug. 7) and the period unrelated to the volcanic eruption (on Sep. 2) were collected. Rainwater was collected using a glass pluviometer (Toyo Co., 8065) consisted of reservoir basket, reservoir bottle, and body. Prior to sampling, this pluviometer was cleaned with 1,1,1-trichloroethane.
The samplings of TSP and rainwater were carried out on the rooftop of a four-story building (a height of 15 m above ground level) (33°40′N, 130°26′E) at Fukuoka Women’s University in Fukuoka City. It is located about 400 meters away from the Kashii AQMS.
2. 3 Pretreatment and Analysis of TSP and Rainwater
Before analyzing, the agitated rainwater samples were passed through a nylon filter (Gelman, Nylasorb) with 5 μm pore size, to remove impurities. A solution of HNO2 mixed with H2O2 was employed in digesting of TSP and rainwater samples in microwave digestion system.
The elemental concentrations of TSP and rainwater were determined by an Inductively Coupled Plasma Mass Spectrometry (ICP-MS) (Agelint technologies Co., Agelint 7700 Series). Digested liquid samples are introduced into the carrier gas (argon) by a nebulizer. The analyte ions are transported by the argon and focused by a series of ion lenses into a quadrupole mass analyzer; the ions are then separated as a function of their mass/charge ratio.
3. RESULTS AND DISCUSSION
3.1 Volcanic Gas Captured by Satellites
Fig. 1 shows the plumes of the Nishinoshima volcano, and volcanic eruptions (bottom right) on Aug. 4. This satellite’s photograph was taken by the Japanese weather satellite, Himawari-8 and provided by the CIRA/RAMMB/Japan Meteorological Agency (ZDNet Korea, 2020). According to the satellite’s image, after the volcanic eruption, the volcanic plume flowed southwest at first. Then, the Nishinoshima’s volcanic plume flowed into the Korean Strait between Busan and Fukuoka by the Typhoon Hagupit that was moving strongly northward at that time.
Fig. 2 shows the volcanic SO2 moving detected by the Support to Aviation Control Service (SACS) multi-sensors system (three verticals on the left). The SACS hosted by the Royal Belgian Institute for Space Aeronomy (BIRA-IASB) and initiated by the European Space Agency (ESA) (https://sacs.aeronomie.be/). As shown in Fig. 2, the distribution of SO2 was also consistent with the volcanic plume shown in Fig. 1.
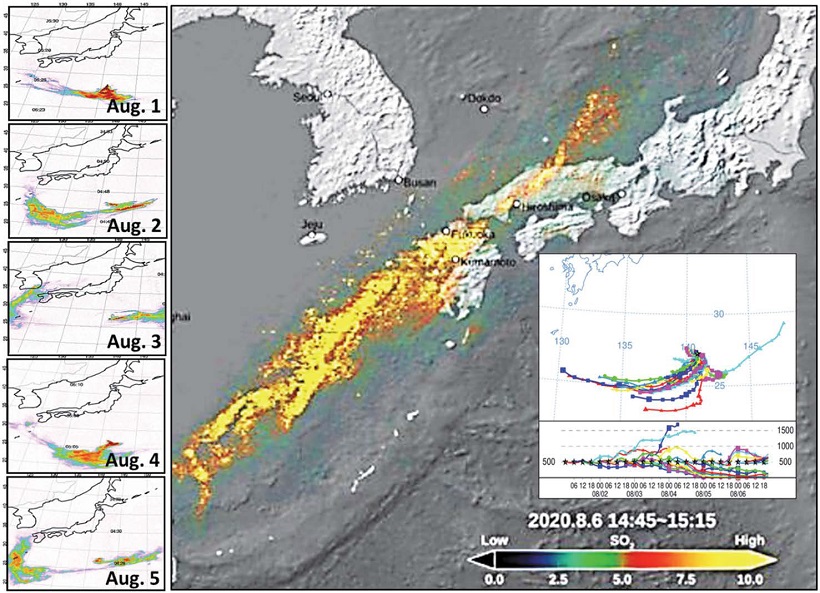
The volcanic SO2 moving detected by the Support to Aviation Control Service (SACS) multi-sensors system (five verticals on the left) and the Chollian Satellite 2B (right) with the HYSPLIT forward trajectories.
The Chollian Satellite 2B, which went into space to observe Korea’s air quality, also detected volcanic SO2 from Nishinoshima coming near the Korean Peninsula (right side of Fig. 2) (Asian economy on Nov. 18, 2020).
The result of the NOAA’s HYSPLIT (https://www.arl.noaa.gov) forward trajectories at 500, 1,000, 1,500 m altitudes for 3 days from Aug. 2 was also displayed in Fig. 2. The result of forward trajectories also confirms the path of volcanic SO2 moving.
Figs. 1 and 2 show that the Nishinoshima volcanic gas was passing through the volcanic area of Kyushu and Okinawa. Therefore, it was possible that the volcanic gas generated from Kyushu Okinawa joined the flow of the Nishinoshima’s volcanic plume toward Fukuoka and Busan. Mori et al. (2013) reported that Sakurajima and Suwanosejima volcanoes located in Kyushu and Okinawa emitted more than 100 ton/day of SO2 throughout their 32-year study period.
3. 2 Variations of PM10 and PM2.5 in Fukuoka and Busan
Fig. 3 shows the hourly variations of PM10 and PM2.5 measured in Fukuoka and Busan from Aug. 1 to 15. In both cities, PM concentrations increased sharply from Aug. 2, and high concentrations continued until Aug. 7. During the high concentration period, relatively higher PM concentrations were observed in Fukuoka than in Busan. The reason is that Fukuoka, which is relatively close to Nishinoshima, was more affected. On Aug. 4, there was little difference in PM concentrations between Fukuoka and Busan due to the increase in PM concentration in Busan. The increase in PM in Busan on this day might have been due to temporary local emissions in addition to the impact of the Nishinoshima eruption.
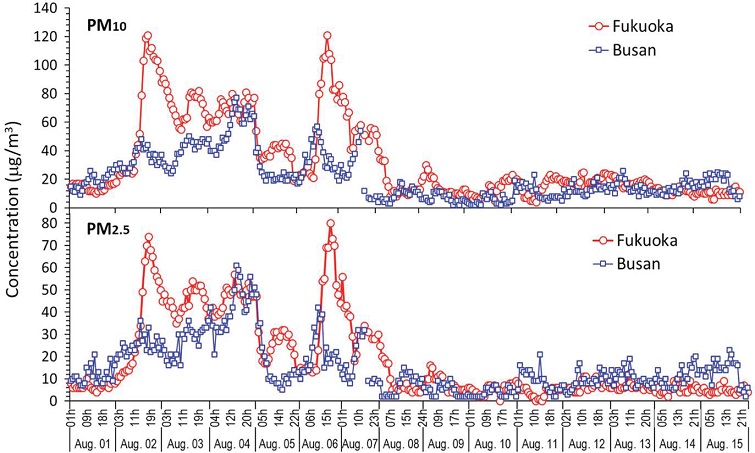
Hourly variations of PM10 (top) and PM2.5 (bottom) measured in Fukuoka (Kashii) and Busan (Sinhang) from Aug. 1 to 15.
In Busan, the average concentrations of PM2.5 during the episode period and non-episode period were 31.5 μg/m3 and 7.3 μg/m3 respectively. Meanwhile, their concentrations in Fukuoka were observed at 37.8 μg/m3 and 6.3 μg/m3 respectively. Compared to non-episode period, the PM2.5 concentration during the episode period increased 4.32 times in Busan and 6.03 times in Fukuoka.
There are reports that the SO2 half-life extends from 1.9 to 69 hours (Lusis et al., 1978; Mezaros et al., 1977). Thus, the episodically high SO2 concentration over the Korean Strait (Fig. 2) could be affected by volcanic SO2 dispersion. In addition, this SO2 formed secondary particles, resulting in a significant increase in the concentration of PM2.5 in the two cities.
Like PM2.5, in the case of PM10, its concentration of Busan and Fukuoka was higher during the episode period than non-episode period, but the amount of increase (3.35 times in Busan and 4.07 times in Fukuoka) was lower than that of PM2.5.
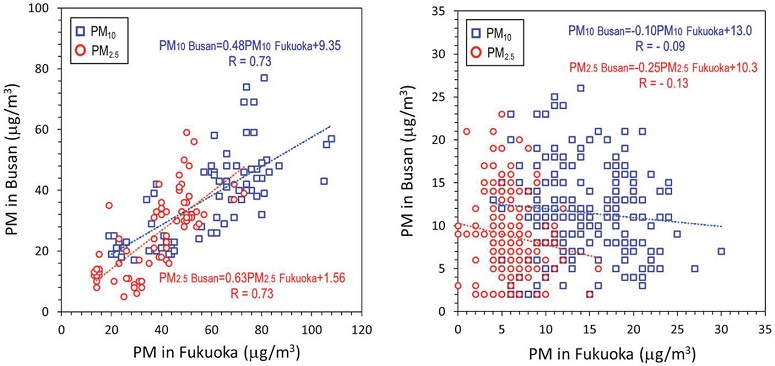
The correlations between Fukuoka and Busan for the hourly measured PM2.5 and PM10 during episode and non-episode periods were shown in Fig. 4. While there was no correlation during non-episode, the correlation coefficients (R) between the two regions for both PM10 and PM2.5 during the episode period were high with R-value of 0.73. This result tells us that, during the episode period, both regions were affected by volcanic eruptions at the same time, resulting in increased concentrations of PM2.5 and PM10. Meanwhile, during the non-episode period (the period of background PM concentration) from Aug. 8 to 15, both regions were only influenced by their local emission sources, but there were no other effects such as volcanic eruption and Asian Continent.
3. 3 Elemental Concentration of the TSP and Rain Collected at Fukuoka
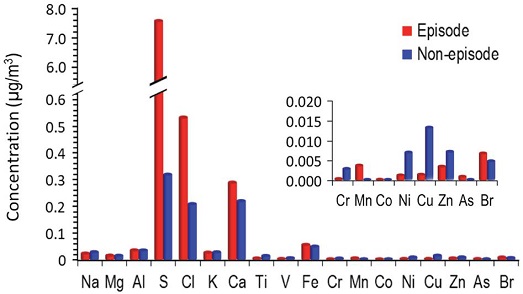
Fig. 5 shows the elemental concentration of the TSP collected at Fukuoka on episode and non-episode days. Compared to the sulfur concentration with 0.3 μg/m3 on non-episode day, that of episode day increased to 7.5 μg/m3. The concentration of chlorine also increased by about 2.6 times on the episode day. Volcanic gases are generally mostly water vapor, but they also include CO2, SO2, H2S, HCl, and HF (Textor, 2003). These gaseous components adhere to volcanic ash during eruption.
Among trace elemental components, Mn and Br were found relatively high on the episode day. Mn is one of the main components of volcanic ashes. Gerlach (2004) reported that for arc volcanoes, halogen emissions were represented by about 0.84% HCl, 0.061% HF, 0.0025% HBr.
Meanwhile, the concentration of some trace heavy metals, including Cu and Zn, was rather high on the non-episode day (Sep. 1). It is known that these heavy metals are mostly emitted from lubricant oil, brake linings, and tire wear of poorly maintained old vehicles (Shah et al., 2012). Depending on the wind direction, it may be said that the trace elements of the TSP collected on the non-episode day might have been affected by roads and/or automobiles because the Kashii sampling site is adjacent to the urban highway and National Route 3.
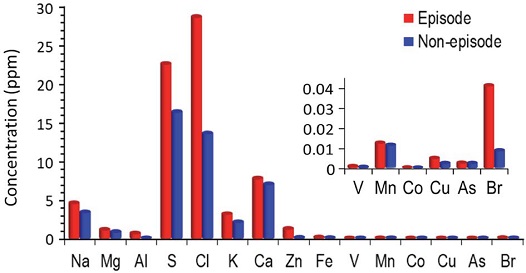
Fig. 6 shows the elemental concentrations of the rains collected at Fukuoka on the episode and non-episode days. The elemental components of rainwater collected in both periods also showed the similar results as TSP, i.e., S, Cl, Mn, and Br showed significantly higher concentrations during the episode than non-episode period.
Fig. 7 shows the regression scatter plot of the trace elements in TSP versus those in rain measured in Fukuoka during episode. The correlation was evaluated only for trace elements, excluding the major components detected regardless of volcanoes. As shown in Fig. 7, a very high correlation has been proven between the water-insoluble trace elements of two samples, i.e., rainwater and TSP. This suggests that despite the water-insoluble volcanic particles containing trace elements, they were effectively removed from the atmosphere by rainfall.
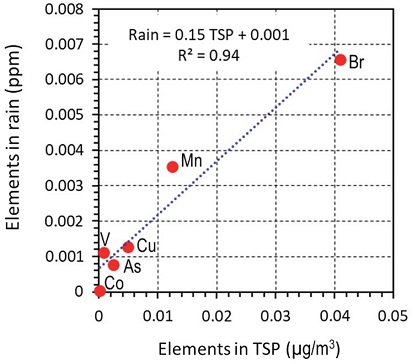
Regression scatter plot of the trace elements in TSP versus those in rain measured in Fukuoka during episode.
The water-insoluble fresh volcanic particles can be turned hydrophilic by a large amount of water vapor that erupts at the same time (Horwell et al., 2003). Even if they do not turn into hydrophilic, they are often coated with water soluble compounds during an elevation to high altitude or a long-distance transportation. Finally, they can act as cloud condensation nuclei (CCN) and can be incorporated into raindrops below the cloud base.
3. 4 Ionic and Carbonaceous Components in PM2.5 Measured in Busan
Fig. 8 shows the ionic and carbonaceous components in PM2.5, and PM2.5 mass concentration measured in Busan (Sinhang) on the episode (Aug. 4) and non-episode (Aug. 8) days.
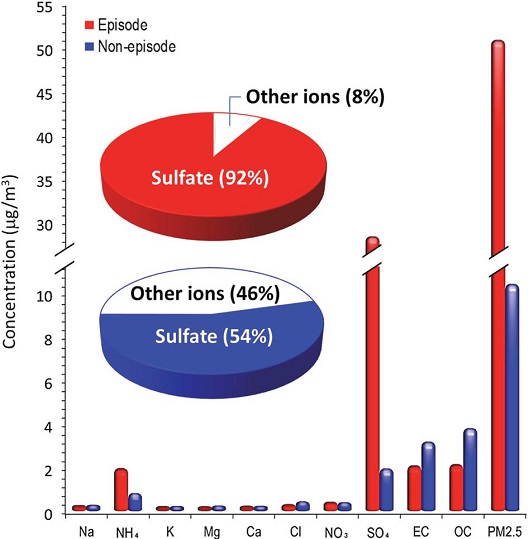
Ionic species and carbonaceous components in PM2.5, and PM2.5 mass concentration measured in Busan (Sinhang) on episode (volcano eruption) (Aug. 4) and non-episode (Aug. 8).
Among the ionic components, ammonium and sulfate were detected relatively high during the episode day. Ammonium recorded 1.8 μg/m3 on the episode day, which is 2.7 times higher than that on non-episode (0.7 μg/m3) day. Meanwhile, sulfate concentration was 1.81 and 27.98 μg/m3 on non-episode and episode days, respectively. During the episode day, sulfate accounted for as much as 92% of all ions as shown in the pie chart inside Fig. 8. This sulfate concentration (28.0 μg/m3) accounted for 55.4% of PM2.5 (50.5 μg/m3).
Aritonang et al. (2018) reported that the volcanic gas of Mount Merapi in Indonesia contained about 0.3% NH3. Therefore, ammonium and sulfate ions, which were detected relatively abundantly in the PM2.5 on the episode period in this study, might be originated from the secondary particles which were chemically formed by the volcanic ammonia and sulfur dioxide. And as mentioned earlier, sulfuric acid adsorbed from the gases in the volcanic plume (Gilbert et al., 1991) can be present on the surface of PM. Therefore, this might also be one of the reasons for the high content rate of sulfate in PM2.5 in this study.
Volcanic sulfur-bearing gases (mainly SO2, H2S, and COS) have an impact on the climate of the Earth’s lower atmosphere or troposphere because they form sulfate aerosols that increase the reflection of incoming solar radiation (Rap et al., 2013).
Although it is not the main purpose of this paper, the enormously increased sulfate particles during the episode period (15 times higher than non-episode) would have temporarily given Busan and Fukuoka a local cooling effect.
4. CONCLUSIONS
In this study, the chemical properties of atmospheric PM and rainwater collected during the period of abnormally thick fog and worst visibility due to the volcanic eruption of Nishinoshima were evaluated. According to the results of this study, it can be concluded that in addition to the artificial and natural PM of the Asian continent that always affect East Asian air quality, the unexpected influx of volcanic plume from far away Pacific islands has become a new factor in East Asian air quality. Therefore, appropriate measures and solutions for volcanic PM that are much more harmful to health than general atmospheric PM should also be taken in the receptor areas. In addition, as revealed in this study, the studies on the effect of volcanic PM with unusually high sulfuric components on local cooling effect should also be conducted.
Acknowledgments
The data of AQMSs in Kashiii and Sinhang published online by the Environment Department of Fukuoka Prefecture and the Busan Institute of Health/Environment, respectively, were a great reference of the data discussion in this study. The model results of both the Support to Aviation Control Service (SACS) and the Chollian Satellite 2B were very helpful to data interpretation. The forward trajectory developed and proffered by the National Oceanic Atmospheric Administration (NOAA) was very helpful to data interpretation.
References
-
Aritonang, C., Gloria, E., Lawoto, J., Ridwan, P. (2018) Characteristics and consequences of volcanic gas from Mount Merapi towards human health and the surrounding environment. AIP Conference Proceedings, 1987, 020032.
[https://doi.org/10.1063/1.5047317]

- Asian Economy, https://view.asiae.co.kr/article, , Visited on November 18, 2020.
- Buist, A.S., Johnson, L.R., Vollmer, W.M., Sexton, G.J., Kanarek, P.H. (1983) Acute effects of volcanic ash from Mount Saint Helens on lung function in children. The American Review of Respiratory Disease, 127, 714-719.
- Craighead, J.E., Adler, K.B., Butler, G.B., Emerson, R.J., Mossman, B.T., Woodworth, C.D. (1983) Health effects of Mount St. Helens volcanic dust. Laboratory Investigation, 48, 5-12.
-
Forbes, L., Jarvis, D., Potts, J., Baxter, P.J. (2003) Volcanic ash and respiratory symptoms in children on the island of Montserrat, British West Indies. Occupational and Environmental Medicine, 60, 207-211.
[https://doi.org/10.1136/oem.60.3.207]

-
Gerlach, T.M. (2004) Volcanic sources of tropospheric ozone-depleting trace gases. Geochemistry, Geophysics, Geosystems, 5, Q09007.
[https://doi.org/10.1029/2004GC000747]

-
Gilbert, J.S., Lane, S.J., Sparks, R.S.J., Koyaguchi, T. (1991) Charge measurements on particle fallout from a volcanic plume. Nature, 349, 598-600.
[https://doi.org/10.1038/349598a0]

-
Horton, R.J.M., McCaldin, R.O. (1964) Observations on air pollution aspects of Irazu volcano, Costa Rica. Public Health Reports, 79, 925-929.
[https://doi.org/10.2307/4592281]

-
Horwell, C.J., Baxter, P.J. (2006) The respiratory health hazards of volcanic ash: a review for volcanic risk mitigation. Bulletin of Volcanology, 69, 1-24.
[https://doi.org/10.1007/s00445-006-0052-y]

-
Horwell, C.J., Fenoglio, I., Ragnarsdottir, K.V., Sparks, R.S.J., Fubini, B. (2003) Surface reactivity of volcanic ash from the eruption of Soufrière Hills volcano, Montserrat, with implications for health hazards. Environmental Research, 93, 202-215.
[https://doi.org/10.1016/S0013-9351(03)00044-6]

-
Lusis, M.A., Anlauf, K.G., Barrie, L.A., Wiebe, H.A. (1978) Plume chemistry studies at a northern Alberta power plant. Atmospheric Environment, 12, 2429-2437.
[https://doi.org/10.1016/0004-6981(78)90287-1]

-
Mezaros, E., Moore, D.J., Lodge Jr., J.P. (1977) Sulfur dioxide-sulfate relationships in Budapest. Atmospheric Environment, 11, 345-351.
[https://doi.org/10.1016/0004-6981(77)90162-7]

-
Mori, T., Shinohara, H., Kazahaya, K., Hirabayashi, J.-i., Matsushima, T., Mori, T., Ohwada, M., Odai, M., Iino, H., Miyashita, M. (2013) Time-averaged SO2 fluxes of subduction-zone volcanoes: Example of a 32-year exhaustive survey for Japanese volcanoes. Journal of Geophysical Research: Atmospheres, 118, 8662-8674.
[https://doi.org/10.1002/jgrd.50591]

-
Rap, A., Scott, C.E., Spracklen, D.V., Bellouin, N., Forster, P.M., Carslaw, K.S., Schmidt, A., Mann, G. (2013) Natural aerosol direct and indirect radiative effects. Geophysical Research Letters, 40, 3297-3301.
[https://doi.org/10.1002/grl.50441]

-
Shah, M.H., Shaheen, N., Nazir, R. (2012) Assessment of the trace elements level in urban atmospheric particulate matter and source apportionment in Islamabad Pakistan. Atmospheric Pollution Research, 3, 39-45.
[https://doi.org/10.5094/APR.2012.003]

-
Textor, C. (2003) Injection of gases into the stratosphere by explosive volcanic eruptions. Journal of Geophysical Research, 108, 647.
[https://doi.org/10.1029/2002JD002987]

- The fukudaism, Smoke from Nishinoshima Eruption is the cause of the haze in early August in Kyushu region, Aug. 7, 2020 (in Japanese). https://www.fukuoka.ac.jp/fukudaism/coalition/20/08/15933.html
- The Support to Aviation Control Service (SACS) hosted by the Royal Belgian Institute for Space Aeronomy (BIRA-IASB) and initiated by the European Space Agency (ESA). https://sacs.aeronomie.be/, , Visited on November 13, 2020.
-
Williamson, B.J., Pastiroff, S., Cressey, G. (2001) Piezoelectric properties of quartz and cristobalite airborne particulates as a cause of adverse health effects. Atmospheric Environment, 35, 3539-3542.
[https://doi.org/10.1016/S1352-2310(01)00121-2]

- Yamasato, H. (2005) Modern history of volcano observation in Japan: Especially volcano surveillance of Japan Meteorological Agency. Bulletin of the Volcanological Society of Japan, 50, S7-S18, (in Japanese with English abstract).
- ZDNet Korea, Typhoon Hagupit and volcanic plume of Nishinoshima. https://zdnet.co.kr/view/?no=20200804084608

