Meteorological Factors Affecting Winter Particulate Air Pollution in Ulaanbaatar from 2008 to 2016
Copyright ⓒ 2018 by Asian Journal of Atmospheric Environment
This is an open-access article distributed under the terms of the Creative Commons Attribution Non-Commercial License (http://creativecommons.org/licenses/by-nc/4.0/), which permits unrestricted non-commercial use, distribution, and reproduction in any medium, provided the original work is properly cited.
Abstract
Ulaanbaatar, the capital of Mongolia, is subject to high levels of atmospheric pollution during winter, which severely threatens the health of the population. By analyzing surface meteorological data, ground-based LIDAR data, and radiosonde data collected from 2008 to 2016, we studied seasonal variations in particulate matter (PM) concentration, visibility, relative humidity, temperature inversion layer thickness, and temperature inversion intensity. PM concentrations started to exceed the 24-h average standard (50 μg/m3) in mid-October and peaked from December to January. Visibility showed a significant negative correlation with PM concentration. Relative humidity was within the range of 60-80% when there were high PM concentrations. Both temperature inversion layer thickness and intensity reached maxima in January and showed similar seasonal variations with respect to PM concentration. The monthly average temperature inversion intensity showed a strong positive correlation with the monthly average PM2.5 concentration. Furthermore, the temperature inversion layer thickness exceeded 500 m in midwinter and overlaid the weak mixed layer during daytime. Radiative cooling enhanced by the basin-like terrain led to a stable urban atmosphere, which strengthened particulate air pollution.
Keywords:
LIDAR, Mixed layer, Radiosonde, Temperature inversion layer, PM2.51. INTRODUCTION
Since the dissolution of the Soviet Union in the 1990s, Ulaanbaatar, the capital of Mongolia, has grown rapidly. Both population and urban functions are intensely concentrated in Ulaanbaatar (World Bank, 2010). The population of Ulaanbaatar exceeded 1.3 million in 2016, accounting for ~50% of the Mongolian population. The rapid growth of the population without the addition of sufficient urban infrastructure has caused both social and environmental problems (World Bank, 2009). Atmospheric pollution in winter is one of the most serious environmental problems threatening the health of its citizens, and has affected infant mortality in the last 10-15 years (Oyunchimeg and Burmaa, 2005).
Among cities that experience atmospheric pollution episodes, Ulaanbaatar is at a much higher latitude and experiences longer and colder winters. Moreover, as an inland city, Ulaanbaatar has unique topographic and geographic characteristics that provide suitable conditions for the formation of thick inversion layers in winter. Ulaanbaatar is located in a basin surrounded by mountains to the north and south, and the narrow urban area extends from east to west between the mountains (Fig. 1). Ger districts, consisting of gers (traditional Mongolian dwellings) and other dwellings made of brick or wood, are distributed mainly in the northern valleys and western suburbs around the urban area. These ger districts are considered to be the main source of particulate matter (PM) emissions in Ulaanbaatar. The number of gers and households in ger districts decreased from 1992 to 1996 due to the chaotic economy after the dissolution of the Soviet Union. However, an increasing number of people moved to the suburbs of Ulaanbaatar after 1997. This was driven in part by the urbanization of Ulaanbaatar, which provided more jobs and a better educational environment, as well as an increase in natural disasters (such as dzud in winter) in steppe and meadow areas, resulting in an explosive increase from 1997 to 2005. With the increasing population and number of gers, ger districts have spread over an increasingly wide area (Matsumiya, 2015; Amarsaikhan et al., 2009).
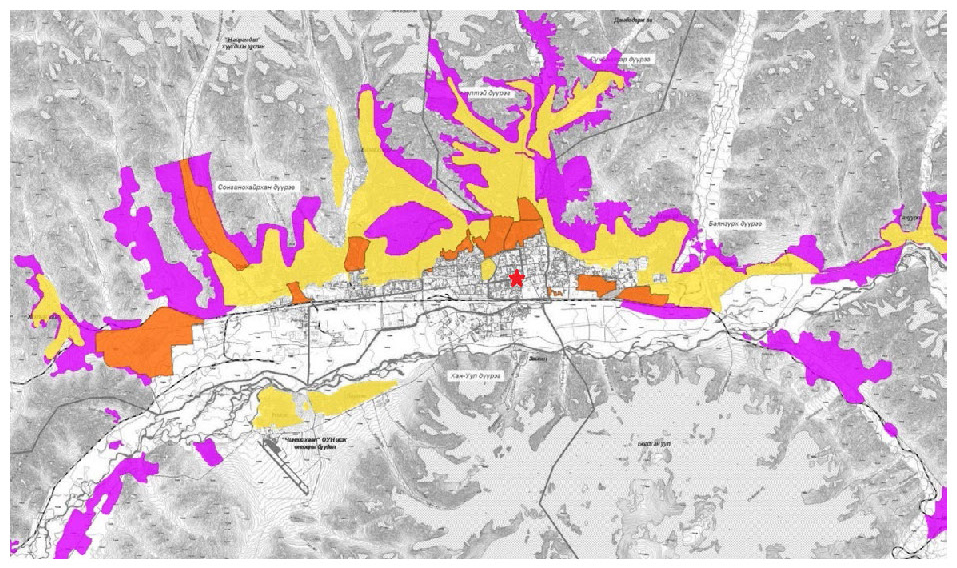
Map showing the distribution of the main urban area, central ger districts (orange zone), middle ger districts (yellow zone), and fringe ger districts (purple zone) in Ulaanbaatar. The red star indicates the location of the observation site (modified from Enkhbayar, 2014).
Vehicles represent another source of air pollutants and major threat to air quality in Ulaanbaatar. They influence the urban atmosphere not only via exhaust, but by disturbing soil and creating floating dust along roads, especially unpaved roads. Both the total number of vehicles and number of private cars have increased significantly in the past 25 years, most of which are used. Before 2005, approximately 74% of the vehicles in Ulaanbaatar were more than seven years old and 80% did not meet fuel consumption or emission standards (Nyamtseren, 2009; Abres et al., 2006). This has not changed in the past ten years, and the city government had to enact decrees to circumscribe the number of active vehicles by license number.
Although the problems caused by vehicles persist throughout the year, severe particulate air pollution in Ulaanbaatar only occurs in winter. Therefore, researchers and government officials must identify the main sources and formation mechanism of particulate air pollution to mitigate this problem. In our previous work, we clarified the occurrence of pollution, diurnal variation of wind, and seasonal variation in the atmospheric boundary layer in Ulaanbaatar in 2010 (Wang et al., 2017). However, the generalizability of the suppressed winter mixed layer with highly concentrated air pollutants capped by a thicker temperature inversion layer must be determined. Therefore, in this study, we investigated the seasonal variations in PM up to 2.5 μm in diameter (PM2.5), visibility, and temperature inversion by analyzing meteorological and radiosonde data. Furthermore, we compared the temperature inversion layer thickness and diurnal mixed layer height by analyzing National Institutes for Environmental Studies (NIES, Tsukuba, Japan) LIDAR data. This study aims to provide a scientific basis for understanding the unique characteristics of Ulaanbaatar and their effects on urban particulate air pollution in winter.
2. DATA AND METHODS
2. 1 Kosa Monitor, Radiosonde and Surface Meteorological Data
Surface PM2.5 and PM10 (PM up to 10 μm in diameter) data for Ulaanbaatar were collected with two aerosol monitors (E-SAMPLER; Met One Instruments, Inc., Rowlett, TX, USA) placed on top of the National Agency for Meteorology and Environment Monitoring of Mongolia (NAMEM) building as part of the Kosa monitor, which has been used in previous studies (Nishikawa et al., 2011). In addition to PM2.5 and PM10 data, the monitor also provides wind speed and direction and hourly visibility data (since March 2008). Because some PM10 data were missing from 2014 to 2016 due to a lack of maintenance, we chose March 2008 to April 2014 as the PM and visibility time series period.
The pressure, temperature, potential temperature, and wind direction in Ulaanbaatar were measured using a radiosonde at 47.9167°N and 106.8667°E at 00:00 and 12:00 UTC daily. The surface elevation of the location with a free radiosonde setting is 1313 m and the pressure at ground level usually ranges from 860 to 870 hPa. Both the radiosonde and surface meteorological data were measured at the Ulaanbaatar Meteorological Observatory and provided by NAMEM.
2. 2 Temperature Inversion Layer Thickness and Intensity Calculation
Our previous studies indicated that the urban inversion layer prevails throughout the day at sufficiently low surface air temperatures and relatively stable atmospheric conditions. To determine the inversion layer thickness, we checked the radiosonde data collected at 00:00 UTC (08:00 local standard time) and identified the temperature inversions.
To calculate the height from the pressure, we used a function derived from the hydrostatic equilibrium function dp= - ρgdz and the state equation of ideal gas p=ρRT:
from the temperature lapse rate γ=0.0065K/m, we get T=T0 - γz, yielding
Assuming that if z=0 then p=P0, and if z=h then p=P, by integrating the function through [0, h], we finally obtain
After inserting the value of constants and changing TK=TC+273.15, we obtain
Finally, we obtain the function we used in this study:
where P0 is the sea level pressure (1013.25 hPa), h0 is the surface elevation (1313 m), and P and T are the measured pressure and temperature at a specified height, respectively.
Days without temperature inversions or on which it did not start at ground level were excluded. In addition, if there were more than two layers of temperature inversion, the one starting from the ground level was recognized as the temperature inversion layer.
The temperature inversion layer is thicker than the diurnal mixed layer during winter in Ulaanbaatar. Since the monthly average surface inversion layer thickness calculated from our data does not exceeded 800 m, the height used to definite the temperature inversion intensity is also below 800 m. In our study, the temperature inversion intensity for all data with a valid temperature inversion layer thickness was defined as the quotient of the temperature inversion ΔT and the height at which the measured pressure was around 800 hPa (Δh800), which was usually 500-600 m.
2. 3 NIES LIDAR
To inspect the stability of the urban winter atmosphere, the NIES AD-net Mie-scattering LIDAR (Sugimoto et al., 2009) in the center of Ulaanbaatar was used. To discuss the diurnal development of the mixed and temperature inversion layers, we used the wavelet covariance transform method to define the mixed layer height based on the LIDAR profile. Details can be found in our previous work (Wang et al., 2017).
3. RESULTS
3. 1 Seasonal Variations in PM, Visibility, and Relative Humidity
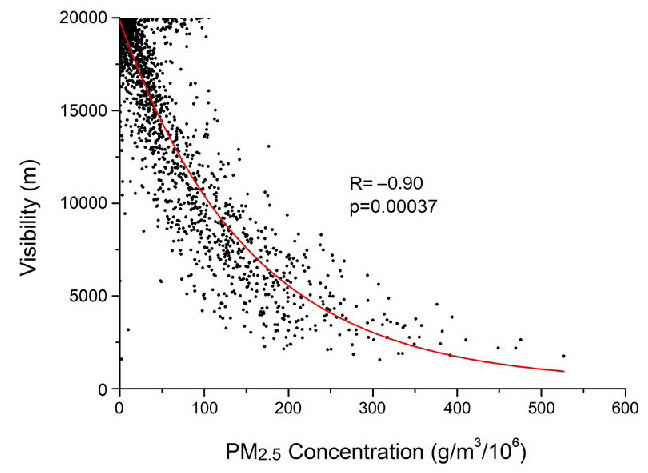
The daily average PM2.5, PM10, visibility, and relative humidity (RH) from March 2008 to April 2014 are shown in Fig. 2. All parameters showed significant seasonal variations. In the summer months (May-August), both PM2.5 and PM10 remained below the standard (<50 μg/m3; see blue line in Fig. 2) and visibility remained high (maximum: 20,000 m). When PM2.5 and PM10 began to exceed the 24-h average standard of 50 μg/m3 in October, the visibility started to decrease. The maximum PM2.5 and PM10 and minimum visibility (~2500 m) were measured between December and January. The RH decreased below 40% every spring (April-June), and surpassed 60% in summer and winter. The maximum RH in 2008, 2009, 2010, 2011, and 2013 exceeded 80%, which occurred in summer ( July-September). Although some data were missing because of a lack of measurements, a clear negative correlation between the variations in PM and visibility was observed. For instance, there was a strong (correlation coefficient: -0.90) significant (p=0.00037) correlation between visibility and PM2.5 concentration from March 2008 to April 2014 (Fig. 3).
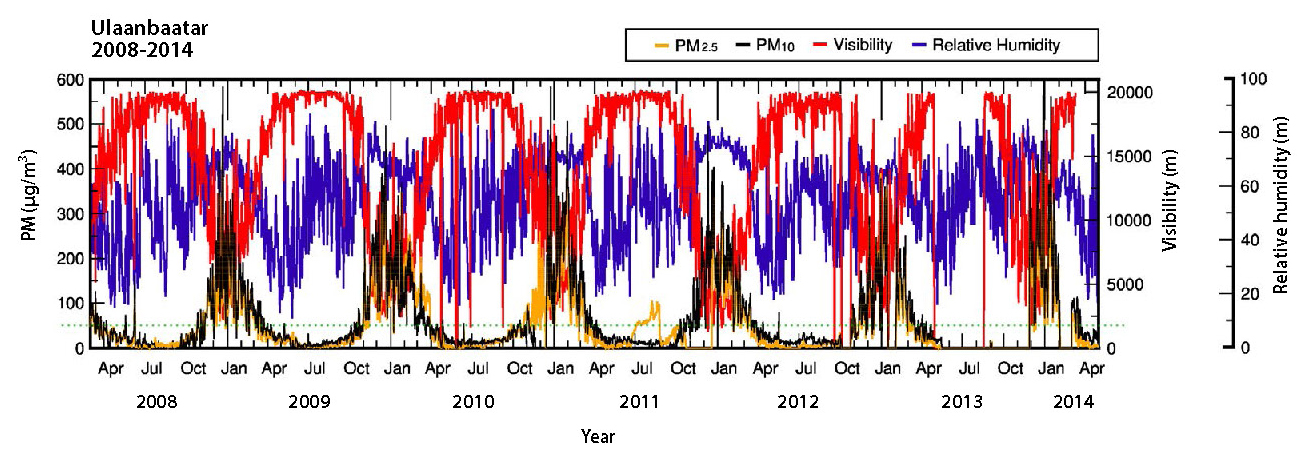
Time series of the daily average PM2.5 (orange), PM10 (black), visibility (red), and relative humidity (dark blue) from March 2008 to April 2014. The green dotted line represents the 24-h average standard air pollution (50 μg/m3) in Mongolia.
3. 2 Seasonal Variation in the Temperature Inversion Layer
Fig. 4 shows the vertical profile of the monthly average temperature in Ulaanbaatar during the four annual seasons. In January 2008, a temperature inversion from the surface to the height at which the pressure was about 815 hPa was observed, indicating that the monthly average thickness of the temperature inversion layer was ~550 m (Fig. 4a). The temperature inversion was more than 10°C, indicating that the atmosphere was very stable. Conversely, there was no temperature inversion in summer (e.g., July 2010) (Fig. 4c). During spring and autumn, the temperature inversion was relatively weak (Fig. 4b and d), with an inversion layer thickness less than 100 m and inversion intensity below 5°C. Thus, the urban atmosphere in Ulaanbaatar exhibits significant seasonality, which could be confirmed with the radiosonde data.
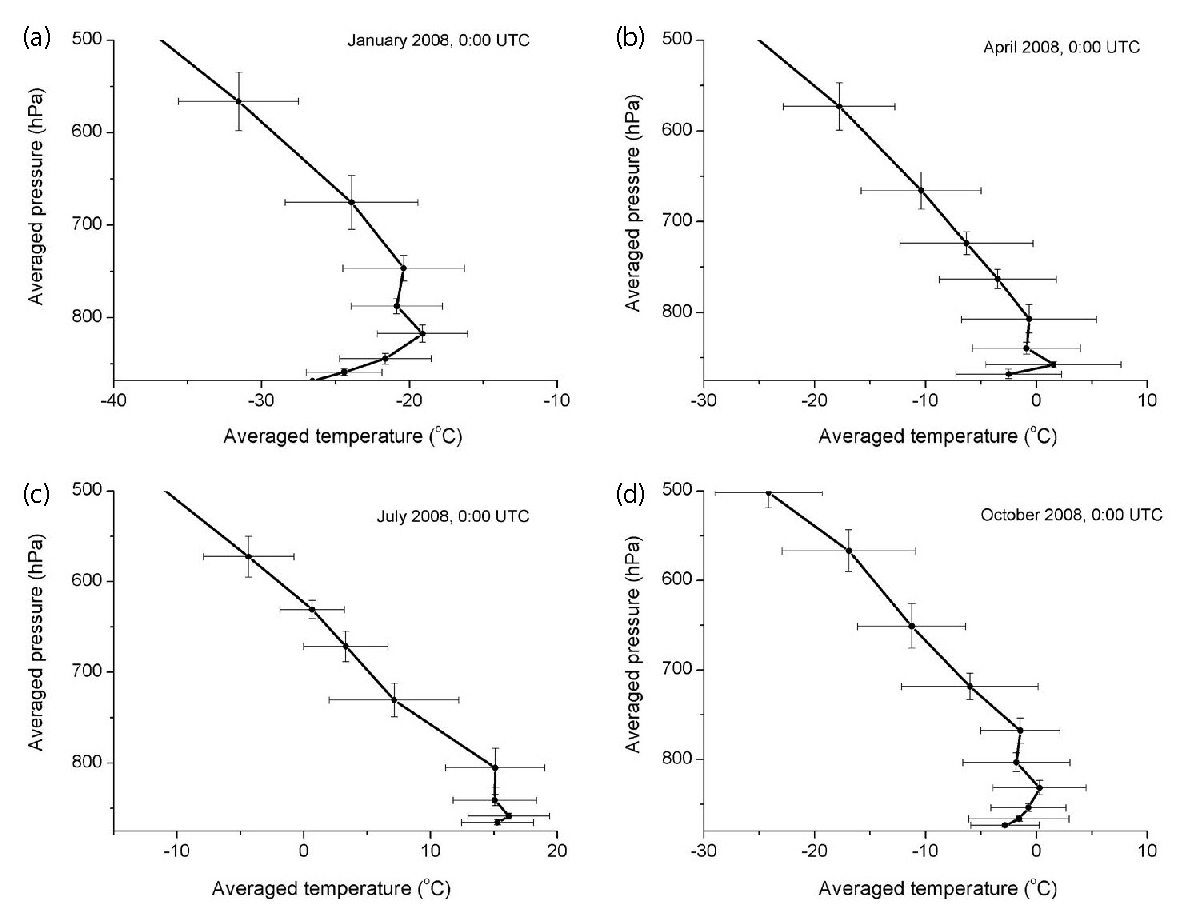
Vertical profile of the monthly mean air temperature measured at 00:00 UTC (08:00 LST) in (a) January 2008, (b) April 2008, (c) July 2008, and (d) October 2008
After calculating the monthly inversion layer thickness from the radiosonde data, we determined that the temperature inversion layer in Ulaanbaatar appeared in late September and lasted until the following early April. For the months of May to August, no temperature inversions occurred. This can be exemplified by the time series of the monthly mean temperature inversion layer height from 2008 to 2016 (Fig. 5a). Every year, the seasonal variation showed the same trend, with a maximum in December or January. The temperature inversion layer thickness increased until 2013 than after 2014. Based on the monthly mean data in Fig. 5a, we furthermore averaged the data of every September, October, …, April to elucidate the seasonal variation more clearly (Fig. 5b). Although the maximum appeared in December, the value for January highly similar as that in December. Overall, both the temperature inversion (ΔT) and inversion intensity showed significant seasonal variations, with the averaged value of temperature inversion exceeded 6°C and the averaged inversion intensity exceeded 0.011°C/m in December, January and February, and the values of all parameters reached the extremum during the period between December and January (Table 1). This seasonal variation had a strong influence on the surface particulate air pollution, as discussed in section 4.
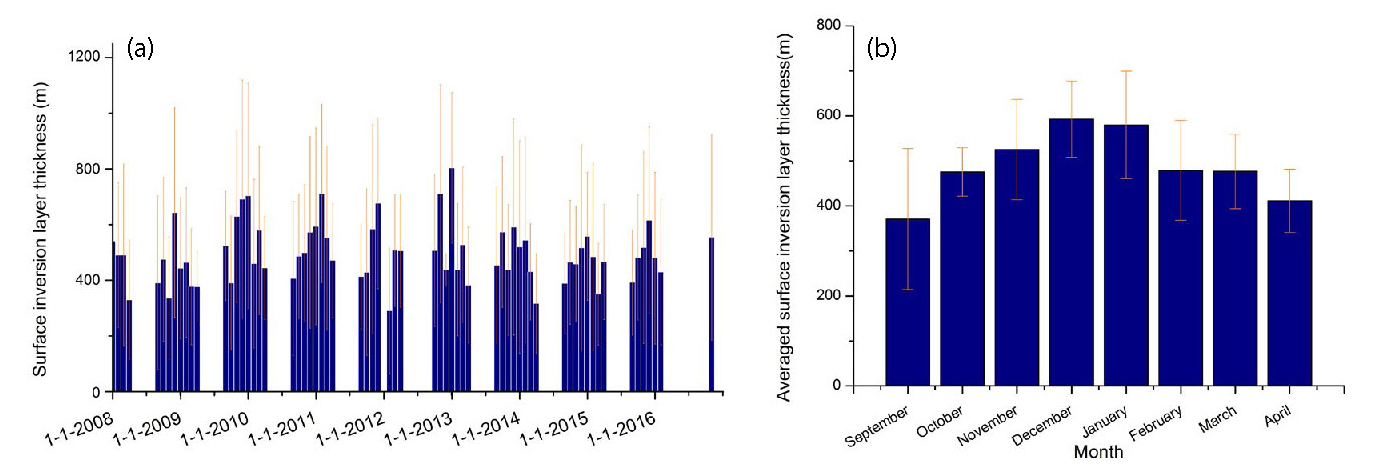
(a) Time series of the monthly mean temperature inversion layer thickness (navy column) from January 2008 to December 2016. (b) Temperature inversion layer thickness (navy column) from September to April, using data averaged from 2008 to 2016. The error bars (orange) represent the standard deviation of each month.
4. DISCUSSION
Studies have shown that particulate air pollutants in Ulaanbaatar mainly originate from coal combustion in ger districts distributed predominantly on the northern and western sides of the city (Guttikunda, 2007), as coal combustion in domestic stoves is commonly used for residential heating. Therefore, emissions increased rapidly when the daily averaged surface temperature dropped below 0°C after mid-October. The variations in PM concentrations in this study match the results of several previous studies (Davy et al., 2011; Nishikawa et al., 2011). In a comparison with other studies (Yonemochi et al., 2013; Wang et al., 2013), the PM2.5 and PM10 concentrations in Ulaanbaatar were similar to those of highly polluted cities such as Beijing and Shanghai, China (Table 2), underlining the severity of winter particulate air pollution in Ulaanbaatar.

Comparison of the PM2.5 concentrations and PM2.5/PM10 ratios in Ulaanbaatar, Beijing, and Shanghai. The data for Beijing and Shanghai were taken from Yonemochi et al. (2013) and Wang et al. (2013), respectively. All time periods of the data from Ulaanbaatar in this table are the same as described in the text.
As an inland city, Ulaanbaatar experiences a typical continental climate. Most precipitation is concentrated in June, July, and August, resulting in high RHs in summer. However, the meteorological data revealed that the RH in winter was almost the same as in summer, which is rare in the absence of anthropogenic effects. The major cause of such high RH in winter could be the usage of heat-only boilers (HOBs) in Ulaanbaatar. Although HOBs account for only 14% of the PM emissions according to previous work (Oyunchimeg and Tsolmon, 2011), they generate and emit a large amount of water vapor. One study reported that the secondary particle production effect strengthened when there was no rainfall and RH was kept within the range of 60-80%, resulting in a positive correlation between PM2.5 concentration and RH (Zhang et al., 2016). This was in good agreement in our study in that our RH data showed that on most days with high PM2.5 concentrations, the RH was between 60% and 80%.
We used LIDAR measurements combined with radiosonde data to observed the characteristic seasonal variations in the temperature inversion and mixed layers. After determining the mixed layer height using the wavelet covariance transforming method based on NIES LIDAR data, which was also used in our previous work (Wang et al., 2017), we compared the temperature inversion layer height defined using radiosonde data and the mixed layer height. The diurnal development of the mixed layer had a maximum height of almost 2000 m on a typical sunny summer day (e.g., July 16, 2011) and there was no temperature inversion (Fig. 6a). Although no temperature inversion was measured in summer, an overlapping inversion layer was observed in autumn and winter. The inversion layer height was defined from the radiosonde data measured at 08:00 LST. On January 30, 2011, the inversion layer height was much higher than the mixed layer at 08:00 LST (Fig. 7). This is a typical phenomenon on sunny days in winter in Ulaanbaatar. The temperature inversion layer persisted throughout the day and capped the developing mixed layer. On October 28, 2010 (Fig. 6b), the inversion layer thickness at 08:00 LST was at approximately the same level as the daily maximum height of the mixed layer (~700 m) and was broken through by the developed mixed layer between 12:00 and 16:00 LST. Surface wind is weak and vertical convection is almost nonexistent in winter (November-February), as we mentioned in our previous study that during 2010-2011 winter, the surface wind velocity was lower than 4 m/s (Wang et al., 2017). The daily average surface temperature from December to February in our study period was below -20°C and did not exceed 0°C until late March. This stable urban atmosphere persisted throughout winter, allowing the overlapping inversion layer to prevail throughout the day. Figs. 6c and 7 show a good example of this. The maximum height of the mixed layer was below 300 m on January 30, 2011, while the thickness of the inversion layer at 08:00 LST exceeded 850 m. The diurnal mixed layer developed slightly but was suppressed by the thick, overlapping inversion layer, which could no longer be broken through. This resulted in a low daily maximum height and entrapment of particulate air pollutants. Such a pattern of mixed and temperature inversion layers differs substantially from that in Beijing (Tang et al., 2016), which is mainly because of the Siberian High that dominates Ulaanbaatar and surrounding areas from late October to early March. Radiative cooling is strengthened by Ulaanbaatar’s basin-like terrain, which enhances the stability of the urban atmosphere.
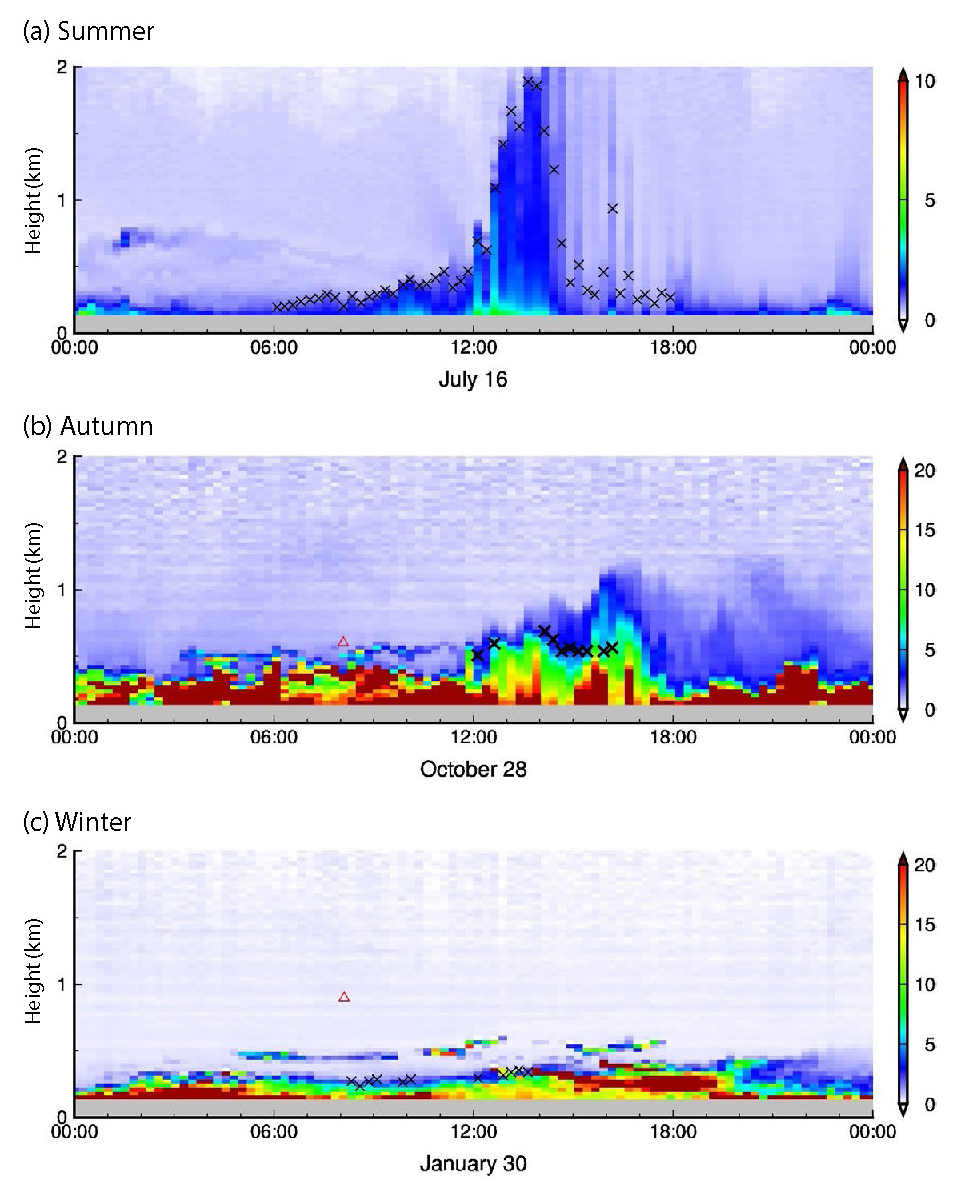
Typical sunny days in three seasons on (a) July 16, 2011, (b) October 28, 2010, and (c) January 30, 2011, with the mixed layer height (black cross mark) defined from LIDAR profiles and temperature inversion layer height (red triangle) defined from radiosonde data at 08:00 LST. Color bars in three panels show the attenuated backscattering coefficient (×10-6/m/sr).
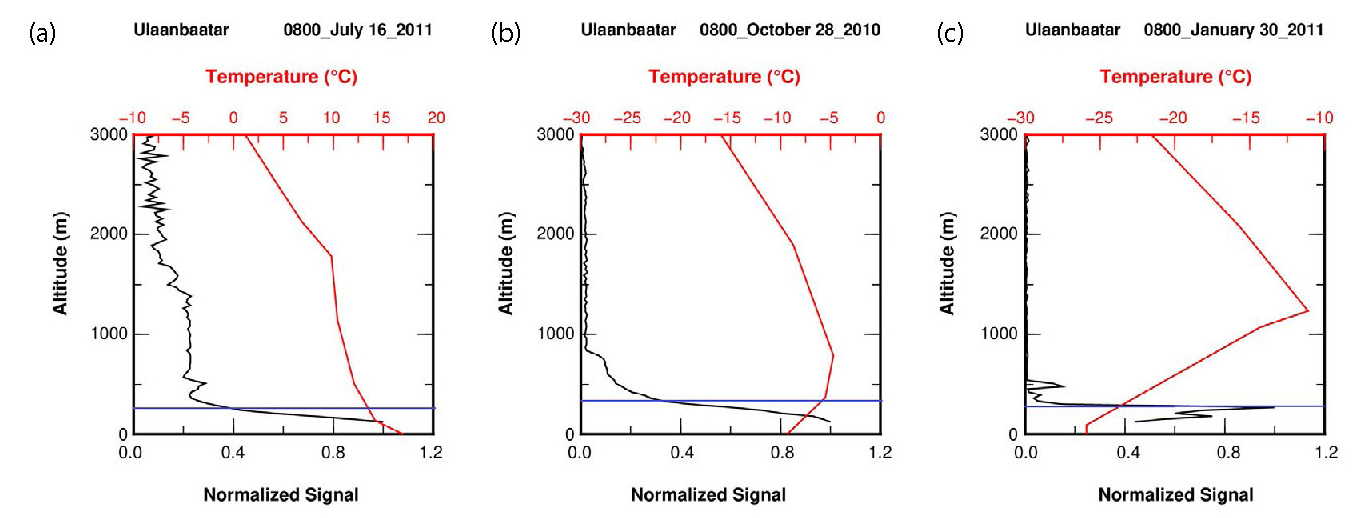
Normalized LIDAR signal (black) and temperature (red) measured by the radiosonde at 08:00 LST on (a) July 16, 2011, (b) October 28, 2010 and (c) January 30, 2011. The blue line in three panels indicates the height of the mixed layer determined with the wavelength covariance transform method.
The thickness of the temperature inversion layer in Ulaanbaatar typically ranged from 500 to 700 m in December and January (Figs. 5 and 7), which was thicker than the mixed layer height in this period (<500 m). The result is comparable to the December average (~650 m) from 1981-2010 based on Ulaanbaatar radiosonde observations (Gerelchuluun and Ahn, 2014) and is in agreement with the value simulated using the Weather Research and Forecasting model (Ganbat and Baik, 2016). This phenomenon is unique among polluted cities worldwide, which usually have a higher mixed layer than temperature inversion layer. For instance, according to Yang et al. (2006), the monthly average height of the mixed layer in Shanghai varied from 500 to 700 m and the minimum value of the annual mixed layer was 525 m from 1990 to 2004. In addition, according to Xu et al. (2010), the mixed layer in Shanghai developed between 600 and 1300 m. Therefore, the much lower mixed layer and thicker temperature inversion layer in Ulaanbaatar have a characteristic restraining force on emitted particulate pollutants, which is somewhat similar to the relationship between the temperature inversion layer and surface ozone concentrations (Xu et al., 1999).
Both the persistence time and intensity of the temperature inversion had seasonal variations that affected the concentration of particulate air pollutants. Fig. 8 shows the significant positive correlation (R=0.595, p=0.041) between the monthly averaged PM2.5 and temperature inversion intensity , which was calculated from March 2008 to December 2016. Meanwhile, the maximum values of PM2.5, PM10, ΔT, and Δh were observed in December and the maximum temperature inversion intensity was measured in January with a narrow margin over that for December (Table 1). During the research period, the temperature inversion layer became thicker and stronger every year from September to January, as the atmosphere became increasingly stable. As a result, emitted atmospheric particulate matter was concentrated at the ground level, which resulted in severe particulate air pollution.
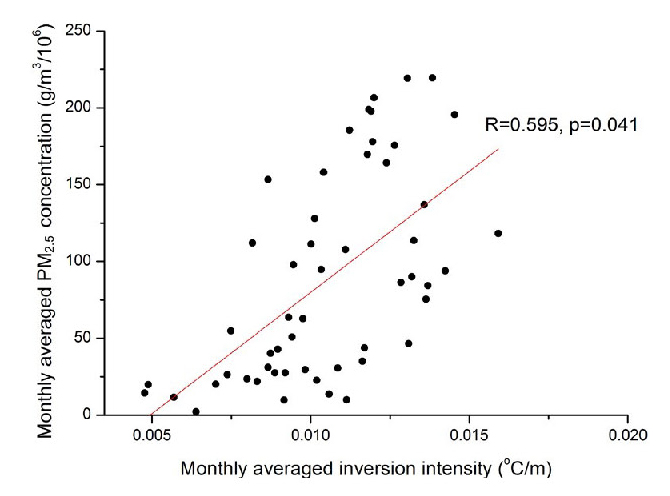
Correlation between the monthly mean inversion intensity and monthly mean PM2.5 concentration from March 2008 to December 2016. The inversion intensity was calculated as the quotient between the temperature inversion ΔT and inversion height Δh within 500-600 m (~800 hPa) above the ground (~865 hPa).
Previous research has indicated that the PM2.5 concentration during winter in Ulaanbaatar exhibits hourly variations, where concentrations are higher at night and ~12:00 LST and become weaker in the morning and afternoon (Mori et al., 2012). Because the radiosonde data used in our study was collected at 08:00 LST, the PM2.5 data we included in our comparison were also collected at that time of day. Although the 24-h average PM2.5 concentration was much greater than that measured at 08:00 LST, it was still strongly correlated with temperature inversion intensity.
The only parameter in Ulaanbaatar that was substantially higher level than in Shanghai was the PM2.5/PM10 ratio (Table 2). The winter PM2.5/PM10 ratio in Shanghai is usually between 0.5-0.7, while that in Ulaanbaatar is 0.8±0.07 (Nishikawa et al., 2015; Allen et al., 2013). There are several reasons to this phenomenon, and one of them might be the difference between the main emission sources among two cities. Generally, anthropogenic sources involving high temperature processes, such as coal combustion and vehicle exhaust, can produce fine particles (Morawska et al., 2008). In the other hand, natural and anthropogenic mechanical processes, such as grinding, mining, construction, wear and tear of materials, and dust resuspension, contribute to the coarse fraction mode (Morawska et al., 2008). Actually, the proportion of coal combustion among the emission sources in Ulaanbaatar is quite different from Shanghai. According to previous study, 64% of PM emissions from coal-fired sources in Ulaanbaatar are from households (Oyunchimeg and Tsolmon, 2011). Conversely, it is reported that among the local sources in Shanghai, mobile sources such as vehicles, ships, and aircrafts account for 29.2%, industrial production accounts for 28.9%, and coal combustion accounts for only 13.5% (Shanghai Environmental Protection Bureau, 2015). Since the concentration of PM2.5 in Ulaanbaatar shows similar range of value with Shanghai, the industrial activities and ships, aircrafts that are ubiquitous in Shanghai but relatively infrequent in Ulaanbaatar, might be the reason to generate abundant PM10-2.5, resulting in a decreased PM2.5/PM10 ratio. Besides, as a coastal city, Shanghai has relatively higher concentration of sea salt particles in its atmosphere, and occasionally receives long-range-transport floating dust from northern China, which could also increase PM10-2.5 concentrations. On the other hand, Ulaanbaatar receives few external transported particles in winter. In general, the difference of emission sources, anthropogenic activities, and geographic location between Ulaanbaatar and Shanghai could probably be the main reason of the difference of PM2.5/PM10 ratio.
5. CONCLUSIONS
We investigated the annual variations in PM2.5, PM10, visibility, and RH from March 2008 to April 2014 in Ulaanbaatar, Mongolia, using meteorological data. Their significant seasonal variations matched the results of our previous work, indicating that the particulate air pollution episode observed in 2010 was not an isolated case, but rather part of a regular pattern that has occurred every winter in recent years. By calculating the temperature inversion layer thickness and intensity from radiosonde data for 2008-2016, we elucidated the timing of the beginning and end of the temperature inversion layer that capped the urban area of Ulaanbaatar every winter, and found a strong correlation between the temperature inversion intensity and PM2.5 concentrations. Based on the LIDAR and radiosonde data analysis, the meteorological and geographical characteristics of Ulaanbaatar lead to a unique urban atmospheric environment in midwinter, with a thick temperature inversion layer (>500 m) that overlays a weak, thin mixed layer (<300 m) during daytime. As a topic for future research, local radiosonde measurements at 1~2 hour intervals on sunny days during midwinter would help verify these results. Although Ulaanbaatar had the same PM2.5 concentrations as Beijing and Shanghai, the winter PM2.5/PM10 ratio in Ulaanbaatar was higher than that of Shanghai. As part of the meteorological characteristics of Ulaanbaatar, the strong temperature inversion layer to some extent strengthened particulate air pollution in the urban area and should be examined further in future studies aiming to ameliorate urban particulate air pollution in Ulaanbaatar.
Acknowledgments
We are grateful to the Mongolia National Agency for Meteorology and Environmental Monitoring for providing the surface meteorological and radiosonde data for Ulaanbaatar collected at a local meteorological observatory. This study was supported in part by a Grant-in-Aid for Scientific Research from the Japan Society for the Promotion of Science (No. 16H02703).
References
- Abres, A.F., Ajero, M., Fabian, H., Ramirez, N., (2006), Country Synthesis Report on Urban Air Quality Management, The Asian Development Bank, Mongolia, p20.
-
Allen, R., Gombojav, E., Batdorj, B., Tsogbaatar, B., Oyuntogus, L., Amram, O., Takaro, T., Janes, C., (2013), An assessment of air pollution and its attributable mortality in Ulaanbaatar, Mongolia, Air Quality, Atmosphere, and Health, 6, p137-150.
[https://doi.org/10.1007/s11869-011-0154-3]

-
Amarsaikhan, D., Blotevogel, H.H., Ganzorig, M., Moon, T.H., (2009), Applications of remote sensing and geographic information systems for urban land-cover change studies in Mongolia, Geocarto International, 24(4), p257-271.
[https://doi.org/10.1080/10106040802556173]

-
Davy, P.K., Gunchin, G., Markwitz, A., Trompetter, W., Barry, B., Shagjjamba, D., Lodoysamba, S., (2011), Air particulate matter pollution in Ulaanbaatar, Mongolia: determination of composition, source contributions and source locations, Atmospheric Pollution Research, 2, p126-137.
[https://doi.org/10.5094/apr.2011.017]

- Enkhbayar, Ts., (2014), Ger district and its development potentials in Mongolia, Fourth regional workshop on integrated resource management in Asian cities, The Urban Nexus, Ulaanbaatar, Mongolia, November 5-7, 2014.
-
Ganbat, G., Baik, J., (2016), Wintertime winds in and around the Ulaanbaatar Metropolitan Area in the presence of a temperature inversion, Asia-Pacific Journal of the Atmospheric Sciences, 52(3), p309-325.
[https://doi.org/10.1007/s13143-016-0007-y]

-
Gerelchuluun, B., Ahn, J.B., (2014), Air temperature distribution over Mongolia using dynamical downscaling and statistical correction, International Journal of Climatology, 34, p2464-2476.
[https://doi.org/10.1002/joc.3853]

- Guttikunda, S.K., (2007), Urban air pollution analysis for Ulaanbaatar, Mongolia. Consultation report, The World Bank, Washington, D.C, p120.
- Matsumiya, Y., (2015), On the urbanization of Ulaanbaatar: with special reference to the Ger areas, Research Journal of Graduate Students of Letters, 43, Meiji University, p73-94, (in Japanese).
-
Morawska, L., Keogh, D.U., Thomas, S.B., Mengersen, K., (2008), Modality in Ambient Particle Size Distributions and its Potential as a Basis for Developing Air Quality Regulation, Atmospheric Environment, 42, p1617-1628.
[https://doi.org/10.1016/j.atmosenv.2007.09.076]

- Mori, I., Yamazaki, M., Batdorj, D., Takahashi, A., Nishikawa, M., Matsui, I., Shimizu, A., Takahashi, K., (2012), Characteristics of Wintertime Airborne Particulate Matter in Ulaanbaatar, Proceedings of the 53rd Annual Meeting of Japan Society of Atmospheric Environment, Yokohama, 492, (in Japanese).
-
Nishikawa, M., Matsui, I., Batdorj, D., Jugder, D., Mori, I., Shimizu, A., Sugimoto, N., Takahashi, K., (2011), Chemical composition of urban airborne particulate matter in Ulaanbaatar, Atmospheric Environment, 45, p5710-5715.
[https://doi.org/10.1016/j.atmosenv.2011.07.029]

- Nishikawa, M., Matsui, I., Mori, I., Batdorj, D., Sarangerel, E., Ohnishi, K., Shimizu, A., Sugimoto, N., (2015), Chemical characteristics of airborne particulate matter during the winter season in Ulaanbaatar, Earozoru Kenkyu, 30, p126-133.
- Nyamtseren, L., (2009), Air Pollution Issues of UB City and Some Evaluations of Coming Activities, Mongolian Development Institute, Ulaanbaatar.
- Oyunchimeg, D., Tsolmon, (2011), Emission inventory of coal fired emission sources in Capital city, Mongolia. Papers in Meteorology and Hydrology 32/8, p162-169.
- Oyunchimeg, U., Burmaa, B., (2005), Study on Ulaanbaatar city air pollution influence on birth defects, Mongolian Medicine, 4, p32-35.
- Shanghai Environmental Protection Bureau, (2015), http://www.sepb.gov.cn/fa/cms/shhj/shhj2272/shhj2159/2015/01/88463.htm. (in Chinese).
- Sugimoto, N., Nishizawa, T., Liu, X., Matsui, I., Shimizu, A., Zhang, Y., Kim, Y.J., Li, R., Liu, J., (2009), Continuous observations of aerosol profiles with a two-wavelength Mie-scattering lidar in Guangzhou in PRD2006, Journal of Applied Meteorology and Climatology 48, p1822-1830.
-
Tang, G., Zhang, J., Zhu, X., Song, T., Munkel, C., Hu, B., Schafer, K., Liu, Z., Zhang, J., Wang, L., Xin, J., Suppan, P., Wang, Y., (2016), Mixing layer height and its implications for air pollution over Beijing, China, Atmospheric Chemistry and Physics, 16, p2459-2475.
[https://doi.org/10.5194/acp-16-2459-2016]

-
Wang, J., Hu, Z., Chen, Y., Chen, Z., Xu, S., (2013), Contamination characteristics and possible sources of PM10 and PM2.5 in different functional areas of Shanghai, China, Atmospheric Environment, 68, p221-229.
[https://doi.org/10.1016/j.atmosenv.2012.10.070]

-
Wang, M., Kai, K., Sugimoto, N., Jin, Y., Batdorj, D., (2017), Air particulate pollution in Ulaanbaatar, Mongolia: Variation in atmospheric conditions from autumn to winter, Science Online Letters on the Atmosphere, 13, p90-95.
[https://doi.org/10.2151/sola.2017-017]

- World Bank, (2009), Mongolia, Air Pollution in Ulaanbaatar: Initial Assessment of Current Situation and Effects of Abatement Measures, The World Bank, Washington, D.C, p146.
- World Bank, (2010), Enhancing policies and practices for Ger area development in Ulaanbaatar, The World Bank, Washington, D.C, p127.
- Xu, J., Geng, F., Zhen, C., Gao, W., (2010), Aerosol scattering coefficients and the factors affecting them in Shanghai Pudong, Acta Scientiae Circumstantiae, 30(1), p211-216, (in Chinese).
-
Xu, J., Zhu, Y., Li, J., (1999), Case studies on the processes of surface ozone pollution in Shanghai, Journal of the Air & Waste Management Association, 49(6), p716-724.
[https://doi.org/10.1080/10473289.1999.10463842]

- Yang, Y., Tan, J., Zheng, Y., Cheng, S., (2006), Study on the atmospheric stabilities and the thickness of atmospheric mixed layer during recent 15 years in Shanghai, Scientia Meteorologica Sinica, 26(5), p536-541, (in Chinese).
- Yonemochi, S., Chen, X., Miao, P., Lu, S., Oh, K., Umezawa, N., (2013), Characterization of high concentration of PM2.5 and PM1 collected in Beijing in January, Journal of Japan Society for Atmospheric Environment, 48(3), p140-144, (in Japanese).
- Zhang, S., Han, L., Zhou, W., Zheng, X., (2016), Relationships between fine particulate matterPM2.5) and meteorological factors in winter at typical Chinese cities, Acta Ecologica Sinica, 36(24), p7897-7907, (in Chinese).
