Long-term Monitoring of Metal Elements in Total Suspended Particle Aerosols Simultaneously Collected at Three Islands in Okinawa, Japan
Copyright © 2018 by Asian Journal of Atmospheric Environment
This is an open-access article distributed under the terms of the Creative Commons Attribution Non-Commercial License (http://creativecommons.org/licenses/by-nc/4.0/), which permits unrestricted non-commercial use, distribution, and reproduction in any medium, provided the original work is properly cited.
Abstract
In the present study, total suspended particle (TSP) aerosols were simultaneously collected using identical high-volume air samplers at three islands in Okinawa; Cape Hedo Atmosphere and Aerosol Monitoring Station (CHAAMS, Okinawa Island), from 2008 to 2012 Kume Island (KM, ca. 160 km south-west of CHAAMS), and Minami-Daitou Island (MD, ca. 320 km south-east of CHAAMS) from 2008 to 2010. The sample collected were analyzed using energy-dispersive X-ray fluorescence spectrometry (ED-XRF) and synchrotron radiation X-ray fluorescence spectrometry (SR-XRF) to investigation long-range transport of metal elements to Okinawa from the Asian continent. From analytical data on samples collected at CHAAMS for five years, it was found that most elements (Ca, Fe, Ti, Mn, V, Cu, Ni, Pb, As, and Zn) in TSP aerosols showed higher concentrations in the period from October to May, when the continental air mass passed over Okinawa, regardless of Asian dust events. The annual average concentrations of Ni, Cu, Zn, As, Se, and Pb in TSP aerosol samples collected at three islands gradually decreased as the TSP aerosols traveled from west to east in any year. Based on the enrichment factors (EFs) and concentration ratios, it is considered that most of anthropogenic elements such as As, Pb, and Zn in TSP aerosols are derived from coal combustion in the Asian continent. Moreover, it is confirmed from the direction of the air mass reaching the sampling sites that Cu, Zn, As, and Pb in TSP aerosols were transported to the three islands in Okinawa by air mass not only from northwest and north, but also from the west. These TSP aerosols transported from the Asian continent may influences not only the atmospheric environment but also the concentrations of trace metals in coastal seawater in Okinawa, which have to be kept extremely low to preserve the diverse and unique ecosystem in coral reefs.
Keywords:
Long-range transportation, Metal elements, TSP aerosols, Okinawa, Asian continent1. INTRODUCTION
These days, rapid economic growth in East Asia has caused considerable air pollution, which is emitted by expansion of industrial activities and increase of fossil fuel combustion, and transported with aerosols from East Asia to Pacific region. Thus, many studies on long-range transportation of air pollutants have been reported so far in Japan (Tatsuta et al., 2017; Arakaki et al., 2014; Handa et al., 2010; Takami et al., 2007), Taiwan (Chuang et al., 2017; Yeh et al., 2017), and Korea (Ghim et al., 2017; Kim et al., 2017).
Okinawa Island in Japan is situated approximately 1,860 km southeast of Beijing, China, 820 km east of Shanghai, China, 1,260 km south of Seoul, Korea, and 1,550 km southwest of Tokyo, Japan. Its location is well suited for the investigation of the long-range transport of air pollutants in East Asia. The air mass from the Asian continent dominates during the spring, autumn, and winter, while the air mass from the Pacific Ocean surpasses during the summer (Shimada et al., 2015; Arakaki et al., 2014; Verma et al., 2011; Takami et al., 2007; Arakaki et al., 2006). Therefore, air pollutants resulting from long-range transport and from local emission could be distinguished in long-term monitoring of aerosols in Okinawa Island.
In 2005, the Japanese National Institute for Environmental Studies (NIES) built the Cape Hedo Atmosphere and Aerosol Monitoring Station (CHAAMS) at the northern end of Okinawa Island, approximately 100 km from Naha, the capital city of Okinawa Prefecture (Fig. 1) to investigate the long-range transport of air pollutants in East Asia. Many studies have been carried out at CHAAMS (Taniguchi et al., 2017; Shimada et al., 2015; Arakaki et al., 2014; Verma et al., 2011; Mochida et al., 2010; Takiguchi et al., 2008; Takami et al., 2007) to monitor and characterize various chemical substances in aerosols transported from the Asian continent. We have been collecting total suspended particle (TSP) aerosols at CHAAMS since 2005 using a high-volume air sampler and have performed studies on Fe(II) photoformation (Okada et al., 2006), major anions, cations, and water-soluble organic carbon in TSP aerosol samples (Arakaki et al., 2014). In the present study, we studied furthermore trace metals in TSP aerosol samples. Trace metals in TSP aerosols would be good indicators of emission sources, because these metals are transported to remote area without volatilization or decomposition. Therefore, a multielement investigation of trace metals in TSP aerosols at transported remote and isolated island would be possibly useful in elucidating the route or emission sources of transboundary air pollution (Okuda et al., 2006).
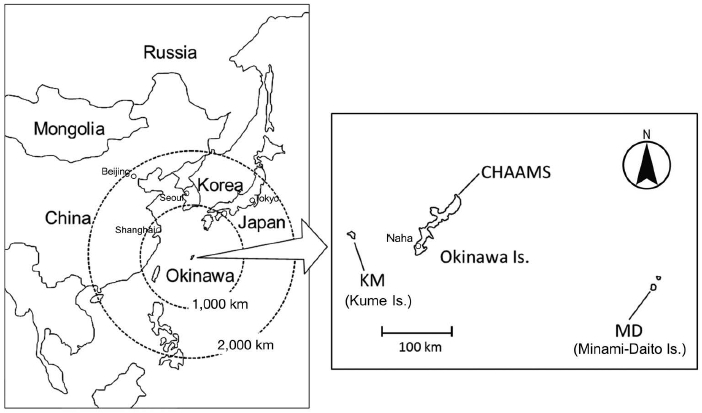
Sampling sites in Okinawa, Japan. Cape Hedo Atmosphere and Aerosol Monitoring Station (CHAAMS), Kume Island (KM), and Minami-Daitou (MD) Island.
In this study, we simultaneously collected TSP aerosol samples not only at CHAAMS but also at Kume Island (KM, ca. 160 km southwest of CHAAMS) and Minami-Daitou Island (MD, ca. 320 km southeast of CHAAMS) from June 2008 to June 2010. It is expected that the comparison with the monitoring data for the three islands would provide the important information on the transport route followed by air pollution from the Asian continent. Therefore, the long-term monitoring of the metal contents in TSP aerosol samples simultaneously collected at the three islands in Okinawa was carried out by rapidly analyzing these samples without any pretreatment using energy-dispersive X-ray fluorescence spectrometry (ED-XRF) and synchrotron radiation X-ray fluorescence spectrometry (SR-XRF). Furthermore, the long-range transportation of TSP aerosols to Okinawa Inland from the Asian continent and their emission sources were discussed from multielemental data in long-term monitoring at the three islands in Okinawa from June 2008 to June 2010 with air mass of the direction reaching each sampling site, assigned by back trajectory (BT) calculation.
2. EXPERIMENTAL
2. 1 Instrumental
The concentrations of heavy metals in TSP aerosol samples were measured by a bench top ED-XRF (Minipal 4, 30 W Rh anode, PANalytical Co.). ED-XRF is a useful method to analyze the metal contents in bulk aerosol samples rapidly without conducting any chemical pretreatment. ED-XRF measurements in the present study were carried out in the helium atmosphere in the X-ray paths between the sample and the detector for a highly sensitive analysis of K and Ca. The amount of aerosols collected on each filter was calculated by the difference in the weight of the filter weights before and after aerosol collection. The amount of aerosols collected on the filter was converted to the mass of each element per unit volume of air.
2. 2 Sampling Sites and Collection of Aerosol Samples
The three sampling locations: Cape Hedo Atmosphere and Aerosol Monitoring Station (CHAAMS: 128°14ʹE, 26°52ʹN), Kume Island (KM: 128°46ʹE, 26°20ʹN), and Minami-Daitou Island (MD: 131°13ʹE, 25°50ʹN) in Okinawa, Japan are shown in Fig. 1. TSP aerosol samples were collected using identical high-volume air samplers (0.5 m3 min-1, HV-500F, SIBATA) and quartz filters (Model 2500 QAT-UP, Pallflex) at those sites. The monitoring period at CHAAMS were from January 2008 to August 2012 and those at KM and MD were from June 2008 to June 2010. The sampling period was one week for each sample; in some cases, this period varied because of local weather conditions: e.g., typhoons, or faulty samplers. The quartz filters containing aerosol samples were cut to obtain circle of 30 mm diameter using ceramic scissors. The metal contents of quartz filters containing all aerosol samples and 13 standard samples prepared for calibration curve, described in detail afterwards, were measured by setting into XRF after sandwiching between plastic container and 6 μm mylar film.
2. 3 Determination of Arsenic Concentration
Arsenic could not be correctly determined since Kα line of As (10.530 keV) was interfered by Lα line of Pb (10.550 keV) in ED-XRF measurement. Thus, As in the aerosol samples was determined by SR-XRF at the BL-4A beam line in Photon Factory in High Energy Accelerator Research Organization (KEK-PF), located in Tsukuba, Japan. The adsorption-edge energy to excite the As K line and Pb L-III line were 11.862 keV and 13.038 keV, respectively. Therefore, we measured As using the monochromatic X-ray of 12.8 keV by a Si(111) double crystal monochromator in the present study.
2. 4 Preparation of Standard Samples for Calibration Curve
Standard samples for calibration curve in the determination by XRF were prepared in the following small-chamber method (Saito et al., 2005). In the small-chamber method, the certified standard material (NIES CRM No.28), which was an urban aerosol samples collected in Beijing, China, was gradually collected on quartz filters by absorbing at 20 L min-1 for 1-15 min with low volume air sampler (SL-30N, SIBATA) after they were diffused in 10 L of small-chamber made of Acryl plate. Totally 13 standard samples for calibration curve were prepared by the small-chamber method. This analytical method is described in detail in another paper (Nakano et al., 2018).
The lower limits of detections estimated by the theoretical equation were 0.026 μg/cm2 for K, 0.033 μg/cm2 for Ca, 0.10 μg/cm2 for Ti, 0.040 μg/cm2 for V, 0.018 μg/cm2 for Mn, 0.010 μg/cm2 for Fe, 0.027 μg/cm2 for Ni, 0.025 μg/cm2 for Cu, 0.016 μg/cm2 for Zn, 0.007 μg/cm2 for As, 0.013 μg/cm2 for Se, 0.205 μg/cm2 for Ba, 0.034 μg/cm2 for Rb, and 0.006 μg/cm2 for Sr. The prepared standard materials were applied to determine metal element of TSP Aerosols. The analytical results by XRF were compared with those by ICP-MS or AAS and both results had a strong correlation coefficient (r) higher than 0.800 for all elements.
2. 5 Determination of Air Mass Direction
The direction of the air mass reaching a particular sampling site was determined using the Hybrid Single Particle Lagrangian Integrated Trajectory (HYSPLIT) Model from the U.S. National Oceanic and Atmospheric Administration (NOAA, http://www.noaa.gov/) to identify the origin of a specific aerosol sample. The detailed calculation method was described in previous paper (Arakaki et al., 2014).
3. RESULTS AND DISCUSSION
3. 1 Long-term Monitoring of the Concentrations of Metal Elements in TSP Aerosols at CHAAMS
15 metal elements (K, Ca, Ti, V, Mn, Fe, Ni, Cu, Zn, As, Se, Rb, Sr, Ba, and Pb) in TSP aerosol samples collected at CHAAMS from January 2008 to August 2012 could be determined by ED-XRF. The annual average concentrations of metals in TSP aerosol samples and the amounts of TSP aerosol samples collected on each fileter at CHAAMS are summarized in Table 1 with their standard deviations. As can be seen in Table 1, the annual average concentrations of most elements showed the highest values in 2011, when the TSP aerosol amounts were also the largest during 2008-2012. Except for 2010, the annual average concentrations of Ca, Ti, Mn, Fe, and Sr in the TSP aerosol samples increased year after year, while those of Zn, As, and Pb slightly decreased during same period. The relative standard deviations (RSDs) of the annual average concentrations of metal elements in TSP aerosol samples collected at CHAAMS shown in Table 1 were 20-320% and relatively large. These results suggest that variations in metal concentrations in TSP aerosol samples at CHAAMS would be influenced by seasonal changes.

Annual average concentrations of metal elements in TSP aerosols and TSP amounts at CHAAMS from 2008 to 2012.a)
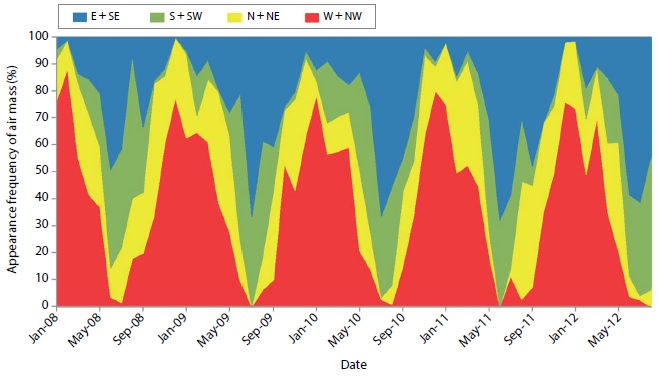
The monthly concentration variations of 11 metal elements in TSP aerosol samples collected at CHAAMS from 2008 to 2012 are shown in Fig. 2. Here, analytical data on heavy metal elements were mainly illustrated in Fig. 2. The monthly concentration variations of Ca, Fe, Ti, Se, Mn, and V are shown in Fig. 2(a) and (b), while those of Cu, Ni, Pb, As, and Zn are shown in Fig. 2(c). The amounts of TSP aerosol samples are also shown in Fig. 2(a). In addition, the appearance frequency of air mass direction at CHAAMS from 2008 to 2012, which was assigned by BT calculation, is shown with percent units in Fig. 3. As seen in Figs. 2 and 3, the concentrations of most elements in TSP aerosol samples were the highest in the period from October to May, when the air mass coming from the west and northwest passed over the sampling sites. On the contrary, they were the lowest in the period from June to September in each year, a period when air mass coming from the southeast passed over the sampling sites.
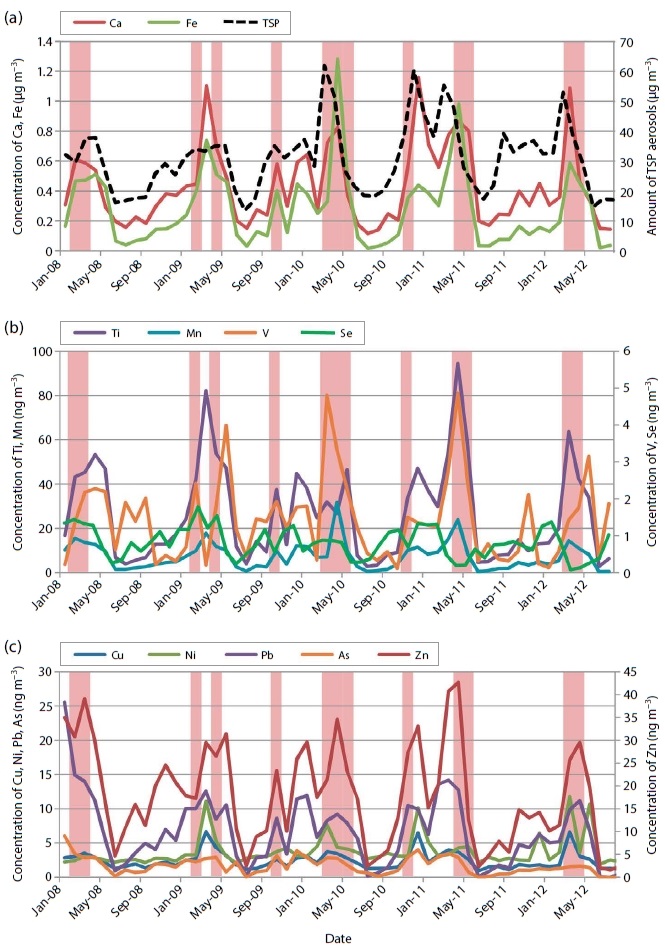
Monthly concentration variations of 11 metal elements in TSP aerosols and the amounts of TSP aerosol samples collected at CHAAMs from 2008 to 2012. Pink areas show the months when Asian dust came to Okinawa from Asian Continent. (a) concentration of Ca and Fe, (b) concentration of Ti, V, Mn and Se, (c) concentration of Ni, Cu, Zn, As, and Pb.
According to the Japan Meteorological Agency (http://www.jma.go.jp/jma/index.html), the Asian dust events were observed in February and March 2008: in February, April and October 2009: in March, April, May, and November 2010: in April and May 2011: and in March and April 2012. These periods corresponding to the areas were marked in pink in Fig. 2. Most metal elements in TSP aerosol samples showed higher concentrations, when the Asian dust came to Okinawa from the Asian continent, especially from February to May. Therefore, it is suggested that some parts of the TSP aerosol samples could be transported to the Okinawa Islands from the Asian continent with the Asian dust events. However, many metal elements (Ca, Fe, Ti, Mn, V, Cu, Ni, Pb, As, and Zn) in TSP aerosol samples showed higher concentrations even in the period from October to May, which was not characterized by clearly identified Asian dust events.
3. 2 Comparison of the Average Concentrations of Metal Elements in TSP Aerosol Samples Collected at the Three Islands in 2008-2010
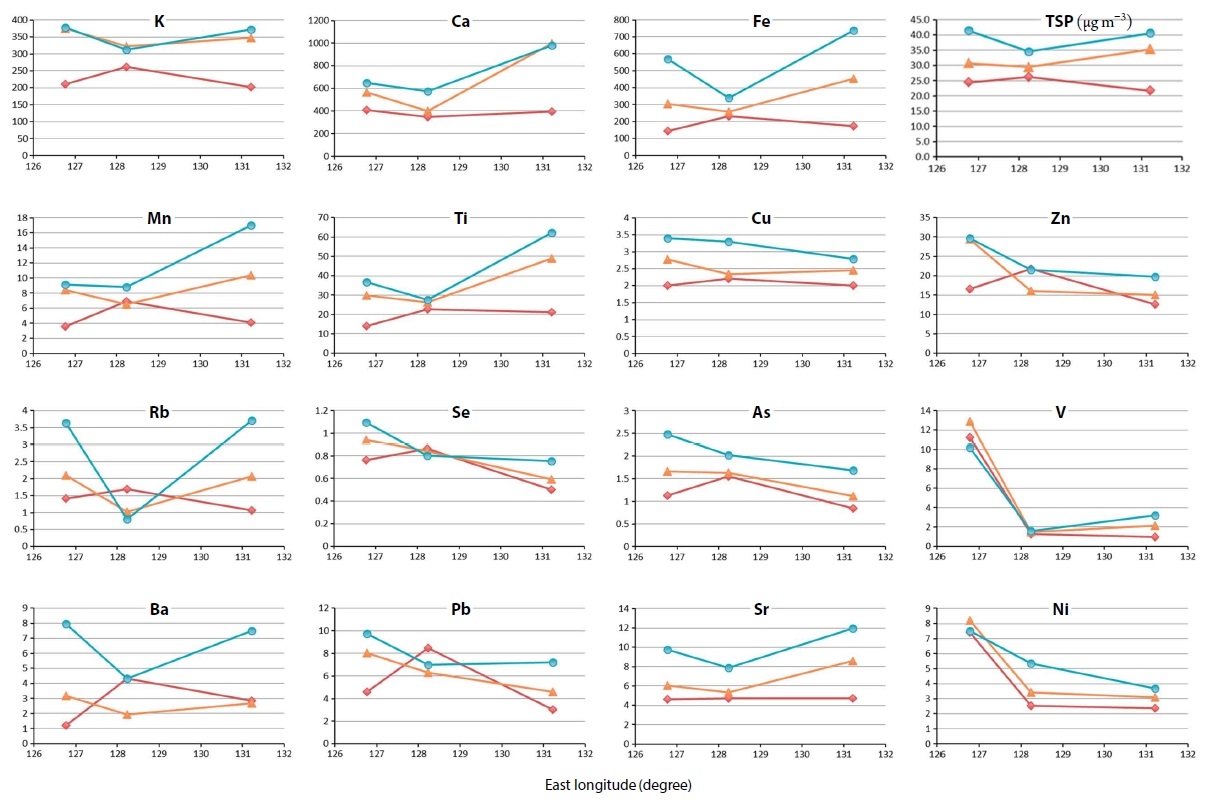
The annual average concentrations of 15 metal elements in TSP aerosol samples and the amounts of TSP aerosol samples collected at the three islands in 2008-2010 are shown in Fig. 4 along with the longitude of the sampling sites. In general, the TSP aerosols emitted into the atmosphere are removed from it by wet or dry deposition during transportation and diffusion of the air mass. If TSP aerosols are emitted in Asian continent, their concentration is expected to decrease as the distance from the Asian continent increases. As shown in Fig. 4, in any year, the annual average concentrations of V, Ni, Cu, Zn, As, Se, and Pb in the TSP aerosol samples gradually decreased as the location of the sampling site “shifted” from the west to the east. These results suggest that TSP aerosols containing these elements were transported to the three islands in Okinawa from the Asian continent. However, the annual average concentrations of V in TSP aerosol samples at KM were much higher than those at CHAAMS and MD, which could be due to heavy oil combustion by the power plant located near the KM sampling site. On the other hand, K, Ca, Ti, Mn, Fe, Rb, Sr, and Ba in TSP aerosol samples showed almost constant or slightly increasing concentrations along with the longitude of the sampling sites. MD site is located on the roof of the junior high school library and there is a large playground covered with local soil. In addition, the concentration distribution of some of these elements in relation to the longitude of the sampling site varied from year to year. It is therefore speculated that the concentrations of these elements were influenced not only by TSP aerosols emitted in the Asian continent and transported eastward, but also by those emitted locally.
3. 3 Enrichment Factor of Each Metal in TSP Aerosols
The EFs of metal elements analyzed in the present study were calculated to evaluate the emission source of each element in the TSP aerosols. The EF of an element is defined as the normalized ratio of the concentration of that element in the aerosol sample to that in the continental crust (Taylor, 1964) as shown in the following equation:
where [M]sample and [Ti]sample are the concentrations of elements M and Ti in the sample, and [M]crust and [Ti]crust are the concentrations in the continental crust. Usually, EF values are normalized using the concentration of Al, because Al is one of the major constituents in the crust and it is chemically inactive (Taylor, 1964). However, as it was difficult to determine Al in TSP aerosols by the present analytical method, Ti, whose concentration showed a good correlation with that of Al, was employed as the normalization element instead of Al (Lowson et al., 1979). The EF value thus calculated indicated the metal elements analyzed in the present study were enriched in TSP aerosols, with respect to in the continental crust. The elemental concentrations in the continental crust were cited from a paper by Taylor (1964). In general, the EF value for naturally occurring elements derived from the crust was about 1, while the EF value for anthropogenic element was more than 10.
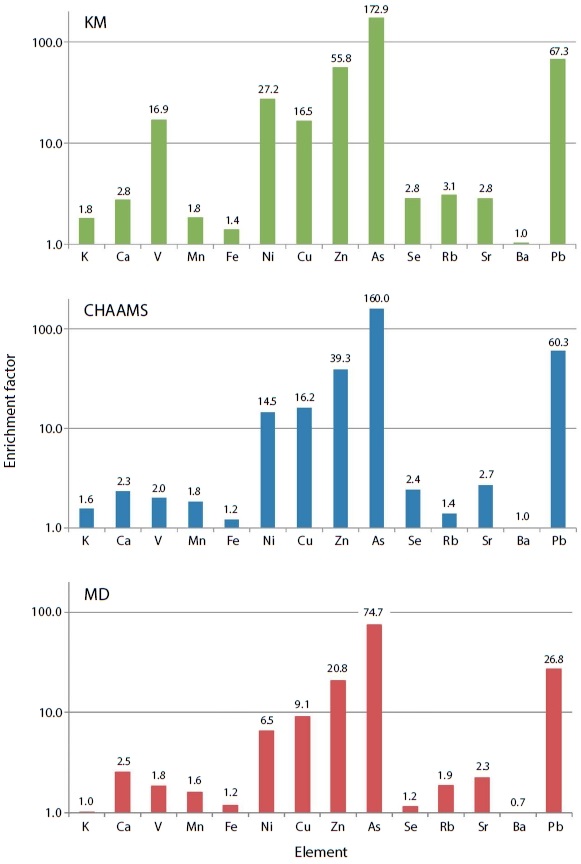
The average EF values of metal elements in TSP aerosol samples collected from June 2008 to June 2010 at the three islands in Okinawa are illustrated in Fig. 5. The EF values for various elements in TSP aerosol samples collected at each island showed almost similar trends to each other. As shown in Fig. 5, the EF values for K, Ca, V, Mn, Fe, Rb, Sr, and Ba were almost close to 1, except for the EF value for V in samples collected at KM, which could be due to the power plant near the sampling site. Therefore, it is suggested that these elements would mainly be included in naturally occurring TSP aerosols. On the contrary, the EF values for Ni, Cu, Zn, As, and Pb, which in the previous section were classified as the elements transported to the three islands in Okinawa from the Asian continent, were more than 10, although these values were smaller for the samples collected at MD than at the other two islands, owing to the long distance from the Asian continent. Thus, it is suggested that Ni, Cu, Zn, As, and Pb in TSP aerosols should be regarded as anthropogenic elements. In particular, the EF values for Zn, As, and Pb were remarkably high in samples collected at all three islands. The EF values for As were more than 70, and those for Pb and Zn were more than 20. It is reported that more than 65% of the primary energy consumption depends on the coal in China (NBSC, 2013). Generally, coal combustion is considered as the main emission source for As, Zn, and Pb in TSP aerosols in China (Kang et al., 2011; Okuda et al., 2008). According to Ge et al. (2004), the relative concentrations of Zn to As and of Pb to As in TSP aerosol samples, where these metals were present as a consequence of coal combustion, were 13-16 and 10-12, respectively. The annual average concentration ratio of Zn to As was considerably close to 10-14 in samples collected at CHAAMS, as seen in Table 1. The relative concentration of Pb to As also showed comparatively high values, although they were in the 4-5 range and thus smaller than those for those excepted in association with coal combustion. Therefore, the main emission source of anthropogenic TSP aerosols at the three islands in Okinawa would be coal combustion taking place in the Asian continent. In addition, Zn in TSP aerosols may also originate from tire abrasion particles and Cu from brake abrasion particles (Okuda et al., 2008). On the other hand, oil combustion is considered as the main emission source for Ni (Okuda et al., 2007). Although V is contained in TSP aerosols emitted by oil combustion, the EF values for V in TSP aerosol samples at CHAAMS and MD were 2.0 and 1.8, respectively. Furthermore, these values were smaller than those for Ni, as shown in Fig. 5. These results suggest that the presence of V in TSP aerosols is not just a consequence of human activity but also of natural processes. However, the EF value for V in TSP aerosol samples at KM was 16.9, a value considerably larger than those in the other two islands. It is considered that this result was influenced by local source emitted from oil combustion, probably taking place a power plant at KM. The EF for Se, which is regarded as anthropogenic elements in the previous section, was slightly larger than 1 at KM and CHAAMS and almost 1 at MD. These results suggest that the percentage of anthropogenic Se was extremely small, although TSP aerosols containing Se might come from the Asian continent.
3. 4 Dependence of the Average Concentrations of Metal Elements in TSP Aerosol Samples on the Direction of Air Mass Reaching the Sampling Sites, as Assigned by BT Calculation
The Asian continent is located to the west and the northwest of Okinawa, while the Pacific Ocean is located to its east and south. It is assumed that the elemental concentrations in TSP aerosols depend on the trajectory of the air mass reaching a sampling site. Therefore, for each sample collected at the three islands, we determined the direction of the relevant air mass. The average concentrations of As, Pb, Zn, Cu, V, and Ni in TSP aerosol samples in 2008-2010, which were regarded as anthropogenic elements, are shown in Fig. 6 with the direction of the air mass reaching the sampling sites, as assigned by BT calculation. As can be seen from Fig. 6, the analytical results for the samples at the three islands were similar to each other. As, Pb, Zn, and Cu in TSP aerosols at each sampling site showed higher average concentrations when the air mass came from the Asian continent: from the west, the northwest and the north, as shown in Fig. 6. In particular, As and Zn in TSP aerosol samples at KM, Pb and Cu in samples at CHAAMS showed higher concentrations when the air mass came from the west. In Fig. 5, the EF values for As, Pb, Zn, and Cu in TSP aerosols were higher than those for the other elements analyzed in the present study. These results suggest that most TSP aerosols containing these anthropogenic elements (As, Pb, Zn, and Cu) were transported to Okinawa from the Asian continent. On the other hand, the average concentration of Ni did not show any specific trend associated with the direction of the air mass. Therefore, Ni in the TSP aerosols might be more influenced by local emissions in each island than by any anthropogenic emission in the Asian continent.
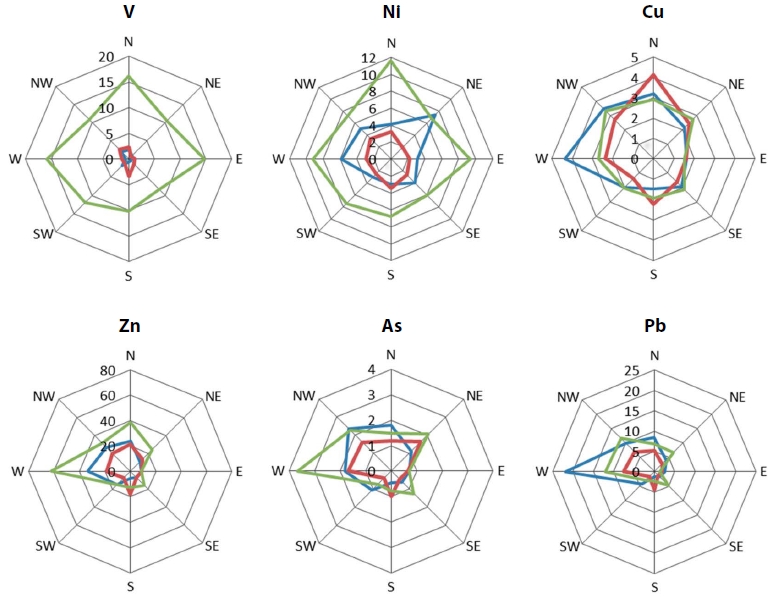
Average concentrations of V, Ni, Zn, Cu, As, and Pb in TSP aerosols and the direction of the air mass reaching the sampling sites at the three islands in Okinawa. Numbers indicate concentration of each element in TSP aerosols (ng/m3) from specific direction during July 2008 to June 2010. KM: green line, CHAAMS: blue line, MD: red line. The Asian continent is located between west and north of Okinawa, while the Pacific Ocean is between east and south.
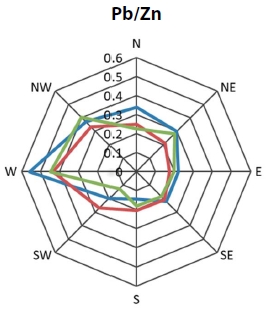
The concentration ratios of Pb/Zn for the TSP aerosol samples at the three islands for each air mass direction were investigated to look into on the location of their emission sources and the results of this analysis are reported in Fig. 7. It is known that the concentration ratio of Pb/Zn serves as a good index for the transport of aerosols from the Asian continent (Okuda et al., 2006). As can be seen from Fig. 7, the concentration ratio of Pb/Zn ranges between 0.6 and 0.4 in the air mass coming to the three islands from the west and between 0.3 and 0.4 in that coming to the three islands from the northwest and in that coming to CHAAMS from the north, while it is below 0.3 in the air mass coming from all other directions. Hioki et al. (2009) reported that concentration ratios of Pb/Zn are 0.2-0.3 in TSP aerosols generated in Japan, and 0.5-0.6 in those generated in the Asian continent. Therefore, the results in Fig. 7 suggest that TSP aerosols emitted in the Asian continent were transported with the air mass coming mainly from the west and, to a large extend, from the northwest. According to Tian et al. (2012), provincial emissions of heavy metals from coal combustion in China were relatively large in Hubei, Sichuan, Chongqing, Yunnan, Shanxi, Hubei, Henan, Jiangsu, and Shandong, which are located to the west or northwest of the three islands in Okinawa. On the other hand, the concentration ratios of Pb/Zn in TSP aerosol sample at CHAAMS were slightly higher in the air mass coming from the north; see Fig. 7. These results suggest that some TSP aerosols at CHAAMS might be often influenced by emission sources in Japan’s Kyushu district, in the Korean peninsula, or in the northeast district of China, all of which are located to the north of Okinawa.
4. CONCLUSION
Long-term monitoring of the concentrations of 15 metal elements in TSP aerosol samples at the three islands in Okinawa was carried out by ED-XRF using standard samples for calibration curve prepared by absorbing the certified reference material of urban aerosol (NIES, CRM No. 28) in a small chamber. The average concentrations of As, Pb, Zn, and Cu in TSP aerosol samples at each sampling site were higher in the air mass coming from the west, northwest and north, in other words, from the Asian continent. The EF values and concentration ratios indicate that most of the anthropogenic elements such as As, Pb, and Zn in TSP aerosol samples are derived from coal combustion in the Asian continent. Results from many studies performed at Main Island in Japan indicated that the pollutants were mainly transported there by the air mass coming from the northwest. However, the results from the present study confirm that Cu, Zn, As, and Pb in TSP aerosols were transported to the three islands in Okinawa by air mass not only from the northwest and north, but also from the west. These TSP aerosols transported from the Asian continent may influences not only the atmospheric environment but also the concentrations of trace metals in coastal seawater in Okinawa, which have to be kept extremely low to preserve the diverse and unique ecosystem in coral reefs.
Acknowledgments
We would like to thank Prof. S. Hatakeyama of Center for Environmental Science in Saitama and Dr. A. Takami of NIES, Japan for the use of CHAAMS. We would also like to thank Dr. A. Iida of the High Energy Accelerator Research Organization (KEK) for the support in the measurement of As in the TSP aerosols. This study was supported by the Grant-in-Aid for Scientific Research on Innovative Areas (No. 4003) and partly by a Grantin-Aid for Scientific Research (KAKENHI; #20310013 and #24651013) from the Ministry of Education, Culture, Sports, Science and Technology of Japan, and Environment Research and Technology Development Fund (B-0903) of the Ministry of the Environment, Japan, and research subject (2012P112) in KEK.
References
- Arakaki, T., Azechi, S., Somada, Y., Ijyu, M., Nakaema, F., Hitomi, Y., Handa, D., Oshiro, Y., Miyagi, Y., Tsuhako, A., Murayama, H., Higaonna, Y., Tanahara, A., Itoh, A., Fukushima, S., Higashi, K., Henza, Y., Nishikawa, Y., Shinjo, H., Wangh, H., (2014), Spatial and temporal variations of chemicals in the TSP aerosols simultaneously collected at three islands in Okinawa, Japan, Atmospheric Environment, 47, p479-485.
-
Arakaki, T., Kuroki, Y., Okada, K., Nakama, Y., Ikota, H., Kinjo, M., Higuchi, T., Uehara, M., Tanahara, A., (2006), Chemical composition and photochemical formation of hydroxyl radicals in aqueous extracts of aerosol particles collected in Okinawa, Japan, Atmospheric Environment, 40, p4764-4774.
[https://doi.org/10.1016/j.atmosenv.2006.04.035]

-
Chuang, M.-T., Chou, C. C.-K., Lin, N.-H., Takami, A., Hsiao, T.-C., Lin, T.-H., Fu, J.S., Pani, S.K., Lu, Y.-R., Yang, T.-Y., (2017), A simulation study on PM2.5 sources and meteorological characteristics at the northern tip of Taiwan in the early stage of the Asian haze period, Aerosol and Air Quality Research, 17, p3166-3178.
[https://doi.org/10.4209/aaqr.2017.05.0185]

- Ge, S., Xu, X., Chow, J.C., Watson, J., Sheng, Q., Liu, W., Bai, Z., Zhu, T., Zhang, J., (2004), Emission of air pollutions from household stoves: Honeycomb coal versus coal cake, Environmental Science and Technology, 38, p4612-4618.
-
Ghim, Y.S., Kim, J.Y., Chang, Y.-S., (2017), Concentration variations in particulate matter in Seoul associated with Asian dust and smog episodes, Aerosol and Air Quality Research, 17, p3128-3140.
[https://doi.org/10.4209/aaqr.2016.09.0414]

-
Handa, D., Nakajima, H., Arakaki, T., Kumata, H., Shibata, Y., Uchida, M., (2010), Radiocarbon analysis of BC and OC in PM10 aerosols at Cape Hedo, Okinawa, Japan, during long-range transport events from East Asian countries, Nuclear Instruments and Method in Physics B, 268, p1125-1128.
[https://doi.org/10.1016/j.nimb.2009.10.115]

- Hioki, T., Kimoto, T., Hasegawa, S., Mukai, M., Ohara, T., Wakamatsu, S., (2009), Analysis of long-range transported and local air pollution with trace metal concentration ratio in aerosols collected at Matsuyama, Osaka, and Tsukuba, Japan, Journal of Japan Society for Atmospheric Environment, 44, p91-101.
- Kang, Y., Liu, G., Chou, C.-L., Wong, M.H., Zheng, L., Ding, R., (2011), Arsenic in Chinese coals: distribution, modes of occurrence, and environmental effects, Science of the Total Environment, 412, p1-13.
-
Kim, B.-U., You, S., Kim, H.C., Lim, Y., Suh, I., Lee, J.-B., Woo, J.-H., Kim, S., (2017), Influence of different foreign emissions inventories on simulated, ground-level ozone in the Seoul metropolitan area during May 2014, Aerosol and Air Quality Research, 17, p3179-3193.
[https://doi.org/10.4209/aaqr.2017.05.0165]

- Lowson, D.R., Winchestor, J.W., (1979), A standard crustal aerosol as a reference for elemental enrichment factors, Atmospheric Environment, 13, p925-930.
-
Mochida, M., Nishita-Hara, C., Kitamori, Y., Aggarwal, S.G., Kawamura, K., Miura, K., Takami, A., (2010), Size-segregated measurements of cloud condensation nucleus activity and hygroscopic growth for aerosols at Cape Hedo, Japan, in spring 2008, Journal of Geophysical Research, 115(D21), D21207.
[https://doi.org/10.1029/2009jd013216]

-
Nakano, K., Itoh, A., Oshiro, Y., Azechi, S., Somada, Y., Handa, D., Miyagi, Y., Arakaki, T., Tanahara, A., (2018), Preparation of standard materials of aerosol particles for X-ray fluorescence analysis using a small chamber sampling unit, X-ray Spectrometry, 47, p450-458.
[https://doi.org/10.1002/xrs.2973]

- NBSC (National Bureau of Statics of China), (2013), China Statistical Yearbook 2012, China Statics Press, Beijing, China.
- Okada, K., Kuroki, Y., Nakama, Y., Arakaki, T., Tanahara, A., (2006), Wavelength-dependence of photochemical formation of Fe(II) in aqueous extracts of aerosol particles collected in Okinawa, Japan, Environmental Science and Technology, 40, p7790-7795.
- Okuda, T., Katsuno, M., Naoi, D., Nakao, S., Tanaka, S., He, K., Ma, Y., Lei, Y., Jia, Y., (2008), Trends in trace metal concentrations in aerosols collected in Beijing, China from 2001 to 2006, Chemosphere, 72, p917-924.
-
Okuda, T., Nakao, S., Katsuno, M., Tanaka, S., (2007), Source identification of nickel in TSP and PM2.5 in Tokyo, Japan, Atmospheric Environment, 41, p7642-7648.
[https://doi.org/10.1016/j.atmosenv.2007.08.050]

-
Okuda, T., Tenmoku, M., Kato, J., Mori, J., Sato, T., Yokochi, R., Tanaka, S., (2006), Long-term observation of trace metal concentration in aerosols at a remote island, Rishiri, Japan by using inductively coupled plasma mass spectrometry equipped with laser ablation, Water, Air, and Soil Pollution, 174, p3-17.
[https://doi.org/10.1007/s11270-005-9000-2]

- Saito, K., Sera, K., Shimomura, K., Futatsugawa, S., Kitagawa, M., (2005), Simultaneous multi-element analysis of Atmospheric Particles Collected on a Quartz-fiber Filter by PIXE, Radioisotopes, 54, p115-121.
-
Shimada, K., Shimada, M., Takami, A., Hasegawa, S., Fushimi, A., Arakaki, T., Watanabe, I., Hatakeyama, S., (2015), Mode and place of origin of carbonaceous aerosols transported from east Asia to Cape Hedo, Okinawa, Japan, Aerosol and Air Quality Research, 15, p799-813.
[https://doi.org/10.4209/aaqr.2014.09.0190]

-
Takami, A., Miyoshi, T., Shimono, A., Kaneyasu, N., Kato, S., Kajii, Y., Hatakeyama, S., (2007), Transport of anthropogenic aerosols from Asia and subsequent chemical transformation, Journal of Geophysical Research, 112(D22), D22S31.
[https://doi.org/10.1029/2006jd008120]

-
Takiguchi, Y., Takami, A., Sadanaga, Y., Lun, X., Shimizu, A., Matsui, I., Sugimoto, N., Wang, W., Bandow, H., Hatakeyama, S., (2008), Transport and transformation of total reactive nitrogen over the East China Sea, Journal of Geophysical Research, 113(D10), D10306.
[https://doi.org/10.1029/2007jd009462]

- Taniguchi, Y., Shimada, K., Takami, A., Lin, N.-H., Chan, C.K., Kim, Y.P., Hatakeyama, S., (2017), Transboundary and local air pollutions in western Japan distinguished on the basis of ratios of metallic elements in size-segregated aerosols, Aerosol and Air Quality Research, 17, p3141-3150.
-
Tatsuta, S., Shimada, K., Chan, C.K., Kim, Y.P., Lin, N.-H., Taka-mi, A., Hatakeyama, S., (2017), Contributions of long-range transported and locally emitted nitrate in size-segregated aerosols in Japan at Kyushu and Okinawa, Aerosol and Air Quality Research, 17, p3119-3127.
[https://doi.org/10.4209/aaqr.2016.12.0587]

-
Taylor, S.R., (1964), Abundance of chemical elements in the continental crust: new table, Geochimica Cosmochimica Acta, 28, p1273-1285.
[https://doi.org/10.1016/0016-7037(64)90129-2]

-
Tian, H., Cheng, K., Wang, Y., Zhao, D., Lu, L., Jia, W., Hao, J., (2012), Temporal and spatial variation characteristics of atmospheric emissions of Cd, Cr, and Pb from coal in China, Atmospheric Environment, 50, p157-163.
[https://doi.org/10.1016/j.atmosenv.2011.12.045]

-
Verma, R.L., Kondo, Y., Oshima, N., Matsui, H., Kita, K., Sahu, L.K., Kato, S., Kajii, Y., Takami, A., Miyakawa, T., (2011), Seasonal variations of the transport of black carbon and carbon monoxide from the Asian continent to the western Pacific in the boundary layer, Journal of Geophysical Research, 116(D21), D21307.
[https://doi.org/10.1029/2011jd015830]

-
Yeh, C.-F., Lee, C.-L., Brimbelecomble, P., (2017), Effects of seasonality and transport route on chemical characteristics of PM2.5 and PM2.5-10 in the East Asian Pacific rim region, Aerosol and Air Quality Research, 17, p2988-3005.
[https://doi.org/10.4209/aaqr.2016.12.0569]

