Development of a Smart Air Quality Monitoring System and its Operation
Copyright © 2019 by Asian Journal of Atmospheric Environment
This is an open-access article distributed under the terms of the Creative Commons Attribution Non-Commercial License (http://creativecommons.org/licenses/by-nc/4.0/), which permits unrestricted non-commercial use, distribution, and reproduction in any medium, provided the original work is properly cited.
Abstract
Indoor air quality control becomes a critical role in protecting human life due to a significant increase in indoor living time with industrial development. However, air purifier and ventilation systems are installed in many indoor places, and qualities of air are not guaranteed without effective monitoring systems. In this study, we developed a smart indoor air quality monitoring device, measuring components of PM10, PM2.5, PM1, CO, CO2, VOCs, temperature and humidity. The smart air quality monitoring system is commutated with a developed smartphone application using short and long distance communication modules. The smart application basically provides air quality information (daily, monthly, yearly), air management methods, and emerging environmental issues. For the system verification, we tested the developed air quality monitoring system with other reliable measuring devices. As results, the gaps between our developed system and other reliable measuring devices are PM10 (±4%), PM2.5 (±4%), CO (±1%), CO2 (±1%), VOCs (±2%), temperature (±1%) and humidity (±2%). We found that the developed smart air quality monitoring system is sufficiently reliable comparing to other measuring devices. Therefore, the smart air quality monitoring system would help improve indoor air quality in real time and can be used for future air quality prediction.
Keywords:
Smart air quality monitoring system, Air quality sensors, Wireless communication, Indoor air quality, Smart device application1. INTRODUCTION
Alongside economic development and increasing environmental pollution, indoor air qualities have become one of the world’s largest environmental problems. People spend approximately 90 percent of their time indoors such as homes, gyms, schools and work places, where the concentrations of some pollutants are often 2 to 5 times higher than typical outdoor concentrations (U.S. EPA, 1989). The Sick Building Syndrome (SBS) is a recent disease of sleepiness, difficult concentrating, cough, sore throat, chest tightness, eye focusing problems and nasal irritation due to indoor air qualities. Meier et al. (2015) investigated indoor and outdoor air qualities of PM10, PM2.5, NO2 and the result indicates that home characteristics are significantly related to outdoor and indoor pollution. Gil et al. (1995) studied outdoor pollution impact on indoor air qualities and resulted that indoor concentrations of CO were higher and PM5 concentrations were similar indoor and outdoor. Many studies have reported the association between exposures to indoor pollutants. CO is toxic, and short-term exposure to high CO levels indoor can be lethal (Raub et al., 2000). Asthma, allergic and respiratory symptoms among children in school and daycare centers often occur due to polluted indoor air (Breysse et al., 2010; Wu et al., 2009). Vicente et al. (2017) found that indoor PM10 concentrations were twice higher than outdoor PM10 concentrations even with two installed ventilated systems. Indoor air qualities are largely dependent on building usages and ventilation systems of the buildings. Liu et al. (2004) investigated PM10 and PM2.5 in various residential and commercial buildings and found that restaurants, dormitories and classrooms contained more PM10 and PM2.5 than supermarkets, computer rooms, offices and libraries. Long term exposures to poor air qualities are likely to cause increased short and long term health problems particularly for vulnerable groups such as children, young adults, and the elderly or those suffering chronic respiratory or cardiovascular diseases (Adel et al., 2016; Simoni et al., 2015). Indoor pollutants such as ozone, particulate matter, nitrogen dioxide, tobacco smoke, sulfur dioxide, carbon monoxide and dampness can cause and exacerbate human health ranging from acute and chronic respiratory symptoms to cancer (Vicente et al., 2004). Among these symptoms, the three most common ones are dry eyes, dry throats and headache (Liu et al., 2004). Some studies revealed various indoor air contaminants including odorous, non-odorous gases, vapors, and particles (Ghorani-Azam et al., 2016). They suggested that several toxic and potentially toxic substances could be responsible for health effects (Liu et al., 2004).
There is a growing demand on appropriate air monitoring systems while providing suitable air quality information in time to individuals, which can help reduce damages by polluted air. However, most air quality monitoring systems are still expensive, time-consuming, and often unable to provide air quality information in time. Combination of the internet of things (IOT) and sensor technologies enhance the development of small, low-cost, and real time air quality monitoring systems. Low cost air quality monitors often implement real-time monitoring and visualization for smartphones and tablets to help inform the users (Hasenfratz et al., 2012). Lambebo et al. (2014) reported that a real time monitoring system composed of CO, CO2 and CH4 sensors successfully performed and measured temperature and greenhouse gas concentrations. Jiang et al. (2013) developed a real time indoor CO2 sensing system and successfully tested its reliability. Kashid et al. (2016) proposed a real time indoor air quality system equipped with CO2, NO2, SO2, VOCs, dust, temperature and humidity. Abraham et al. (2014) developed a low-cost indoor air quality monitoring wireless sensor network system using Arduino, XBee modules, and CO2, VOC, temperature and humidity sensors. They demonstrated the performance and usefulness of the system by comparing measurement results of their system and a professional-grade air quality measurement device.
In this paper, we present an indoor air quality monitoring system equipped with air quality sensors, wireless communication modules, displays and smartphone applications. The developed system is capable of measuring PM10, PM2.5, PM1, VOCs, CO, CO2, temperature and humidity in real time. The data from the developed air quality system is forwarded to the smartphone application, then to the cloud sever by using wireless communications as Bluetooth, Wi-Fi and Lora. In addition, we conveniently designed a smartphone monitoring application for providing the information of indoor and outdoor air qualities, pollution warnings, adequate actions and weather conditions.
2. METHODOLOGY
2. 1 Process of Smart Air Quality Monitoring System
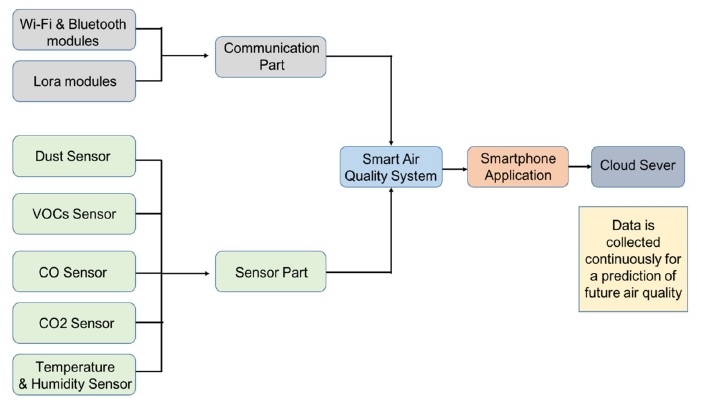
The overall system architecture of the developed smart air quality monitoring system is shown in Fig. 1. The main components of the system include a sensor part, a wireless communication part and a smart application part. The sensor part is consist of a dust sensor, a carbon monoxide sensor, a carbon dioxide sensor, a volatile organic compounds sensor, and a temperature and humidity sensor. The sensor part measures PM10, PM2.5, PM1, VOCs, CO, CO2, temperature and humidity, and then the measured data is forwarded to the smart application by a short range communication device (Bluetooth, Wi-Fi) or a long range communication device (Lora). In the application, the display shows the measured data to the user, and then the measured data in the application and transmitted to the server, which provides warnings and hourly, daily, yearly data to the application.
2. 2 Hardware of Smart Air Quality Monitoring System
The hardware of the developed smart air quality device is divided into a sensor part and a communication part.
The sensor part is composed of a PM sensor, a CO2 sensor, a CO sensor, a VOCs sensor, and a temperature and humidity sensor. The PM sensor (PM 2008M) is able to detect PM10, PM2.5, and PM1 by light scattering methods. The CO2 (CM-1106) sensor detects carbon dioxide from 0 ppm to 2000 ppm by non-dispersive infrared absorption methods. The CO sensor (EC-750) detects carbon monoxide ranging from 0 to 1000 ppm by electrochemical methods. The VOCs (FIS4220-AQ1) sensor measures ranging from 0 to 10 ppm using electrochemical methods. The temperature and humidity sensor (SHT30-DIS-B) measures temperature from -40°C to 125°C and humidity from 0% to 100%.
In the communication part, the Bluetooth and Wi-Fi module (ESP-WROOM 32) is installed for a short distance communication and Lora module (LOM 202A) is installed for a long distance communication. Table 1 indicates the detailed characteristics of the used sensors.
2. 3 Software of Smart Air Quality Monitoring System
Functions of the smartphone air quality application are to obtain the monitoring data from the smart air quality device, to clearly display it to the user and to transmit it to the server. Finally, the server provides the monitoring data, warnings, and adequate actions to all users.
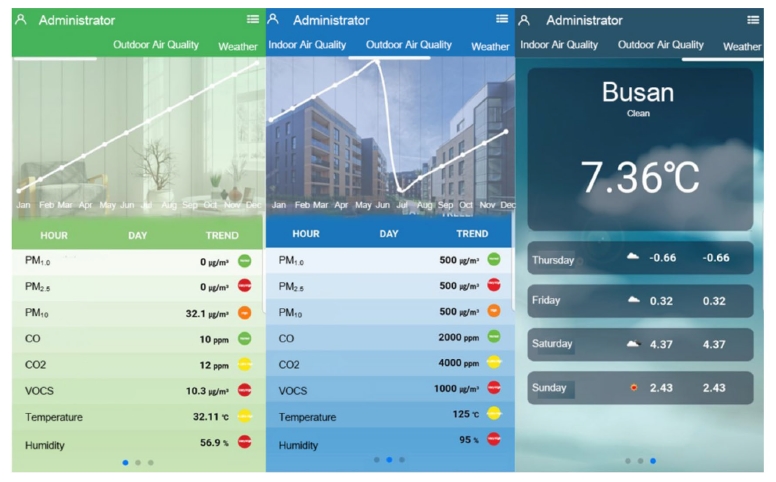
The air quality application is composed of an indoor air quality screen, an outdoor air quality screen, a weather screen and an environmental information screen. The indoor air quality screen provides the indoor air quality data measured by the developed smart air quality device. The outdoor air quality screen displays outdoor air qualities from Air Korea Open api. The weather screen provides weather conditions from Korea Meteorological Administration open api. In the environmental information screen, issues related to the indoor environment are provided and updated by the sever operator.
3. RESULTS AND DISCUSSION
Overall structure of the developed smart air quality system is divided into hardware and software production parts. After the configuration of both parts, reliability tests of the smart air quality system were performed for proper operating verification.
3. 1 Fabrication of Smart Air Quality System
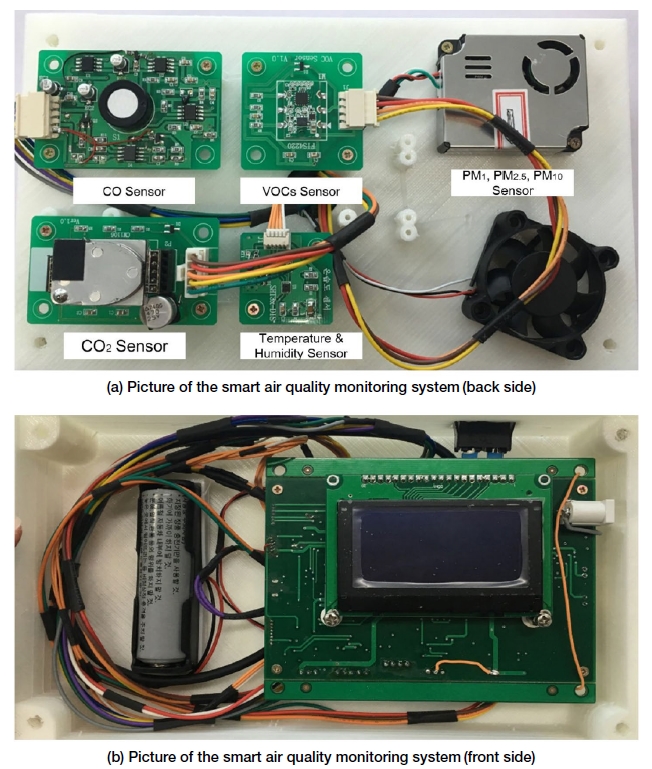
As shown In Fig. 3, the smart air quality monitoring system contains the dust sensor, the CO2 sensor, the CO sensor, the VOCs sensor, and the temperature & humidity sensor. The dust sensor is a PM2008M laser particle sensor module, which use light scattering principle to measure and calculate PM1, PM2.5, and PM10 with unit volume on the air. It works with DC 5 V±0.1 V, at temperature from -10°C up to 50°C, at humidity from 0 to 92% RH, and with 1 second response time. The CO sensor is an SS2128 electrochemical sensor, which works with DC 5 V, at temperature from -20°C up to 50°C, at humidity from 15% to 90% RH, and with 25 seconds response time. The CO2 sensor is a CM1106 non-dispersive infrared sensor, which works with DC 5 V±0.1 V, at temperature from -10°C up to 50°C, at humidity from 0 to 95% RH, and with 120 seconds response time. The VOCs sensor is a FIS4220-AQ1 semiconductor sensor, which works with DC 3.3V±0.5%, at temperature from -10°C up to 50°C, at humidity from 10 to 90% RH, and with 2 seconds response time. The temperature and humidity sensor is an SHT30-DIS-B digital sensor which works with DC 3.3 V±0.5%, at temperature from -40°C up to 125°C, at humidity from 0 to 100% RH, and with 2 seconds response time. As shown in Fig. 3-b, communication modules, display screen, and lithium ion battery are installed. The short distance communication module is an ESP32 WROOM module supporting both Wifi and Bluetooth, which works with DC 2.2 V-3.6 V, at temperature from -40°C up to 85°C, and with 0.4 second response time. The long distance communication module is a LOM202A module, which works with DC 3.0 V-3.6 V and at temperature from -30°C up to 70°C. The used display is a 2.8 inch LCD with 128×64 pixels.
The interference wall is constructed due to minimize mutual interference between sensors and other units such as the display, the battery and the communication modules.
The output screen presents dust, CO2, CO, and VOCs concentrations, and temperature, and humidity readings. The pollution value is basically set according to the WHO indoor air quality standard (WHO, 2010). When the set standard values are exceeded, red alarms display to inform the exceeding pollution limits.
Real time measured data in the smart air quality monitoring system are forwarded to the smartphone application, and then the data are transmitted to the server. The sever stores all the data for a future prediction.
3. 2 Fabrication of Air Quality Application
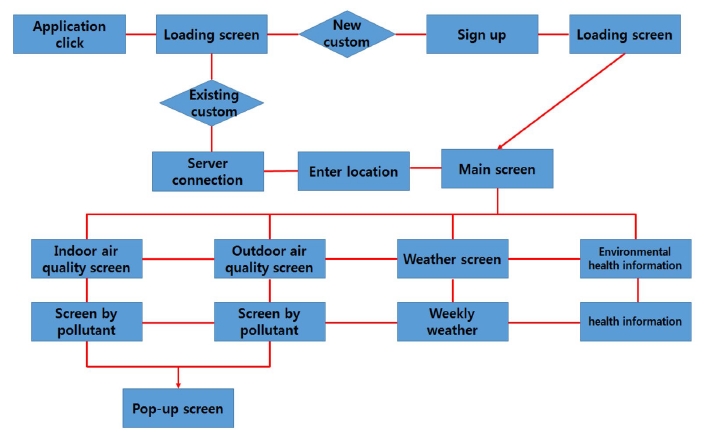
The air quality monitoring application, for which the flow diagram of the application process is shown in Fig. 4, was created using Android’s list and scroll views. In order to acquire many indoor air quality information, a data queue was constructed and used for a packet processing. An open library was created to display data plots with hours, days and months. A notification center is used to display alarms and warnings using a basic alarm sound of Android by the set values. A local search function by using api of Daum map to display indoor air quality of maps on the screen. Weather information was used from an open api of Meteorological Agency. A basic server is built on a general computer to store user information and user air quality data. When users connect to the screen, the open api is called to provide information in the near area and near time zone. The push message is implemented to provide information according to the deteriorated indoor and outdoor air qualities based on the registered user’s location information.
3. 3 Verification of Air Quality Monitoring System
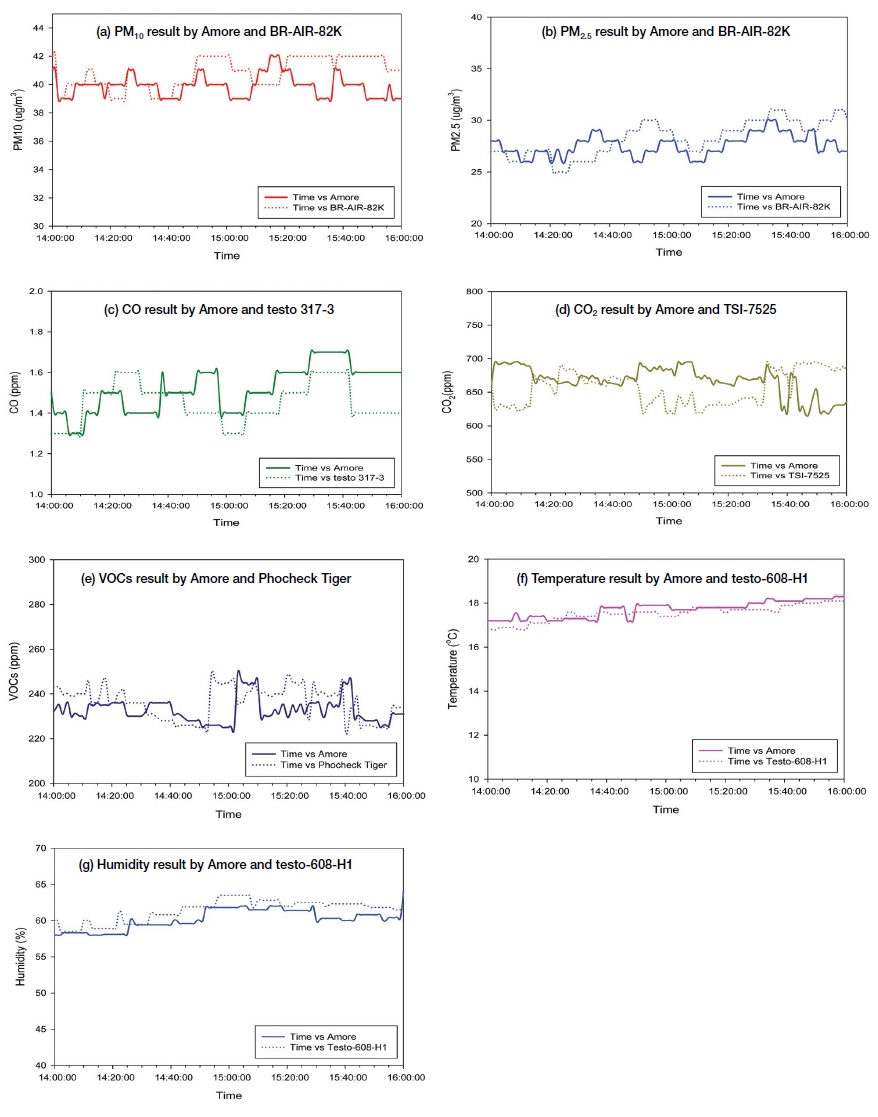
A reliability test of the smart air quality system was performed for the verification of the proper operation. In the test, concentrations of PM10, PM2.5, CO, CO2, VOCs, and readings of temperature and humidity were obtained for 2 hours with our developed smart air quality system named “Amore” and other reliable measuring devices. PM10 and PM2.5 were measured by Amore and BR-AIR-82K from Bramc Co., Ltd. CO was measured by Amore and testo 317-3 from Testo Co., Ltd. CO2 was tested by Amore and TSI-7525 from TSI Co., Ltd. VOCs was tested by Amore and Phocheck Tiger from Senko Co., Ltd. Temperature and humidity were measured by Amore and testo-608-H1 from Testo Co., Ltd. The results were shown in Fig. 5.
In the reliability test, it was observed that differences of Amore and other reliable devices were only ±4% for PM10 and PM2.5, ±1% for CO, ±1% for CO2, ±2% for VOCs, ±1% for temperature and ±2% for humidity. Thus, it is found that the developed air quality monitoring system “Amore” can produce reliable data as other reliable devices do.
4. CONCLUSION
The developed smart air quality monitoring system is to measure several indoor air pollution levels and to inform the users about pollution information. Therefore, the users could minimize the contact time from the polluted air and be less exposed to pollution damage.
This study developed the PM1, PM2.5, PM10, CO, CO2, VOCs, temperature and humidity monitoring system to create safe work environment and living environment. For the appropriate communication to the smart application, a short distance communication (Bluetooth, Wi-Fi) and a long distance communication (Lora) were installed. The communication sequence is the transfer of data from the smart air monitoring device to the application and finally to the server. The gained data from the developed device is stored in the cloud sever which can be used for the future air quality prediction. For the verification of the system, the data transmission from the air quality monitoring device was checked and found that all data were comparable those from other reliable devices.
This smart air quality monitoring system can help not only significantly reduce indoor air pollution exposure of people but also directly or indirectly reduce air pollution damage by communicating monitoring data and countermeasure methods. The development of this technology will bring economic, social and environmental benefits to the development of smart indoor air systems by combining IOT and sensor technologies.
References
-
Abraham, S., Li, X., (2014), A Cost-Effective Wireless Sensor Network System for Indoor Air Quality Monitoring Applications, Procedia Computer Science, 34, p165-171.
[https://doi.org/10.1016/j.procs.2014.07.090]

- Adel, G.A., Bamdad, R.Z., Mahdi, B.M., (2016), Effects of air pollution on human health and practical measures for prevention in Iran, Journal of Research in Medical Sciences, 2165, p1735-1995.
- Air Korea Open api, (2018, July, 15), http://www.airkorea.or.kr/.
-
Breysse, P.N., Diette, G.B., Matsui, E.C., Butz, A.M., Hansel, N.N., McCormack, M.C., (2010), Indoor air pollution and asthma in children, Proceedings of the American Thoracic Society, 7, p102-106.
[https://doi.org/10.1513/pats.200908-083RM]

-
Cincinelli, A., Martellini, T., (2017), Indoor Air Quality and Health, Internal Journal of Environmental Research Public Health, 14, p1286-1292.
[https://doi.org/10.3390/ijerph14111286]

- Gil, L., Adonis, M., Caceres, D., Moreno, G., (1995), Impact of outdoor pollution on indoor air quality, the case of downtown Santiago (Chile), Revista Medica Chile, 123, p411-425.
-
Ghorani-Azam, A., Riahi-Zanjani, B., Balali-Mood, M., (2016), Effects of air pollution on human health and practical measures for prevention in Iran, Journal of Research in Medical Sciences: the official journal of Isfahan University of Medical Sciences, 21, p65.
[https://doi.org/10.4103/1735-1995.189646]

- Hasenfratz, D., Saukh, O., Sturzenegger, S., Thiele, L., (2012), Participatory Air Pollution Monitoring Using Smartphones, 2nd International Workshop on Mobile Sensing, p1-5.
-
Jiang, Y., Li, K., Piedrahita, R., Xiang, Y., Tian, L., Mansata, O., Lv, Q., Dick, R.P., Hannigan, M., Shang, L., (2013), User-Centric Indoor Air-Quality Monitoring on Mobile Devices, Association for the Advancement of Artificial Intelligence, p11-30.
[https://doi.org/10.1609/aimag.v34i2.2472]

- Kashid, A., Ankalgi, P., Jamdade, K., Sable, S., Shinde, S., (2016), Real Time Indoor Air Quality Monitoring System, International Journal of Innovative Research in Electrical, Electronics, Instrumentation and Control Engineering, 4, p36-38.
- Korea Meteorological Administration open api, (2018, July, 15), http://www.kma.go.kr/.
- Lambebo, A., Haghani, S., (2014), A wireless sensor network for Environmental Monitoring of Greenhouse Gases, In Proceedings of the ASEE Zone I Conference, p1-4.
-
Liu, Y., Chen, R., Shen, X., Mao, X., (2004), Wintertime indoor air levels of PM10, PM2.5 and PM1 at public places and their contributions to TSP, Environment International, 30, p189-197.
[https://doi.org/10.1016/S0160-4120(03)00173-9]

-
Meier, R., Eelens, M., Phuleria, H.C., Ineichen, A., Corradi, E., Davey, M., Fierz, M., Ducret-Stich, RE., Aquilera, I., Schindler, C., Rochat, T., Probst-Hensch, N., Tsai, M.Y., Kunzli, N., (2015), Differences in indoor versus outdoor concentrations of ultrafine particles, PM2.5, PM absorbance and NO2 in Swiss homes, Journal of Exposure Science & Environmental Epidemiology, 25, p499-505.
[https://doi.org/10.1038/jes.2015.3]

-
Nazaroff, W.W., (2013), Exploring the consequences of climate change for indoor air quality, Environmental Research Letters, 8, p015022.
[https://doi.org/10.1088/1748-9326/8/1/015022]

-
Pegas, P.N., Alves, C.A., Evtyugina, M.G., Nunes, T., Cerqueira, M., Franchi, M., Pio, C.A., Almeida, S.M., Freitas, M.C., (2011), Indoor air quality in elementary schools of lisbon in spring, Environmental Geochemistry and Health, 33, p455-468.
[https://doi.org/10.1007/s10653-010-9345-3]

-
Raub, J.A., Mathieu-Nolf, M., Hampson, N.B., Thom., S.R., (2000), Carbon monoxide poisoning - a public health perspective, Toxicology, 145, p1-14.
[https://doi.org/10.1016/S0300-483X(99)00217-6]

-
Schieweck, A., Uhde, E., Salthammer, T., Salthammer, L.C., Morawska, L., Mazaheri, M., Kumar, P., (2018), Smart homes and the control of indoor air quality, Renewable and Sustainable Energy Reviews, 94, p705-718.
[https://doi.org/10.1016/j.rser.2018.05.057]

- Simoni, M., Baldacci, S., Maio, S., Cerrai, S., Sarno, G., Viegi, G., (2015), Adverse effects of outdoor pollution in the elderly, Journal of Thoracic Disease, 7, p34-45.
-
Tasaka, M.P., Siskos, A.P., Siskos, P.A., (2011), Indoor Air pollutant and the Impact on Human Health, Dr. Nicolas Mazzeo (Ed.), Chemistry, Emission Control, Radioactive Pollution and Indoor Air Quality, In Tech.
[https://doi.org/10.5772/18806]

- U.S. Environmental Protection Agency, (1989), Report to Congress on indoor air quality: Volume 2. EPA/400/1-89/001C, Washington, DC.
-
Vicente, E.D., Ribeiro, J.P., Custódio, D., Alves, C.A., (2017), Assessment of the indoor air quality in copy centres at Aveiro, Portugal, Air Quality, Atmosphere and Health, 10, p117-127.
[https://doi.org/10.1007/s11869-016-0401-8]

- World Health Organization, (2010), WHO Guidelines for Indoor Air Quality: Selected Pollutants, Retrieved from http://www.euro.who.int/data/assets/pdf_file/0009/128169/e94535.pdf.
-
Wu, F.F., Siebers, R., Chang, C.F., Hsieh, S.W., Wu, M.W., Chen, C.Y., Pierse, N., Crane, J., (2009), Indoor allergens and microbial bio-contaminants in homes of asthmatic children in central Taiwan, Journal of Asthma, 46, p745-749.
[https://doi.org/10.1080/02770900903082597]

- Žuškin, E., Schachter, E., Mustajbegović, J., Pucarin-Cvetković, J., Doko-Jelnić, J., Mućić-Pucić, B., (2009), Indoor air pollution and effects on human health, Periodicum Biologorum, 111, p37-40.

