Assessing the Impact of Locally Produced Aerosol on the Rainwater Composition at the Gosan Background Site in East Asia
Abstract
It is often assumed that atmospheric observations at remote sites represent long-range transport of airborne material, and local influences are overlooked. We evaluated the impact of local input on the rainwater composition at Gosan Station, a strategic site for monitoring the continental outflow from Asia. We analyzed a 14-year record of rainwater chemical composition archived by the Korea Meteorological Administration and detected local terrestrial contribution for nitrate, sulfate and ammonium. We also measured the chemical composition of rainwater sampled simultaneously at multiple locations within the premises of the Gosan Station, from which local influence with meter-scale spatial heterogeneity could be discerned. We estimate that the local input accounted for at least ~10% of the wet deposition of nitrogen and ~12% of the wet deposition of sulfur during the 14 years. This highlights the significance of the local influence, which should be carefully assessed when interpreting atmospheric observations at this site.
Keywords:
Local sources, Local aerosol, Rainwater chemistry, Background atmosphere, Wet deposition1. INTRODUCTION
Atmospheric transport of anthropogenic and natural emissions is of great concern due to trans-national boundary air pollution and climate change at regional and global scales. Asia with its rapid economic growth has become a particularly important source region of global anthropogenic emissions, whose transport and consequent environmental and climatological effects have received increasing attention (Carmichael et al., 2012). The Gosan Station, a remote site located on the western tip of Jeju Island in the northwestern margin of the Pacific, is regarded as an ideal location to monitor the continental outflow from the Asian continent under the influence of the prevailing westerlies (Chuang et al., 2003; Carmichael et al., 1997). As in other remote island sites (e.g. Hanimaadhoo and Gan in the Maldives (Ramanathan et al., 2007) and Mauna Loa in Hawaii (Perry et al., 1999)), local anthropogenic emissions are low at this site. Accordingly, several international projects - e.g., Atmospheric Brown Clouds (ABC) (Cyranoski and Fuyuno, 2005), Aerosol Characterization Experiment (ACE) (Huebert et al., 2003), Advanced Global Atmospheric Gases Experiment (AGAGE) (Kim et al., 2012) and Acid Deposition Monitoring Network in East Asia (EANET, 2011) - have investigated the physical and chemical properties of continental emissions, tracked their sources and assessed their impacts. However, a careful assessment of the local influence is a prerequisite, particularly at a windy site like Gosan Station, since wind conditions can locally generate aerosols and transport them to the monitoring site. For example, wind-driven production and transport of local aerosols produced rainwater composition that varied with sampling height at an urban site in India (Kulshrestha et al., 2005) and caused meter-scale spatial heterogeneity of rainwater composition at a coastal site in Ireland (Losno et al., 1998). These observations demonstrate the introduction of local aerosols by wind, their heterogeneous dispersion in the atmosphere and their spatially uneven deposition on the surface.
In this study, we investigated the influence of local aerosols at Gosan Station as a function of local wind conditions. Situated on the coast of an island, the local influence is likely dominated by marine aerosols. However, its location on the western end of the island means that easterly winds deliver additional aerosols produced locally in the island’s interior. The magnitude of local impact would be highly dependent on the wind direction, and for this reason Gosan Station is well-suited for examining the local influence.
The chemical composition of rainwater is a good indicator of aerosols present in the air column (Granat et al., 2002). At Gosan Station, the aerosols should be primarily from the continental outflow plus some as-yet-undetermined local input. The two major local sources of aerosols - seawater and farmland - have distinct chemical makeup and modify the rainwater composition in different ways. Marine aerosols elevate sodium (Na+), chloride (Cl-) and sulfate (SO42-) concentrations in proportion to their abundances in seawater. Anthropogenic activity is generally the major source for nitrate (NO3-), non-sea salt sulfate (nss-SO42-=SO42--0.06028×Na+, in μmol L-1) and ammonium (NH4+) in rainwater(EANET, 2011). However, it is unlikely that local emissions of NOx and SOx in Jeju Island are important sources of NO3- and nss-SO42- in rainwater at Gosan Station. First, NOx and SOx emissions from Jeju Island are very low, accounting for ~1% of the total emission from Korea (NIER, 2011). Second, travel time from their sources to Gosan Station is too short to oxidize them into NO3- and SO42-. Considering the mean wind speed of 7 m s-1 and the size of the island (<75 km), emissions from the island’s interior will pass over Gosan within 3 hours. Therefore, the contribution of local sources would be in the form of NO3-- and SO42--containing aerosols rather than gaseous emissions. Considering the land-use in Jeju, fertilizers are the most probable source for NO3- and SO42-, as well as for NH4+, but recycling of aerosols deposited in Jeju Island after long-range transport cannot be neglected. Together we will call them the “terrestrial” source.
We took four different approaches in this study. First, with the 14-year database for major ion composition of rainwater monitored at Gosan Station, we analyzed the relationship between the rainwater composition and wind conditions and specifically whether input of local aerosols from the eastern terrestrial sources led to elevation of NO3 -, nss-SO4 2- and NH4 + contents in rainwater. Second, we examined the meter-scale spatial variability of rainwater composition by collecting rainwater simultaneously at multiple sites within the Gosan Station. Third, the rainwater composition was compared with previously reported aerosol composition data. Lastly, we present a quantitative assessment of the local influence on the wet deposition of nitrate, sulfate and ammonium. With a quantitative estimate of the local influence, one can better characterize the long-range transport of the continental emission from Asia and enable comparison between observational data and computer-based acid deposition models dedicated to long-range transport (Wang et al., 2008).
2. METHODS
2. 1 Study Area
At Gosan Station (33.292°N, 126.162°E), located on top of a ~70 m high cliff on the western coast of Jeju Island in Korea, several atmospheric monitoring devices have been installed in and on the rooftops (3-4m above the ground) of shipping container buildings and on two tower platforms 10 m and 15 m high (Fig. 1). The mean annual precipitation is about 1,100 mm, half of which falls during the summer season. This coastal site is windy with a mean speed of 7 m s-1. Land use around the site is primarily agricultural with scattered grassland and trees. There are two small villages near the site, 0.5 km to the southeast and 2 km to the northeast, with less than 600 residents in each and without any large fossil fuel-based industry.

The location of the wet-only rain collector and the wind sector division (I to VIII) at Gosan Station in Jeju Island, Korea. Additional rain samples were collected at four sites (T1, T2, F1 and F2) all within 35 m of each other. The inset shows the rainwater sampling sites in Korea mentioned in the text.
2. 2 Rainwater Chemistry Database and Meteorological Data
The rainwater chemistry data set for Gosan Station was provided by the Korea Meteorological Administration (KMA). It includes precipitation (mm), electrical conductivity (μS cm-1), pH and concentrations (μmol L-1) of major ions (F-, Cl-, NO3-, SO42-, Na+, NH4+, K+, Mg2+, Ca2+). The data set covers the period from October 1998 to December 2011, during which time 540 individual rain samples were collected using a wet-only collector on a daily basis at 9:00 a.m. The position of the collector is marked on Fig. 1. The mouth of the collector is ~1 m above ground. The major ions were analyzed using ion chromatography and validated according to the guidelines of the World Meteorological Organization Global Atmosphere Watch Precipitation Chemistry Programme (KMA, 2012).
The mean wind direction and speed during the rain events were calculated using the automatic weather station (AWS) data archived by KMA from October 1999 to present. The AWS data set includes the 10-minute mean wind direction (degree) and speed (m s-1), daily cumulative precipitation (mm) and 10-minute interval rain sensing signal (whether it is raining or not). Since the wet-only rain collector opens its lid only while the rain sensor is actuated, we averaged the wind direction and speed only for the ‘raining’ intervals. This averaging was carried out for the 493 (out of 540) samples for which AWS data were available.
The air mass back trajectory analysis was conducted using the NOAA/HYSPLIT (National Oceanic and Atmospheric Administration/HYbrid Single-Particle Lagrangian Integrated Trajectory) model (Draxler and Hess, 1997). The NCEP/GDAS (National Centers for Environmental Prediction/Global Data Assimilation System) data for the years 2004-2011 were used for the HYSPLIT model calculation.
2. 3 Simultaneous Rain Sampling
To test the effect of locally produced aerosols on the meter-scale variability of rainwater composition, two rain events on April 22 and 27, 2008 (GS22 and GS27, hereafter) were sampled simultaneously at four locations within the Gosan Station: on two tower platforms of 10m(T1) and 15m(T2) heights, and at two ground sites less than 20 m away from the tower platforms (F1, F2) (Fig. 1). Identical bulk samplers were installed 1-2m above the surfaces of tower platforms and ground as a measure against splashed rain input. The samples were immediately frozen and transferred to the laboratory at Seoul National University (SNU). In the lab, the samples were melted and filtered through 0.2 μm Nylon syringe filters. After discarding the first 0.5 mL, the filtered rainwater was stored in pre-cleaned HDPE bottles. Microbial growth was prevented by adding thymol to the final concentration of 0.4 μg L-1, which did not affect the determination of major ion concentrations (Granat et al., 2001). Samples were then stored in a refrigerator until analysis. Sample handling was performed in laminar flow clean benches/ hoods to minimize contamination. The sampling procedure is also described in Soyol-Erdene et al. (2011).
Major ion concentrations were determined by ion chromatography (IC, ICS2000, Dionex) at SNU. Cation (Na+, K+, Ca2+, Mg2+) contents were also measured using inductively coupled plasma atomic emission spectrometer (ICP-AES, Optima-4300 DV, Perkin- Elmer) at Korea Basic Science Institute. The internal precision for all measurements was less than 10% (relative standard deviation, RSD). Accuracy was tested with two certified reference materials, BCR-CRM 408 (simulated rainwater, low contents) and SLRS-4 (river water), and we obtained results within 10% of the certified values. The ICP-AES results agreed with the IC results within 8.5% except one very low potassium datum (17.6% for sample GS27-T1). The IC and ICP-AES data were averaged.
2. 4 Comparison to Aerosol Data
To compare the rainwater and aerosol compositions, previously reported data were compiled for water-soluble components (Na+, NO3-, SO42- and NH4+) of total suspended particulate matter (Table 1). At Gosan Station, there were data obtained at 3 and 6 m above ground.

Water-soluble ion concentrations of total suspended particulates at Gosan Station.
3. RESULTS AND DISCUSSION
3. 1 Ion Ratios as Proxies for the Local Influence of Terrestrial Sources
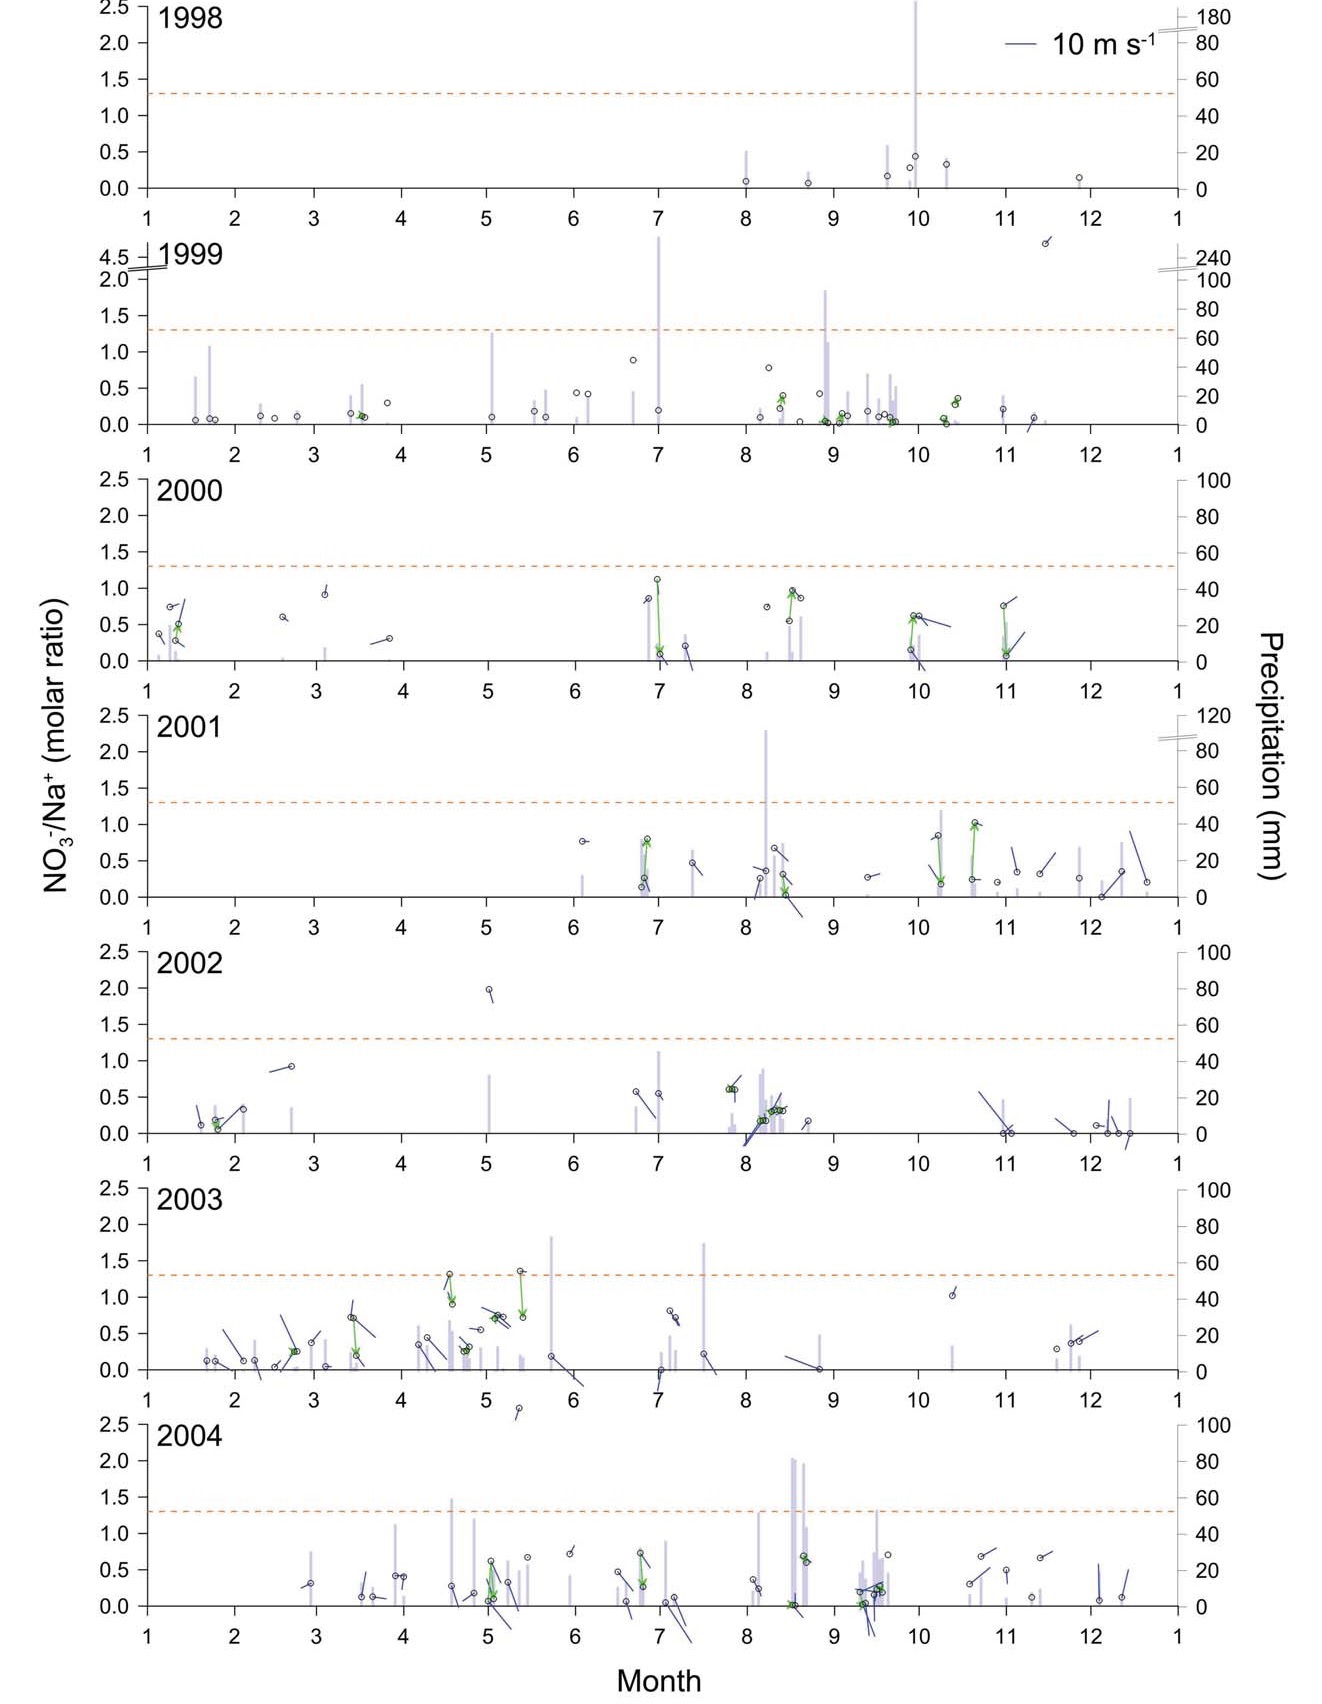
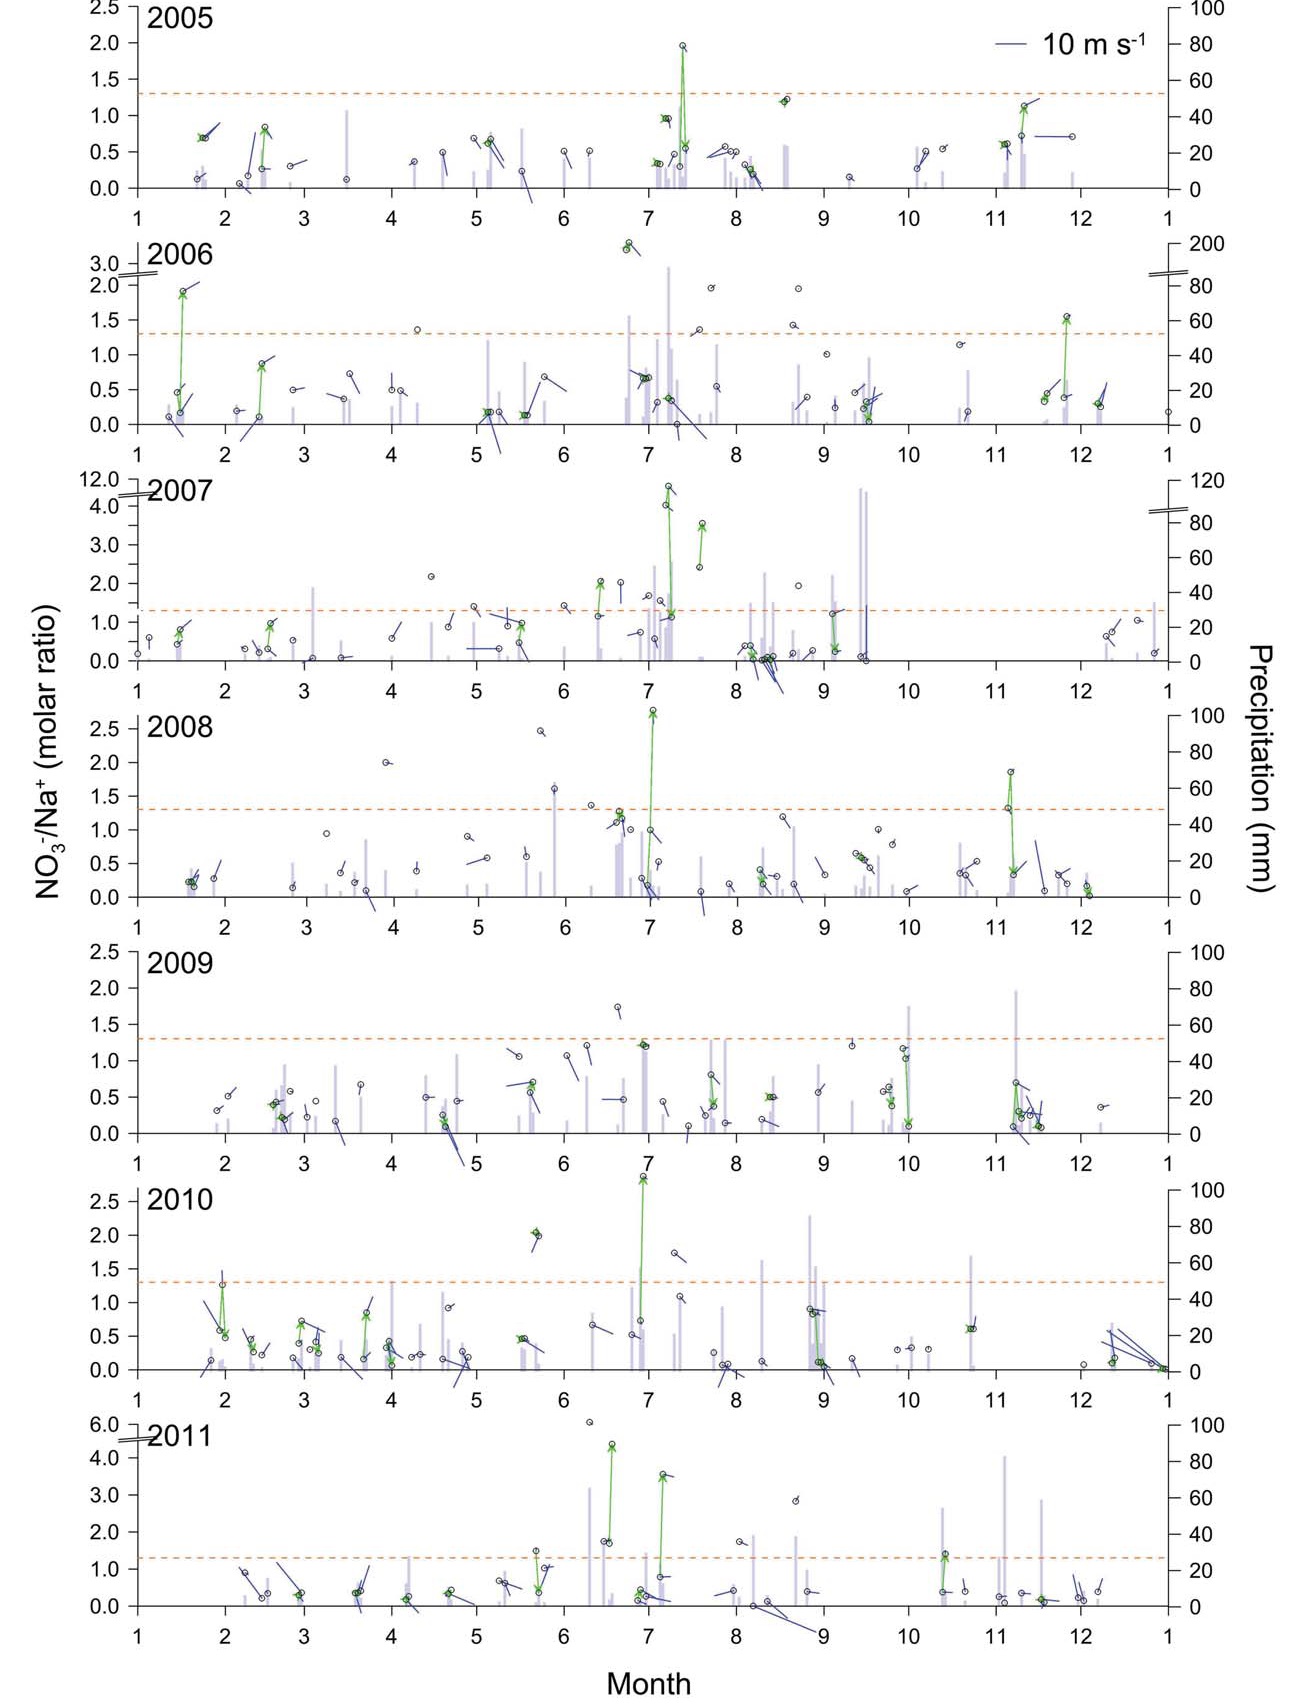
We analyzed the 14-year rainwater composition data as a function of wind direction and speed to investigate the local influence. The NO3-/Na+, nss-SO42-/ Na+ and NH4+/Na+ ratios (all are molar ratios hereafter) were chosen to represent the terrestrial/marine sources. The time series of NO3-/Na+ ratio along with precipitation and averaged wind direction and speed is given in the Appendix. Since marine aerosols are depleted in nitrate (NO3-/Na+<10-4; Parungo et al., 1987), an easterly wind delivering terrestrial aerosols would increase the NO3-/Na+ ratio, and the NO3-/Na+ ratio will vary with the prevailing wind direction during rainfall events. To test this, the wind direction was divided into eight sectors of 45°each (I-VIII; Fig. 1), taking into consideration the positions of adjacent buildings and structures that can act as windbreaks. Then the NO3-/Na+ ratios of rainfall events during the 14 years were averaged for each wind sector. As expected, the NO3-/Na+ ratio varied with the wind direction, with higher ratios (0.63-0.75) for the inland sectors (III-V) compared with the seaward sectors (VIVIII) (0.23-0.53) (Fig. 2a). Another statistical way of displaying the wind-directional variability is to identify the prevailing wind direction associated with anomalously high NO3-/Na+ ratios. If we designate the outliers (>mean plus 3σ (1.30)) as “peak” events, the inland sectors had more frequent NO3-/Na+ peak events than the seaward sectors (Fig. 2b; Appendix). We can conclude that there is a local source of nitrate in the east.

(a) The molar ratios of NO3-/Na+, nss-SO42-/Na+ and NH4+/Na+ averaged for each wind sector. The roman numerals indicate the wind sectors, and the number of samples for each wind sector is listed underneath. The error bars correspond to the standard error. (b) The frequencies of peaks (>mean+3σ) for NO3-/Na+, nss-SO42-/Na+ and NH4+/Na+ ratios.
Fig. 3 shows how the NO3-/Na+ ratio varies with the wind speed. Regardless of the wind sectors, the NO3-/Na+ ratio decreased with increasing wind speed, reflecting the greater contribution of local marine aerosols under stronger wind conditions. For the seaward sectors, the NO3-/Na+ ratio exhibited only a slightly decreasing trend with increasing wind speed (slope=-0.02 m s-1). In contrast, the inland sectors displayed a more significant decreasing trend (slope=-0.08 m s-1; Fig. 3), due to the prominent NO3-/Na+ peaks below wind speeds ~7 m s-1. When wind is stronger, it seems that the contribution of local marine aerosols exceeds that of terrestrial sources, as is expected for island sites surrounded by the sea.

The relationship between the NO3-/Na+ ratio and wind speed. Note the change in scale (logarithmic to linear) at NO3-/Na+=1. The shaded interval marks the wind speed above which the predominant source of the local aerosol changes from terrestrial to marine.
Air mass back trajectory analysis was performed for the NO3-/Na+ outliers to verify that these peak events represent local input and were not driven by transport from remote sources. For the 43 peak events (out of 48) for which GDAS meteorological data were available, we obtained 3-day back trajectories with starting heights of 50, 500 and 1,500 m above ground level at 3 hour intervals. The results are illustrated as frequencies of intersection between each map grid cell (0.25 ×0.25 degree) and air mass trajectories (Fig. 4). No remote source region or preferred air flow pathway could be identified (Fig. 4), supporting the local origin for the NO3-/Na+ peak events.

The frequency distribution map for trajectories computed for 43 peaks in NO3-/Na+ ratios, which are obtained at starting heights of 50, 500 and 1500 m above ground level.
We repeated the same analyses with nss-SO42-/Na+ and NH4+/Na+ ratios. Again, dependence on the wind direction was evident (Fig. 2). The coherence of those three ratios can be attributed to (1) the wind directional variation in marine aerosol input and (2) the supply of NO3-, nss-SO42- and NH4+ from eastern terrestrial sources. The local production of marine aerosols is evident (Fig. 3). However, the decreasing wind directional variability in the order of NO3-/NH4+, nss-SO42-/NH4+ and NO3-/nss-SO42- (Fig. 5) suggests that local terrestrial input of NO3- does exist and surpasses those of nss-SO42- or NH4+. This will be discussed further in Section 3.3.

The molar ratios of NO3-/nss-SO42-, NO3-/NH4+ and nss-SO42-/NH4+ averaged for each wind sector.
3. 2 Meter-scale Spatial Variability of Rainwater Composition
Two sets of concurrent samples (GS22 and GS27) with contrasting wind conditions and ion contents provide an opportunity to further examine the influence of wind direction on rainwater composition. During event GS22 wind blew from the seaward sectors (I and VIII), whereas winds from the inland sector (IV) prevailed during event GS27 (Fig. 6). GS27 had significantly higher ion content than GS22, with average total anionic charge of 956 μeq L-1 and 254 μeq L-1, respectively. The concentrations of the individual ions were also higher in GS27, especially for NO3- and SO42-.

Wind diagram for samples GS22 and GS27 with the relative frequency (%) of wind direction. Each sample is characterized by a distinct wind direction.
A plot of nss-SO42-/Na+ vs. NO3-/Na+ is useful for illustrating the relative contributions of the marine and terrestrial inputs (Fig. 7). This was verified by compiling rainwater composition monitored at various sites in Korea (Kim et al., 2006; Kang et al., 2003; Lee et al., 2000). In Fig. 7, the coastal sites plot near the origin due to the abundant input of marine aerosols, and an increase of the terrestrial contribution in the inland sites elevates those ratios along a line with a slope of ~1. The good linearity between nss-SO42-/Na+ and NO3-/Na+ ratios qualifies the use of these ratios in assessing the relative contributions of the sea and land. In addition, the slope suggests that the primary source of nss-SO42- and NO3- is characterized by a molar ratio ~1 in the Korean peninsula.

Plot of nss-SO42-/Na+ vs. NO3-/Na+ molar ratios for samples GS22 and GS27. Gray circles are literature values compiled from previous long-term rainwater composition monitoring conducted in Korea. Area near the origin is expanded in the inset.
As expected from the wind direction, the marine-influenced GS22 samples all plot near the origin (Fig. 7). GS27 samples have higher ratios and a wide range of both nss-SO42-/Na+ and NO3-/Na+ ratios (Fig. 7), highlighting meter-scale variability of rainwater composition. This likely results from uneven contributions of locally produced aerosols to individual rain collectors due to different sampling conditions of the collectors - e.g., the collector height. The nss-SO42-/Na+ and NO3-/Na+ ratios increase in the order of T2-T1-F1-F2 for rain event GS27. This means that the ground level sites (F1 and F2) are affected more by locally produced aerosols than tower level sites.
3. 3 Comparison of Rainwater and Aerosol Compositions
We can gain a more comprehensive understanding of the local aerosols by examining the published chemical composition of aerosols at two different heights (3 m and 6 m) (Hong et al., 2011; Kundu et al., 2010; Lee et al., 2010; Kawamura et al., 2004; Park, 2003; Carmichael et al., 1997). The ion contents for watersoluble components of aerosols were generally higher at 3 m than at 6 m (Table 1). For the three ion ratios used in the analysis of the rainwater data, NO3-/Na+ was higher at the 3m site, whereas nss-SO42-/Na+ and NH4+/Na+ were higher at the 6 m site (Fig. 8a). The NO3-/nss-SO42- and NO3-/NH4+ ratios were higher at the 3 m site (Fig. 8b), which implies that the increase of NO3- concentration toward the ground level was greater than those of nss-SO42- and NH4+. The higher relative abundance of NO3- compared to nss-SO42- and NH4+ at the 3m site can be explained by a greater association of NO3- with larger particles. Larger particles settle down faster than smaller particles and hence are more abundant near the surface. In another study for the aerosol size distribution of the water-soluble ions at Gosan Station, NO3-/NH4+ and NO3-/nss-SO42- ratios were shown to increase with particle size - 0.16 and 0.25 (PM1.0), 0.25 and 0.34 (PM2.5), and 0.48 and 0.69 (PM10) (Lim et al., 2012), supporting the association of NO3- with larger particles. Local aerosols are produced from the ground surface and are more influential to the lower elevation site.

Molar ratios of water-soluble ions in total suspended particulates collected at 3 m and 6 m height at Gosan Station: (a) NO3-/Na+, nss-SO42-/Na+ and NH4+/Na+ and (b) NO3-/nss-SO42-, NO3-/NH4+ and nss-SO42-/NH4+. Open symbols indicate the rainwater composition obtained in this study.
There is a caveat to comparing rainwater concentration with aerosol data, because rainwater vertically integrates the aerosol composition above the sampling site whereas aerosols are monitored at a specific height. Nevertheless, the averaged ionic ratios of the rainwater plotted on extensions of the aerosol trends (Fig. 8) and showed that the local influence for NO3- exceeds those of nss-SO42- and NH4+ near the ground level. Additionally, the wind directional variation in NO3-/ NH4+ supports the greater supply of nitrate from local terrestrial sources (Fig. 5).
3. 4 Quantification of the Local Influence on the Wet Deposition Flux
Quantification is necessary to evaluate how significant the local input is to the total wet deposition flux. Using the 14-year database, we estimated the local contribution of NO3-, SO42- and NH4+ in rainwater. The measured total wet deposition flux of an ionic species i (i=Na+, NO3-, SO42- or NH4+), Fi (mol m-2, concentration [mol m-3]×precipitation [m]), is the sum of the fluxes that originate from long-range transport (Fi,R) and from local sources (Fi,L): Fi=Fi,R+Fi,L. We define f as the fraction of the flux transported longrange: Fi=Fi,R / Fi. Then, the flux ratio reflecting the long-range transport of two different ionic species i1 and i2 can be expressed in terms of the ratios of f and total fluxes:
The total flux ratio (Fi1/Fi2) can be replaced by the measured concentration ratios i1/i2 - e.g., NO3-/Na+ when i1 and i2 are NO3- and Na+, respectively. We tried to estimate the Fi1,R /Fi2,R ratios given the measured Fi1/Fi2 ratios and optimizing for fi1 and fi2. To render the problem solvable, we assumed that the local and long-range inputs can be differentiated based on their wind-directional variability. That is, the concentration ratios of aerosols transported long-range (Fi1,R /Fi2,R) should remain constant whatever the local wind direction, but the concentration ratios of aerosols generated locally (Fi1,L /Fi2,L) are expected to carry more terrestrial signature if the local wind blows from inland.
The initial values for fNa+, fNO3-, fSO42- and fNH4+ were set randomly between 0 and 1 and optimized using a genetic algorithm from the Matlab Optimization Toolbox 6.2. The flux ratios used were: , , , , and . The mean long-range flux ratios were calculated in two different ways -(1) and (2) where n is the number of records used in the calculation (n=493). The algorithm seeks the minimum f that makes the mean flux ratios (1) and (2) of the 8 different wind sectors coincide within a predefined range. We named this predefined range the natural wind directional variability, and we let it vary from 5% to 50% (the x-axis in Fig. 9). For example, a natural wind directional variability of 5% means that the resultant mean Fi1,R /Fi2,R ratios can have at most 5% difference among the 8 different wind sectors. The minimum f values thus calculated results in maximum Fi,R and therefore represents the lower limit of the local influence. The optimization result is shown in Fig. 9. When the natural wind directional variability was set to 5%, it was estimated that at least 10% of nitrogen (N; NO3- +NH4+) and 12% of sulfur (S; nss-SO42-) had local origin. When higher variability was permitted, local influence was reduced and more portions were assigned to long-range transport. However, it should be noted that these modeled values represent the minimum possible local influence. Furthermore, in order to retain the simplicity of the model calculation, we did not consider the particle size distribution of the ions and the effect of the wind speed which may add uncertainty to the model results.

Model results for quantification of the local influence. The lower limits of the local influence on the total nitrogen and sulfur deposition are estimated, assuming an a priori level of wind directional variability (see text for explanation).
4. CONCLUSIONS
A remote site is often preferred for atmospheric observations, since influence from local surroundings is considered minimal. However, at Gosan Station, a remote site for monitoring the continental outflow from Asia, we detected a noticeable contribution from locally produced aerosol to the dissolved ion composition of rainwater. A 14-year database of the rainwater composition clearly showed that the cultivated inland area of the island is the local source for NO3-, SO42- and NH4+. This local influence was more severe near the ground level, as attested to by the simultaneous rain sampling at multiple locations and by aerosol data in the literature. In the 14-year database, the local influence accounted for at least ~10% and ~12% of the wet deposition of nitrogen and sulfur, respectively. Thus, when monitoring the continental outflow at this site one should carefully consider the local source of the chemical species of interest.
Acknowledgments
We gratefully acknowledge the Korea Meteorological Administration (KMA) for the rainwater data for Gosan Station and the NOAA Air Resources Laboratory for providing the HYSPLIT model. We thank K.-R. Kim for helpful comments and K.-S. Kang for assistance with the rain sampling. This work was funded by the KMA Research and Development Program (CATER 2007-4107) and the NRF World Class University program (grant No. R33-10001).
Appendix. The time series of NO3-/Na+ ratio (open circle) along with precipitation (blue bar) and averaged wind direction and speed (blue line). Continuous rain events are indicated by green arrows. Orange dashed lines indicate the mean plus three standard deviations (1.30).
References
-
Carmichael, G.R., Hong, M.-S., Ueda, H., Chen, L.-L., Murano, K., Park, J.K., Lee, H., Kim, Y., Kang, C., Shim, S., (1997), Aerosol composition at Cheju Island, Korea, Journal of Geophysical Research, 102, p6047-6061.
[https://doi.org/10.1029/96jd02961]

-
Carmichael, G.R., Song, C.H., Sunwoo, Y., Ohara, T., Lau, A., Koo, Y.-S., (2012), Air Quality Modeling in Asia 2011, Atmospheric Environment, 58, p2-4.
[https://doi.org/10.1016/j.atmosenv.2012.06.054]
-
Chuang, P.Y., Duvall, R.M., Bae, M.S., Jefferson, A., Schauer, J.J., Yang, H., Yu, J.Z., Kim, J., (2003), Observations of elemental carbon and absorption during ACEAsia and implications for aerosol radiative properties and climate forcing, Journal of Geophysical Research, 108, p8634.
[https://doi.org/10.1029/2002JD003254]
-
Cyranoski, D., Fuyuno, I., (2005), Climatologists seek clear view of Asia’s smog, Nature, 434, p128.
[https://doi.org/10.1038/434128a]
- Draxler, R.R., Hess, G.D., (1997), Description of the HYSPLIT_4 Modeling System, NOAA Technical Memorandum ERL ARL-224, NOAA, Silver Spring, Maryland, USA, p25.
- EANET, (2011), The Second Periodic Report on the State of Acid Deposition in East Asia, Asia Center for Air Pollution Research (Part I. Regional Assessment), Niigata-shi, Japan, p270.
- EANET, (2012), Data Report on the Acid Deposition in the East Asian Region 2010, Asia Center for Air Pollution Research, Niigata-shi, Japan, p313.
- Granat, L., Das, S.N., Tharkur, R.S., Rodhe, H., (2001), Atmospheric deposition in a rural area in India - net and potential acidity, Water, Air, & Soil Pollution, 130, p469-474.
-
Granat, L., Norman, M., Leck, C., Kulshrestha, U.C., Rodhe, H., (2002), Wet scavenging of sulfur compounds and other constituents during the Indian Ocean Experiment (INDOEX), Journal of Geophysical Research, 107, p8025.
[https://doi.org/10.1029/2001JD000499]
-
Hong, S.-B., Jung, D.-S., Lee, S.-B., Lee, D.-E., Shin, S.- H., Kang, C.-H., (2011), Ionic composition comparison of atmospheric aerosols at coastal and mountainous sites of jeju island, Analytical Science & Technology, 24, p24-37.
[https://doi.org/10.5806/ast.2011.24.1.024]
-
Huebert, B.J., Bates, T., Russell, P.B., Shi, G., Kim, Y.J., Kawamura, K., Carmichael, G., Nakajima, T., (2003), An overview of ACE-Asia: Strategies for quantifying the relationships between Asian aerosols and their climatic impacts, Journal of Geophysical Research, 108, p8633.
[https://doi.org/10.1029/2003JD003550]
- Kang, C.-H., Kim, W.-H., Lee, W., (2003), Chemical composition characteristics of precipitation at two sites in Jeju Island, Bulletin of the Korean Chemical Society, 24, p363-368.
- Kawamura, K., Kobayashi, M., Tsubonuma, N., Mochida, M., Watanabe, T., Lee, M., (2004), Organic and inorganic compositions of marine aerosols from East Asia: Seasonal variations of water-soluble dicarboxylic acids, major ions, total carbon and nitrogen, and stable C and N isotopic composition, In Geochemical Investigations in Earth and Space Science: A Tribute to Isaac R. Kaplan, Hill, R., Leventhal, J., Aizenshtat, Z., Baedecker, M.J., Claypool, G., Eganhouse, R., Goldhaber, M., Peters, K., EdsElsevier, p243-265.
-
Kim, J., Li, S., Mühle, J., Stohl, A., Kim, S.-K., Park, S., Park, M.-K., Weiss, R.F., Kim, K.-R., (2012), Overview of the findings from measurements of halogenated compounds at Gosan (Jeju Island, Korea) quantifying emissions in East Asia, Journal of Integrative Environmental Sciences, 9, p71-80.
[https://doi.org/10.1080/1943815x.2012.696548]
- Kim, S.-B., Choi, B.-C., Oh, S.-Y., Kim, S., Kang, G.-U., (2006), Acidity and chemical composition of precipitation at background area of the Korean Peninsula (Anmyeon, Uljin, Gosan), Korean Society for Atmospheric Environment, 22, p15-24.
- KMA, (2012), Report of Global Atmosphere Watch 2012, Korea Meterological Administration, p190-207.
-
Kulshrestha, U.C., Granat, L., Engardt, M., Rodhe, H., (2005), Review of precipitation monitoring studies in India - a search for regional patterns, Atmospheric Environment, 39, p7403-7419.
[https://doi.org/10.1016/j.atmosenv.2005.08.035]
-
Kundu, S., Kawamura, K., Lee, M., (2010), Seasonal variation of the concentrations of nitrogenous species and their nitrogen isotopic ratios in aerosols at Gosan, Jeju Island: Implications for atmospheric processing and source changes of aerosols, Journal of Geophysical Research, 115, D20305.
[https://doi.org/10.1029/2009JD013323]
- Lee, B.K., Hong, S.H., Lee, D.S., (2000), Chemical composition of precipitation and wet deposition of major ions on the Korean peninsula, Atmospheric Environment, 34, p563-575.
-
Lee, S.-B., Kang, C.-H., Jung, D.-S., Ko, H.-J., Kim, H.-B., Oh, Y.-S., Kang, H.-L., (2010), Composition and pollution characteristics of TSP, PM2.5 atmospheric aerosols at Gosan site, Jeju Island, Analytical Science & Technology, 23, p372-382.
[https://doi.org/10.5806/ast.2010.23.4.371]
- Lim, S., Lee, M., Lee, G., Kim, S., Yoon, S., Kang, K., (2012), Ionic and carbonaceous compositions of PM10, PM2.5 and PM1.0 at Gosan ABC Superstation and their ratios as source signature, Atmospheric Chemistry and Physics, 12, p2007-2024.
-
Losno, R., Colin, J.L., Spokes, L., Jickells, T., Schulz, M., Rebers, A., Leermakers, M., Meuleman, C., Baeyens, W., (1998), Non-rain deposition significantly modifies rain samples at a coastal site, Atmospheric Environment, 32, p3445-3455.
[https://doi.org/10.1016/s1352-2310(98)00042-9]
- NIER, (2011), National Air Pollutants Emission 2009, National Institute of Environmental Research, Republic of Korea, p235.
- Park, M.H., A study on long-term characteristics of ion composition and transport pattern of aerosol at Gosan, Korea, MSc Thesis, Department of Environmental Science and Engineering, Ewha Womans University, Seoul, Korea.
-
Parungo, F.P., Nagamoto, C.T., Madel, R., Rosinski, J., Haagenson, P.L., (1987), Marine aerosols in Pacific upwelling regions, Journal of Aerosol Science, 18, p277-290.
[https://doi.org/10.1016/0021-8502(87)90023-1]
-
Perry, K.D., Cahill, T.A., Schnell, R.C., Harris, J.M., (1999), Long-range transport of anthropogenic aerosols to the National Oceanic and Atmospheric Administration baseline station at Mauna Loa Observatory, Hawaii, Journal of Geophysical Research, 104, p18.
[https://doi.org/10.1029/1998JD100083]
-
Ramanathan, V., Li, F., Ramana, M.V., Praveen, P.S., Kim, D., Corrigan, C.E., Nguyen, H., Stone, E.A., Schauer, J.J., Carmichael, G.R., Adhikary, B., Yoon, S.C., (2007), Atmospheric brown clouds: Hemispherical and regional variations in long-range transport, absorption, and radiative forcing, Journal of Geophysical Research, 112, D22S21.
[https://doi.org/10.1029/2006JD008124]
-
Soyol-Erdene, T.-O., Han, Y., Lee, B., Huh, Y., (2011), Sources and fluxes of Pt, Ir and REE in the Seoul metropolitan area through wet scavenging processes, Atmospheric Environment, 45, p1970-1978.
[https://doi.org/10.1016/j.atmosenv.2011.01.023]
-
Wang, Z., Xie, F., Sakurai, T., Ueda, H., Han, Z., Carmichael, G.R., Streets, D., Engardt, M., Holloway, T., Hayami, H., Kajino, M., Thongboonchoo, N., Bennet, C., Park, S.U., Fung, C., Chang, A., Sartelet, K., Amann, M., (2008), MICS-Asia II: Model inter-comparison and evaluation of acid deposition, Atmospheric Environment, 42, p3528-3542.
[https://doi.org/10.1016/j.atmosenv.2007.12.071]