Ultrafine Particle Events in the Ambient Atmosphere in Korea
Abstract
In this study, real time measurements of particle number size distribution in urban Gwangju, coastal Taean, and industrial Yeosu in Korea were conducted in 2008 to understand the occurrence of ultrafine particle (UFP) (<100 nm) events, the variation of its concentration among different sampling sites, and UFP formation pathways. Also, to investigate seasonal and long-term variation of the UFP number concentration, data were collected for the period of 5 years (2007, 2008, 2010, 2011, and 2012) in urban Gwangju. Photochemical and combustion events were found to be responsible for the formation of UFP in the urban Gwangju site, whereas only photochemical event led to the formation of UFP in the coastal Taean site. The highest UFP concentration was found in industrial Yeosu (the average UFP number fractions were 79, 59 and 58% in Yeosu, Gwangju, and Taean, respectively), suggesting that high amount of gas pollutants (e.g., NO2, SO2, and volatile organic carbon (VOC)) emitted from industries and their photochemical reaction contributed for the elevated UFP concentration in the industrial Yeosu site. The UFP fraction also showed a seasonal variation with the peak value in spring (61.5, 54.5, 50.5, and 40.7% in spring, fall, summer, and winter, respectively) at urban Gwangju. Annual average UFP number concentrations in urban Gwangju were 5.53×103 cm-3, 4.68×103 cm-3, 5.32×103 cm-3, 3.99×103 cm-3, and 2.16×103 cm-3 in the year 2007, 2008, 2010, 2011, and 2012, respectively. Comparison of the annual average UFP number concentration with urban sites in other countries showed that the UFP concentrations of the Korean sites were lower than those in other urban cities, probably due to lower source strength in the current site. TEM/EDS analysis for the size-selected UFPs showed that the UFPs were classified into various types having different chemical species. Carbonaceous particles were observed in both combustion (soot and organics) and photochemical events (sulfate and organics). In the photochemical event, an internal mixture of organic species and ammonium sulfate/bisulfate was identified. Also, internal mixtures of aged Na-rich and organic species, aged Ca-rich particles, and doughnut shaped K-containing particles with elemental composition of a strong C with minor O, S, and K-likely to be originated from biomass burning nearby agricultural area, were observed. In addition, fly ash particles were also observed in the combustion event, not in the photochemical event.
Keywords:
Ultrafine particles, Photochemical event, Growth rate, Urban, Particle morphology1. INTRODUCTION
Fine (<2.5 μm) and ultrafine particles (UFPs) (<100 nm) in the ambient atmosphere are of current interest due to their effects on climate system and human health. Aerosols scatter or absorb incoming solar light affecting earth’s radiation balance and play an important role in cloud formation acting as cloud condensation nuclei(CCN), and impair visibility (Andreae, 2009; IPCC, 2007; Kulmala, 2003; O’Dowd et al., 2002a). When particles are inhaled by human, they can cause respiratory diseases (Dockery and Pope, 1994). Especially, UFPs can deeply penetrate into human respiratory and lung system and have high surface area-tovolume ratio, probably leading to more adverse health effects on humans (Gwinn and Vallyathan, 2006; Sioutas et al., 2005; Oberdürster, 2000; Peters et al., 1997). Typically, UFPs can grow into optically important size range (i.e., submicrometer particles) and they can easily act as CCN.
UFPs are directly emitted from high-temperature process such as diesel vehicles, biomass burnings, and industries, and/or are indirectly formed by gas-to-particle conversion process in the ambient atmosphere. Precursor gases such as NO2, SO2, volatile organic carbon (VOC), and etc. underwent a series of oxidation process with available oxidizing agents (e.g., O3 and OH) produce non-volatile condensable vapors (e.g., H2SO4, HNO3, non-volatile organic vapors, and etc.). The accumulation of these vapors at certain atmospheric condition leads to produce new UFPs or condense onto preexisting particles by the gas-to-particle conversion. Since those UFPs exist in high numbers and experience a rapid physical or chemical transformation in the ambient atmosphere (approximately several hours), it is essential to determine their physical and chemical properties in real time. Many studies on the UFPs, especially in urban environment, have already been reported, and they showed that a rapid increase of UFP concentrations occurred in specific event days (Park et al., 2008; Qian et al., 2007; Watson et al., 2006; McMurry and Eisele, 2005; Kulmala et al., 2004; Dunn et al., 2004; Stanier et al., 2004a, b; Kulmala et al., 2002; Woo et al., 2001a; McMurry et al., 2000). In these studies, distinct UFP events were defined based on particle size ranges with enhanced number concentrations and described hypotheses of particle source and formation pathways.
A continuous measurement of number size distribution at Atlanta (USA) reported three types of UFP events (3-10, 10-35, and 35-45 nm) depending on the sizes, where enhanced UFP concentration was observed (Woo et al., 2001a). The enhanced UFP concentration was correlated well with SO2 concentration and UV intensity, suggesting that the UFPs mainly consist of sulfates produced by photochemical reaction (Woo et al., 2001a). A similar behavior was also observed at Mexico city (Mexico) and Pittsburg (USA) (Dunn et al., 2004; Stanier et al., 2004a, b). UFP events were reported at Fresno (USA), where the level of SO2 concentration was low(Watson et al., 2006). These studies suggested that sources and formation pathways for UFPs varied with time and locations. Limited studies on UFP events have been reported in Korea. Park et al. (2008) showed that traffic and residential heating lead to enhanced UFP concentration in winter, while in summer particles formed by photochemical activity led to increased UFP concentration in urban Gwangju in Korea. They classified UFP events into “10-100 nm traffic event”, “50-100 nm residential heating event”, and “10-30 nm photochemical events”. Lee et al. (2008) investigated particle formation events at western coastal region of South Korea in 2005. They reported that the particle formation events occurred more frequently in cold season and that new particle formation was correlated with UV irradiation and SO2 concentration. Hung et al. (2010) showed that the UFP concentration in Seoul was well correlated with NO2 concentration, suggesting that UFPs produced from vehicles and other combustion sources. Although those studies provided useful insights into UFP formation event, they were limited to examine a long-term variation of UFPs and the characterization of UFP properties among different environments.
In this study, we report UFP events occurred in urban Gwangju, coastal Taean, and industrial Yeosu, sites in Korea during the year of 2008 by continuously measuring particle number size distribution N (13-615 nm). The UFP events were classified into “photochemical event” and “combustion event”, based on their characteristics. In urban Gwangju site, data were collected for the period of 5 years (2007, 2008, 2010, 2011, and 2012) including recent data to observe a long-term variation of UFP concentration. Also, morphology and elemental composition of UFPs were examined at such events to better understand the formation pathways of UFPs. In addition, NO2, SO2, O3, CO, PM10, and meteorological data were also obtained from a nearby national monitoring site.
2. SITE DESCRIPTION AND EXPERIMENTAL METHODS
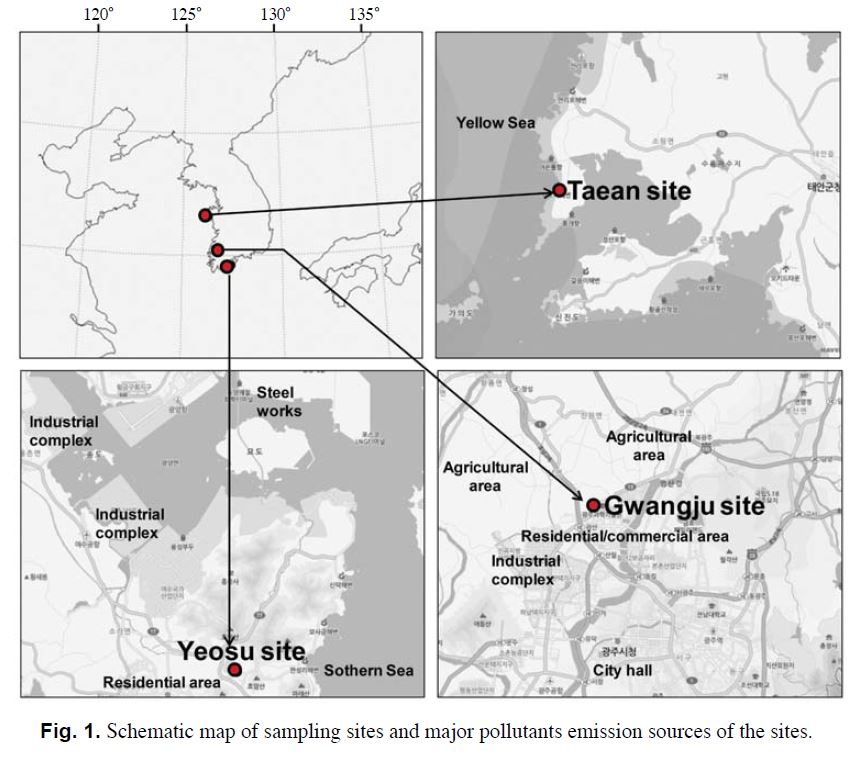
Measurements were conducted during the sampling periods of January 16-25, 2008 in industrial Yeosu, and August 29-September 5, 2008 in coastal Taean (see Fig. 1). For the study of a long-term variation of UFP number concentration, measurements of number size distribution of UFPs were also conducted in urban Gwangju site during the sampling periods of October 11-24, 2007, May 5-18, 2008, January 29-February 6, 2010, March 22-April 4, 2010, July 29-August 5, 2010, July 18-24, 2011, October 3-November 14, 2011, December 26-31, 2011, and January 4-19, 2012. Urban Gwangju sampling site was located approximately 7.6 km north of the downtown Gwangju city hall and 4.2 km from the Hanam industrial complex. This area was influenced by a number of sources, including traffic from a nearby highway (~1.5 km away from the site), heating systems from residential and commercial areas (~0.6 km away from the site), and biomass burning from agricultural areas (~0.8 km away from the site). The industrial Yeosu site was located about 15 km away from the South Sea of Korea and 90 km southeast from Gwangju site. This site was affected by the largest petrochemical industries and steel works. The coastal Taean site was located at the coast of Yellow Sea of Korea, which is considered to be one of the national background level monitoring sites due to its good air quality. However, long range transport of air masses, which depends on seasons, can affect the air quality of the site.
For continuous measurement of particle number size distribution, atmospheric aerosols first passed through a PM10 inlet to sample particles smaller than 10 μm, and then dried by a series of diffusion driers (TSI 3062) or Nafion driers before being introduced into the scanning mobility particle sizer (SMPS). The SMPS consists of differential mobility analyzer(DMA) (TSI 3081, USA) and condensation particle counter (CPC) (TSI 3022A, USA) to continuously measure particle number size distribution (13-600 nm) in 125s. For morphological and elemental analyses of UFPs, a certain size of UFPs occasionally during the specific event were selected by the DMA and then collected on to TEM grid (Ted Pella Inc., USA, Formvar®/Carbon 200 mesh Cu grid, 30-50 nm thickness) by using a nano-aerosol sampler (TSI 3089). Then, morphology and elemental composition of UFPs were analyzed by a 200 kV field emission analytical transmission electron microscopy (TEM) (JEOLJEM-2100, Japan) and an energy dispersive spectroscopy (EDS) (OXFORD INCAx-sight, Japan), respectively. The beam current and the magnification used were 111 μA and 25,000-50,000X, respectively.
3. RESULTS AND DISCUSSION
3. 1 Characteristic and Occurrence of UFP Events
“UFP events” is an increase of UFP number concentration N (13-100 nm) by more than a factor of two over a time period of 24 h. For a “no event” day, UFP number concentration does not meet the above condition (Park et al., 2008). The UFP events can be classified into different types based on the number of particle concentration at different size intervals. Atmospheric UFP studies have suggested different types of UFP events and criteria for their characterization (Woo et al., 2001b). However, the classification of UFP events is still somewhat skewed as standardized criteria do not exist. In this study, UFP events were classified by considering the size range with elevated concentration, possible source or formation pathways, and gas pollutant concentration data (e.g., NO2, SO2, CO, and O3) into: (1) photochemical event with N (13-30 nm) and (2) combustion event with N (13-100 nm). When the time for enhanced UFP number concentration was coincided with the maximum level of solar radiation, high ozone concentration, and reduced traffic activity, it was classified into the photochemical event. In addition, the concentrations of CO and NO2 (traffic emissions) were at the minimum level during photochemical event. Whereas, the combustion event was defined by the coincidence of NO2 and CO concentration with enhanced UFP number concentration and usually occurred during morning (traffic-rush hour) and evening (traffic rush hour and residential heating).
Fig. 2 shows typical UFP events recorded by SMPS measurements in which particle diameter and particle concentration (dN/dlogDp) by shading contour are presented as a function of time for several distinct types of UFP events: (a), (b), and (c) photochemical events, (d) combustion event, (e) mixed photochemical and combustion events (it is described as mixed event hereafter), and (f) plume events. Geometrical mean diameter (GMD), UFP number concentration, and the frequency of each event were used to characterize the strength of source. For the combustion event days, the GMD of UFPs varied from 33 to 86 nm with an average of 55nm(±9), while the GMD in the photochemical event days was limited to the size range of 13-30 nm with an average of 27 nm. During the observation period, the UFP number concentration in the combustion event was usually higher than in the photochemical event in the urban Gwangju site. The maximum UFP number concentration for the combustion event was 3.6×104 cm-3 with an average of 1.0×104 cm-3, while in the photochemical event the maximum was 2.1×104 cm-3 with an average of 9.8×103 cm-3. On the contrary, the UFP number concentrations in the combustion event were significantly lower than that in the photochemical event at other sampling sites of Korea (e.g., Taean and Yeosu). The maximum concentration in photochemical events were 1.8×104 cm-3 and 7.3×104 cm-3, while in the combustion events were 9.4×103 cm-3 and 3.3×104 cm-3 in Taean and Yeosu, respectively. The average UFP number concentrations measured at three sampling sites were compared to the maximum UFP number concentrations in the UFP events, where a significant increase of the concentrations was observed in all the events. The average and maximum concentration of UFP number concentrations in the UFP events were 4.80×103 cm-3 and 3.59×104 cm-3; 2.50×103 cm-3 and 1.78×104 cm-3; 1.40×104 cm-3 and 7.29×104 cm-3 in Gwangju, Taean, and Yeosu sites, respectively.
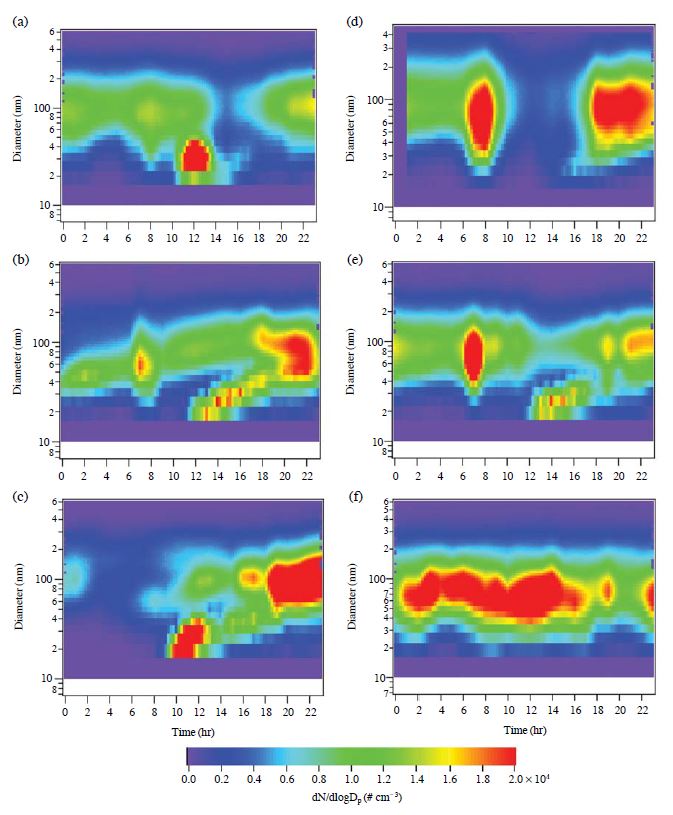
Diurnal variations of particle size distribution with diameter on the y-axis, time of day on the x-axis, and particle number concentration (dN/dlogDp) by shading contour for: (a), (b), and (c) photochemical events at Gwangju (May 7, 2008; April 2, 2010; and May 5, 2008; respectively), (d) combustion event at Gwangju (October 31, 2011), (e) mixed event at Gwangju (April 4, 2010), and (f) plume event at Yeosu (January 19, 2008).
A total of 128 days samples were measured during different seasons in urban Gwangju (2007, 2008, 2010, 2011, and 2012), industrial Yeosu (2008), and coastal Taean (2008) sites. In this work, UFP events were identified and classified into different types by applying the approach as described above and analyzed the samples. Among the 87 identified UFP events, the photochemical, combustion, and mixed events were observed on 20, 61, and 4 days, respectively, in different sites of Korea.
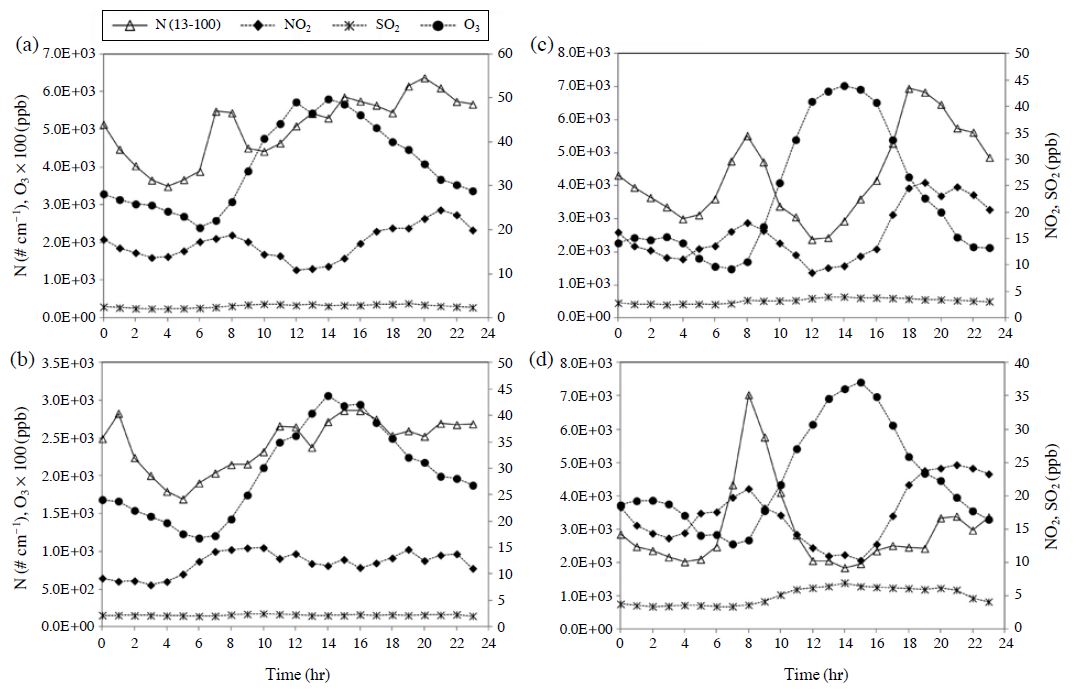
The photochemical events usually occurred, when the total number concentration of UFPs is significantly higher than that in other size intervals and mostly during noon when solar radiation is the most intense (see Fig. 2a). The event was observed in all the sampling sites and seasons except winter season, suggesting that the less intensity of solar radiation reduce the photochemical activities. Fig. 3a shows diurnal variations of particle numbers in different size intervals and gas concentration corresponding to Fig. 2a. The elevated number of UFPs at around noon coincided with time for increasing O3 concentration. This implies that the high intensity of solar radiation levels and high temperature tend to enhance photochemical activities and to increase the formation of nanoparticles N (13-30 nm). The NO2 concentrations were usually high before and after the event and depleted during the event. This suggests that the appearance of elevated number of UFPs at around noon is believed to be associated with the photochemical reactions but not the combustion one. Fig. 4a shows the comparison of hourly average UFP number N (13-30 nm) and O3 concentrations for all photochemical event days (20 number of samples), which showed a correlation between them (r=0.54). We occasionally observed the particle growth after the formation of UFPs in the photochemical event as shown in Fig. 2b and 2c. The growth rate (dDp/dt) based on the variation of GMD as a function of time was calculated (see Fig. 5). The growth rate varied from 2.73 to 3.10 nm h-1, which was lower than those reported for Atlanta and St. Louis urban sites (2.86-22.02 and 6.7 nm h-1, respectively) (Qian et al., 2007; Stolzenburg et al., 2005). The observation of the low growth rate in the urban Gwangju site could be due to the low coagulation or condensation rate occurred at the sampling site.
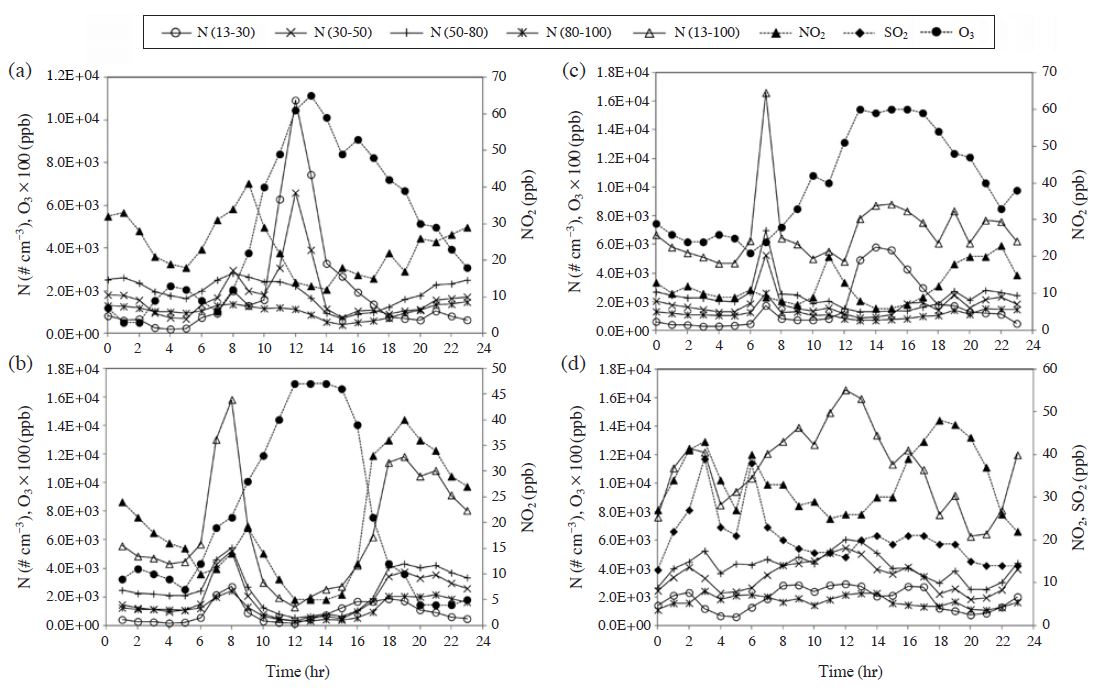
Diurnal variations of hourly averages of particle numbers in different size intervals (13-30, 30-50, 50-80, 80-100, and 13-100 nm), NO2, SO2, and O3 concentrations in: (a) photochemical event at Gwangju (May 7, 2008), (b) combustion event at Gwangju (October 31, 2011), (c) mixed event at Gwangju (April 4, 2010), and (d) plume event at Yeosu (January 19, 2008) corresponding to Figs. 2a, 2d, 2e, and 2f, respectively.
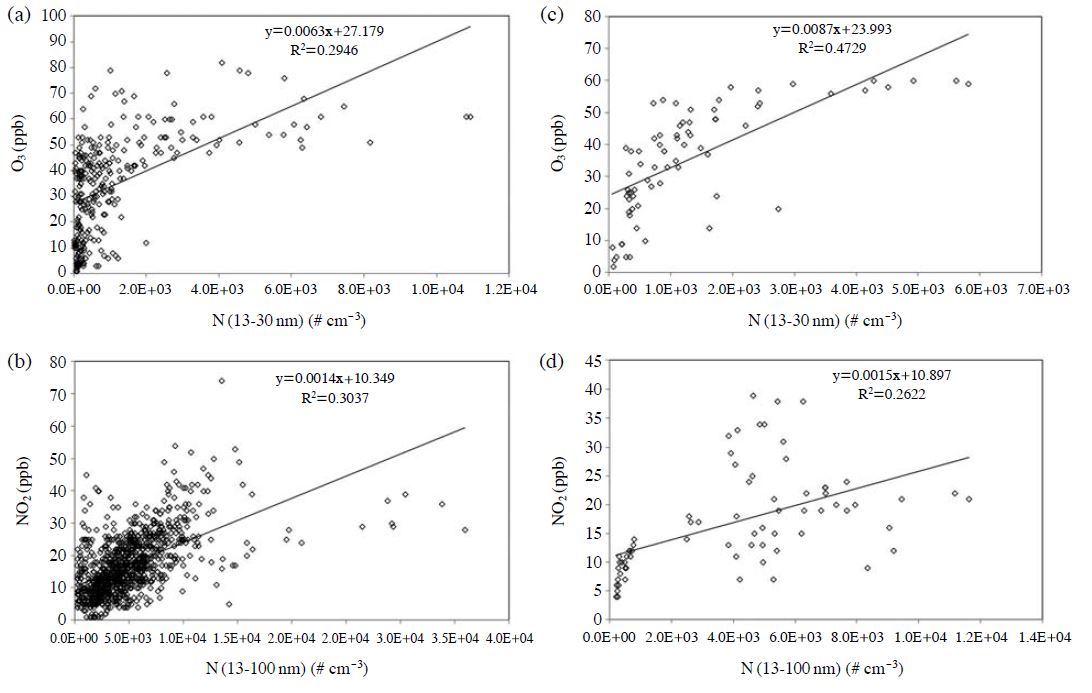
Correlations between hourly average UFP number N (13-30 nm) and gas pollutants concentrations for all (a) photochemical (b) combustion, (c), and (d) mixed event days.
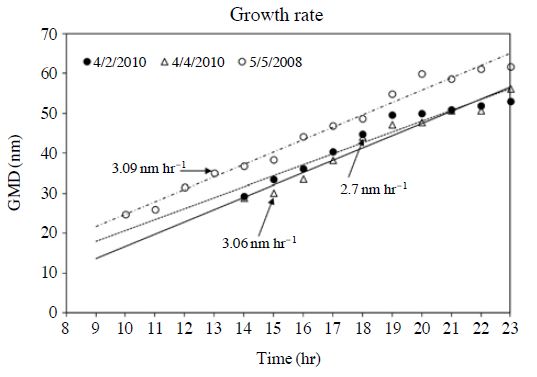
Geometrical mean diameter (GMD) of UFPs as a function of the time of day when particle growth pattern was observed in the photochemical events: the growth rate was calculated as the regression slope.
Typical contour plots for combustion event, which usually occurred in the morning (traffic rush hour) and evening (traffic rush hour and residential heating) in all the sampling sites and seasons, is shown in Fig. 2d. Diurnal variations of particle numbers in different size intervals and NO2 and O3 concentrations corresponding to Fig. 2d are shown in Fig. 3b. The UFP number concentration started to increase significantly around 6:00-7:00, reached their maxima at 8:00, due to high traffic intensity and decreased gradually due to decreasing traffic intensity, and as the mixed layer developed. Their concentrations were the lowest in the afternoon, when the morning traffic rush hours were over. They appeared again to increase from 14:00, peaked around 18:00, and lasted until late night. The elevated UFP number concentrations were correlated well with increased NO2 concentrations, suggesting that those particles were produced from combustion sources (most likely traffic of morning and evening and residential heating). The hourly average UFP number N (13-100 nm) concentration was correlated with NO2 concentration (r=0.55) for all the combustion event days as shown in Fig. 4b. The GMD of particles in the combustion events varied from study to study. Watson et al. (2006) reported that the traffic and residential heating events particle were typically <30 nm and 50-84 nm, respectively, whereas 30-60 nm was reported for traffic event by Park et al. (2008). And, laboratory studies showed that average diameters for the number size distributions of particles emitted from gasoline engines were in the range of 40-80nm(Harris and Maricq, 2001; Ristovski et al., 1998). As stated previously, the GMD for the combustion event particles of this study were in the range of 33-86 nm, suggesting that the UFPs consisted of a combination of traffic and residential heating emissions. For these UFPs, the characteristics growth patterns were not observed.
Fig. 2e shows mixed event in which both photochemical and combustion events occurred around noon and at the morning and evening, respectively, contributing to the atmospheric particle number concentrations on the same day. The relationships between particle number concentrations in different size intervals and NO2 and O3 concentrations corresponding to Fig. 2e is shown in Fig. 3c. High UFP number concentrations were observed around 7:00 and decreased substantially around 9:00 when the morning rush hours were over. Increased UFPs number concentrations were observed again from around 13:00 and lasted until 16:00. Correspondence of the NO2 and O3 with particle number concentrations in the afternoon is a clear indicator of the photochemical contributions. The hourly average UFP number (13-100 nm) concentration was correlated with O3 concentration (r=0.69) and NO2 (r=0.51) for all the mixed event days as shown in Fig. 4c and 4d, respectively.
A distinct type of contour plot, plume event (see Fig. 2f) was also identified in the sample of industrial Yeosu site. The diurnal variations of particle numbers in different size intervals and NO2 and SO2 concentrations corresponding to Fig. 2f are shown in Fig. 3d. It shows steady-state UFP number concentrations for all particle diameters over the whole day either at low or high concentration except at the midday where the concentration was high. This suggests that the steady-state UFP number concentration could be due to the large plume of gas pollutants such as NO2 and SO2 emitted at industrial environment whereas, the increase of concentration at the midday was attributed to the photochemical emission together with gaseous pollutants.
3. 2 Variation of UFP Concentrations
UFP number concentrations, gaseous pollutants, and meteorological data, averaged by the time of day, obtained in urban Gwangju (2007, 2008, 2010, 2011, and 2012), coastal Taean (2008), and industrial Yeosu (2008) sites in Korea by continuously measuring particle number size distribution N (13-615 nm) are summarized in Table 1. The variation of UFP number concentrations in three different sampling sites: Gwangju, Taean, and Yeosu, and seasonal and long-term variations in urban Gwangju are described as follows.

Sampling site, periods, season, averaged number concentrations of size segregated particle, UFP fraction, gas pollutants, and meteorological data during the measurement period.
As shown in Table1, average number concentrations of UFPs in Gwangju, Taean, and Yeosu during the year of 2008 were 4.68×10³ (±1.34×10³) cm-3, 3.73×10³ (±1.44×10³) cm-3, 9.71×10³ (±4.46×10³) cm-3, respectively. This result revealed that a significant difference of UFP number concentrations among the different sampling sites was observed. The UFP fraction, the contribution of UFPs to the total number of particles, calculated as the UFP N (13-100 nm)/N (13-615 nm) concentration ratios, was significantly higher in Yeosu than in Gwangju and Taean (average UFP fraction: 79% versus 59% and 58%, respectively). This result suggests that the abundant gaseous pollutants (e.g., NO2 and SO2) emitted from the industry could be the additional sources of elevated UFPs in industrial environment. Indeed the concentration of NO2 and SO2 in the industrial Yeosu was higher as compared to urban Gwangju and coastal Taean (average concentration: 12.0 ppb and 19.6 ppb versus 2.9 ppb and 17.9ppb, and 2.1 ppb and 5.9 ppb, respectively). Many atmospheric aerosol studies have shown that elevated UFP number concentration in industrial environment was associated with the emissions of industrial plumes (Young and Keeler, 2007; Brock et al., 2003). However, the UFP number concentration in industrial environment of this study was still lower than those values reported by Brock et al. (2003) for an industrial plume (average values: 9.71×103 cm-3 versus 12.0×104 cm-3) (Brock et al., 2003). The strength of industrial sources, the distance of the sampling sites (upwind or downwind), and meteorological data (T. RH, wind speed, and wind direct) might affect the difference of UFP concentrations among sites.
Combustion emissions (vehicle and residential heating) are considered to be one of the major sources of UFPs in urban atmosphere (Shi et al., 2001). As discussed previously, the average UFPs number concentration in urban Gwangju was 4.68×10³ (±1.34×10³) cm-3, which was lower than those in other observations conducted in urban site (average values: 1.83×104 cm-3, 1.77×104 cm-3, and 1.35×104 cm-3 for Alkmaar, Erfurt, and Atlanta, respectively) (Ruuskanen et al., 2001; Woo et al., 2001b). The possible reasons for difference in UFP number concentration among urban sites could be the differences in the strength of UFP-generated sources in urban environment such as number of vehicles, types of fuels used in vehicles and residential heating system, and population density. Also, the distance of the sampling sites from source regions (upwind or downwind), and meteorological data (T, RH, wind speed, and wind direct) can affect the UFP concentration. Biogenic sources from ocean are reported to be additional source for UFP in coastal environment (Birmili et al., 2003; O’Dowd et al., 2002b). Table 2 shows the number of photochemical, combustion, mixed, and plume events occurred at different sampling sites. The observation of only photochemical event in Taean site indicates that photochemical reaction was the major pathway for the formation of UFPs in coastal atmosphere. Photochemical event was usually observed in all the sampling sites, whereas the combustion event was observed only in Gwangju and Yeosu sites. In addition, fewer numbers of UFP events were observed in Taean site as compared to other two sampling sites (50, 86, and 100% UFP events in Taean, Gwangju, and Yeosu, respectively) (see Table 2). This reveals that the strength of UFPs source in coastal Taean site was weaker than those of urban Gwangju and industrial Yeosu sites, leading to lower UFP events in Taean site (Table 1).
Fig. 6 shows comparison of average UFP fraction, NO2, SO2, O3, CO, and PM10 mass concentration among different seasons that occurred in urban Gwangju during 5 years. The UFP fraction showed a significant seasonal variation with peak value in the spring (average values: 61.5, 54.5, 50.5, and 40.7% in spring, fall, summer, and winter seasons, respectively), indicating that the strength of UFPs source in the spring season was higher than those of other seasons, leading to high UFP events in spring season (the number fraction of UFP events: 93.0, 69.4, 52.0, and 47.0% for spring, fall, summer, and winter seasons, respectively) (see Table 2). The seasonal variation was associated with the prevailing meteorological conditions. The moderate average temperature and RH (11.5°C and 57%, respectively) in spring influenced less for the increment of particle dilution and size, respectively. Therefore, the elevated concentration of UFPs was not significantly changed. Previous studies also reported that the maximum particle number concentration was observed in Beijing during spring season (Wu et al., 2007). The comparisons of UFP fraction with O3 concentration for all the seasons showed a distinct correlation between them, but such correlation was not clearly observed among the particles and other concentrations such as CO, SO2, and PM10 (see Fig. 6). Although the photochemical activities were enhanced at high temperature and strong solar radiation generally in summer, the photochemical event was more often observed in spring season (average temperature: 11.5, 15.6, 27.7, and -0.3°C in spring, fall, summer, and winter seasons, respectively) (see Table 1). Diurnal variations of UFP number concentration with NO2, SO2, and O3 concentration, averaged by the time of year were compared among different seasons in Fig. 7. The UFP number concentrations showed apparently different diurnal patterns in four seasons. The elevated concentration of UFP number was observed in the morning, afternoon, and evening (peaked values at: 7:00, 13:00 and 15:00, and 20:00, respectively) during spring seasons (Fig. 7a), while the concentration decreased in the afternoon, primarily during fall and winter seasons (Figs. 7b and 7c, respectively). The other study in urban city reported that the elevated concentration of UFP number occurred in the morning and decreased in the afternoon during winter and in the spring seasons (Wu et al., 2007). However, in this study, such diurnal pattern was observed in winter and fall seasons (peaked values at: 8:00 and 20:00, respectively). In winter season, characterized by low temperature and solar radiation, the photochemical activities which usually occurred during day time as stated earlier, was weak during that period, and the UFP number concentration decreased in the afternoon. In addition, the concentration was higher in the morning as compared to evening during winter season (average UFP concentration: 7.0×103 cm-3 versus 3.3×103 cm-3, respectively) and in contrast to fall and spring seasons (average UFP concentration: 5.5×103 cm-3 versus 6.9×103 cm-3 and 5.4×103 cm-3 verusus 6.3×103 cm-3, respectively). During summer season, the UFP number concentration, mostly elevated in the afternoon (peaked values at: 11:00 and 15:00), was lower than that in spring. This might occur because the higher mixing layer in summer (high dilution) than spring caused the UFP concentration to decrease although comparable photochemical activity happened (Wu et al., 2007).
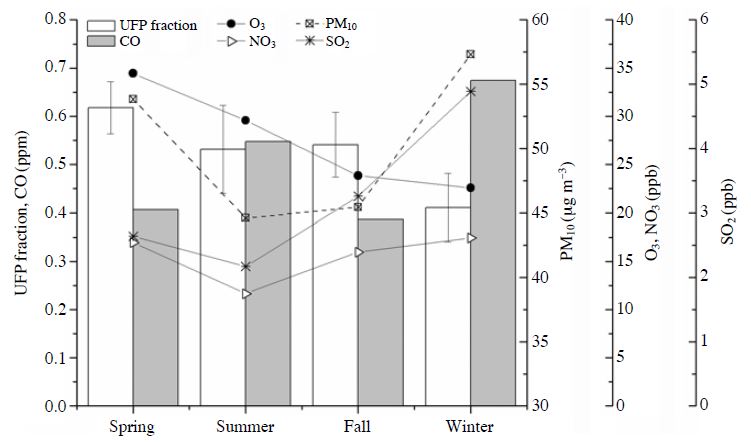
Seasonal variations of UFP fraction, NO2, SO2, O3, CO, and PM10 concentrations averaged over the observation period.
The particles N (13-615 nm) number concentration data, collected for the period of 5 years (2007, 2008, 2010, 2011, and 2012) of different seasons in urban Gwangju site, was analyzed to observe the long-term variation of the UFP number concentrations. Annual variations of UFP fraction during five years are shown in the Box and Whisker plot (see Fig. 8), which clearly shows a variation of UFP fraction in the Gwangju site. The UFP number concentration ranged in 2012 year was significantly lower as compared to other year’s samples (range: 3.02×103 cm-3, 3.41×103 cm-3, 5.34 ×103 cm-3, 3.36×103 cm-3, and 1.17×103 cm-3 in 2007, 2008, 2010, 2011 and 2012, respectively). The possible one of reasons for the less UFP fraction in 2012 is that the high UFP events occurring in spring as described previously were absent in 2012 samples.
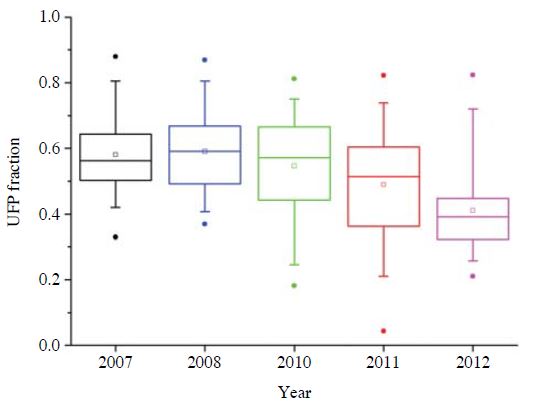
Annual variations of UFP fraction. Box-Wishker plot indicates median and 25% quartile (box), average (square), 5/95% quartiles (whiskers), and 1/99% quartiles (dot).
Annual median UFP number concentrations, showed annual variation tendency in Gwangju. The median UFP concentration in Gwangju were 5.11×103 cm-3, 4.08×103 cm-3, 4.32×103 cm-3, 2.95×103 cm-3, and 9.83×102 cm-3 in the years 2007, 2008, 2010, 2011, and 2012, respectively Comparison of the annual average UFP number concentration with observations of previous studies showed that the UFP number concentrations of this study (2.16×103 cm-3 (minimum)-5.53 ×103 cm-3 (maximum)) was lower than those observed in the Beijing, Alkmaar, Erfurt, and Atlanta (average values: 1.59×104 cm-3, 1.83×104 cm-3, 1.77×104 cm-3, and 1.35×104 cm-3, respectively) (Wu et al., 2008; Ruuskanen et al., 2001; Woo et al., 2001b). As stated earlier, the low UFP concentrations could be the difference in the strength of UFP generated sources in urban environment such as number of vehicles, types of fuels used in vehicles and residential heating system, and population density.
Morphology and elemental composition of individual particles provides important information on their characteristics and source (Kang et al., 2009). In this study, morphological and elemental analyses for mobility-classified UFPs occasionally collected during the specific UFP event days were performed by TEM/EDS. The particles on Fig. 9 show TEM images together with EDS spectra for 20-80 nm particles pre-classified by nano-DMA when the photochemical or combustion activity was intense in urban Gwangju, coastal Tean, and industrial Yeosu sites. To overcome the interference of C and O peaks emitted from TEM grid substrate, the X-ray spectrum of the bare substrate was subtracted from the spectrum of particles on the substrate. Although a small peak of Cu-L-line is caused by lateral scattering on Cu bars of the TEM grid, Cucontaining airborne particles are rarely encountered in ultrafine ambient aerosol samples. Overall 232 UFPs were analyzed on the basis of morphological data from TEM images and elemental compositional data from spectra, and classified into several types as shown in Fig. 9. Urban Gwangju areas generally undergo high pollution load, especially from heavy traffic, emissions from nearby industrial plants, and intensive energy consumption, which leads to complex composition of UFPs. Indeed, a complex composition of 35 nm mobility-classified particle from photochemical event was observed. They look dark in contrast with rough surface on its TEM image and EDS spectrum obtained from the particle showed C, O, Na, S, Cl, and K peaks (see Fig. 9a), suggesting that the particles were likely to be the internal mixture of sulfate, chloride, sodium, and semi and/or less volatile organic species and is regarded as aged Na-rich particle. As the particle is sensitive to electron beam, it becomes rough surface within a few second after exposed to electron beam. This type of particle was occasionally observed in Gwangju site (3 among overall 100 particles) in the photochemical event.
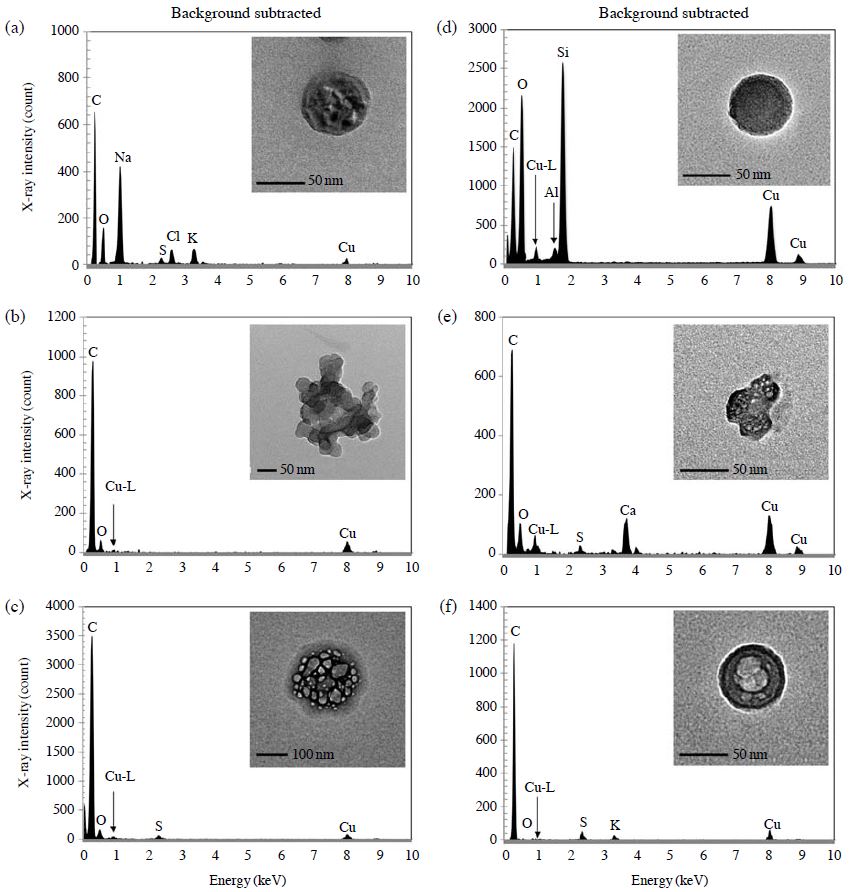
Typical TEM images and X-ray spectra of UFPs: (a) aged Na-rich, (b) agglomerated soot particle, (c) mixture of ammonium sulfate/bisulfate and volatile organic species, (d) fly ash, (e) aged Ca-rich, and (f) doughnut shaped K-containing particles.
Carbonaceous particles (i.e., obtained from the incomplete combustion of fossil fuels, biofuels, and biomass (Maskey et al., 2011)), are ubiquitous in the tropospheric atmosphere, and have a significant impact on atmospheric climate change because of their wellknown radiative forcing effects. Although different types of carbonaceous particles, such as elemental carbon, organic, and biogenic, are diverse in physical and chemical characteristics, the common characteristic of these types of particles is that the particle is enriched mostly by C peak in the EDS spectrum. As the EDS cannot detect hydrogen, it is not feasible to clearly identify the chemical species of the carbonaceous particle and also difficult to differentiate between elemental carbon and organic carbon. Hence, they are simply regarded as carbonaceous group. The particle with irregular shape and complex microstructure was recognized as soot particle (i.e., elemental carbon by the observation of strong C peak in its X-ray spectrum) (see Fig. 9b). Soot particles once emitted into the air, they are subjected to adsorption or condensation of gaseous species, coagulation with other preexisting particles, and oxidation, tending to form aged soot aggregates. Many studies reported that aged soot aggregates are abundant in urban atmosphere (Vester et al., 2007; Ebert et al., 2004). The number of carbonaceous particles was 60 among overall 116 particles analyzed from combustion as well as photochemical events in Gwangju.
Particle of microstructures with semi-transparent appearance was observed in 80 nm mobility-classified particle from photochemical event (see Figs. 9c). The semi-transparent part inside the particle indicates that some volatile species (such as nitrate, sulfate and/or volatile organic carbon), sensitive to electron beam, are vaporized within a few seconds under high vacuum and strong electron beam in the TEM (Park et al., 2008). EDS spectra obtained from such particles provide limited information about their compositions: the peaks of C, O, S, possibly N (N peaks often fail to be detected owing to vaporization). Morphology and EDS data suggest that the particles were regarded as mixtures of semi and/or less volatile organic species and ammonium sulfate/bisulfate (see Fig. 9c) (Geng et al., 2010). Approximately 12 over 95 particles were identified to be of this type in the photochemical event in urban Gwangju together with industrial Yeosu sites. Previous studies reported that in urban atmosphere, ammonium sulfate/bisulfate particles are often internally mixed with organic matter (Adachi and Buseck, 2008).
A particle with circular in shape of smooth surface, recognized as fly ash, is produced during high-temperature combustion processes and is mainly composed of Si, Al, Fe and/or Ca oxides (Maskey et al., 2011). The TEM image and X-ray spectral data of the particle observed in a 70 nm mobility-classified particle from the combustion event in industrial Yeosu (see Fig. 9d) showed that the particle must be fly ash particle. This type of particle was occasionally observed in the particles from combustion event especially in Yeosu site (about 4 over 74 particles), but such type of particle was not observed in the photochemical event. As the particles are produced from high-temperature combustion process (Kutchko and Kim, 2006), such types of particles could be generated from fuel combustion occurred in vehicles and/or industries. Moreover, Fig. 9e, shows a 35 nm mobility-classified particle from photochemical event in Gwangju site. They look dark and irregular shape with rough surface on TEM image. The presence of O, S, and Ca elements in its EDS spectrum and its morphology implies that the particle was likely to be aged Ca-rich. About 12 over 116 particles were identified to be this type in the event.
In addition, a unique morphology of particle of doughnut shaped, containing strong C peak with lower intensity O, S, and K peaks, regarded as doughnut shaped K-containing particle (see Fig. 9f), from photochemical event was also observed in 70 nm mobilityclassified particle in Gwangju. Biomass burning particles are recognized by the presence of predominant organic species such as VOCs, PAH, and black carbon along with minor inorganic species such as K, Ca, Cl, N, and/or S (Reid et al., 2005). As previously stated, the ambient aerosol of Gwangju area was influenced by biomass burning particles from nearby agricultural areas, the K-containing particle were likely to be originated from biomass burning. Among 100 particles, 4 particles were identified to be of this type in the photochemical event.
4. CONCLUSIONS
We measured particle number size distribution N (13-615 nm) in urban Gwangju, coastal Taean, and industrial Yeosu sites in Korea during the year of 2008 to compare UFP among different sampling sites, and long-term measurements were also conducted during 5 years including recent data in urban Gwangju site to examine seasonal and long-term variation of UFP number concentration. Photochemical (13-30 nm) and combustion (13-100 nm) events were identified in Gwangju atmosphere whereas only photochemical event was observed in Taean site. However, photochemical, combustion, and mixed event were observed in Yeosu site. In addition, a plume event was identified in Yeosu site. During the observation period, the UFP number concentration in the combustion event was usually higher than in the photochemical event in urban Gwangju site. In contrary, the concentrations in the combustion event were significantly lower than in the photochemical event at other sampling sites of Korea (e.g., Taean and Yeosu). On average, the highest UFPs fraction was observed at industrial Yeosu (average UFP fraction: 79% versus 59% and 58%, in Yeosu, Gwangju, and Taean, respectively), indicating that high amounts of gas pollutants (e.g., NO2 and SO2) emitted from the industry and their photochemical activity were responsible for the elevated UFPs in industrial Yeosu. Observation of the lowest UFP number concentrations in Taean indicates that the atmosphere of this site was relatively clean. Seasonally, the highest UFP number concentration was observed in spring. Annual average UFP number concentrations in Gwangju were 5.53×103 cm-3, 4.68×103 cm-3, 5.32×103 cm-3, 3.99×103 cm-3, and 2.16×103 cm-3 in the year of 2007, 2008, 2010, 2011, and 2012, respectively. Comparison of the annual average UFP number concentration with other urban cities (Beijing, Alkmaar, Erfurt, and Atlanta) showed that the concentrations of this study was lower than in the other urban cities, probably due to lower source strength in current site. Morphological and chemical compositional data from TEM/EDS for size selected UFPs identified various types of particles having different chemical species. Carbonaceous particles were observed in both combustion and photochemical events in Gwangju and Yeosu sites (60 among overall 116 particles). From the photochemical event in Gwangju site, different types of particles such as a particle of internal mixture of sulfate, chloride, sodium, and semi and/or less volatile organic species regarded as aged Na-rich, aged Ca-rich, a unique morphology of doughnut shaped K-containing particle with chemical composition of strong C with minor O, S, and K-likely to be originated from biomass burning nearby agricultural area, were identified. Particle of an internal mixture of semi and/or less volatile organic species and ammonium sulfate/bisulfate were also identified in the photochemical event in Gwangju and Yeosu sites. In addition, fly ash particles were also observed in the combustion event in Yeosu site; however, such type of particle was not observed in the photochemical event.
Acknowledgments
This work was supported by the National Research Foundation of Korea (NRF) Grant Funded by the Korean Government (MEST) (NRF-C1ABA001-2011 -0021063 and NRF-2012-0005668) and Basic Research Project through a grant provided by Gwangju Institute of Science and Technology (GIST).
References
-
Adachi, K., Buseck, P.R., (2008), Internally mixed soot, sulfates, and organic matter in aerosol particles from Mexico City, Atmospheric Chemistry and Physics, 8, p6469-6481.
[https://doi.org/10.5194/acpd-8-9179-2008]

-
Andreae, M.O., (2009), A new look at aging aerosols, Science, 326, p1493-1494.
[https://doi.org/10.1126/science.1183158]

- Birmili, W., Berresheim, H., Plass-Dülmer, C., Elste, T., Gilge, S., Wiedensohler, A., Uhrner, U., (2003), The Hohenpeissenberg aerosol formation experiment (HAFEX): a long-term study including size-resolved aerosol, H2SO4, OH, and monoterpenes measurements, Atmospheric Chemistry and Physics, 3, p361-376.
-
Brock, C.A., Trainer, M., Ryerson, T.B., Neuman, J.A., Parrish, D.D., Holloway, J.S., Nicks Jr, D.K., Frost, G. J., Hubler, G., Fehsenfeld, F.C., (2003), Particle growth in urban and industrial plumes in Texas, Journal of Geophysical Research, 108, p4111-4122.
[https://doi.org/10.1029/2002jd002746]

-
Dockery, D.W., Pope, C.A., (1994), Acute respiratory effects of particulate air pollution, Annual Reviews Public Health, 15, p107-132.
[https://doi.org/10.1146/annurev.publhealth.15.1.107]

-
Dunn, M.J., Jiménez, J.L., Baumgardner, D., Castro, T., McMurry, P.H., Smith, J.N., (2004), Measurements of Mexico City nanoparticle size distributions: Observations of new particle formation and growth, Geophysical Research Letters, 3, L10102.
[https://doi.org/10.1029/2004GL019483]

-
Ebert, M., Weinbruch, S., Hoffmann, P., Ortner, H.M., (2004), The chemical composition and complex refractive index of rural and urban influenced aerosols determined by individual particle analysis, Atmospheric Environment, 38, p6531-6545.
[https://doi.org/10.1016/j.atmosenv.2004.08.048]

-
Geng, H., Kang, S., Jung, H.-J., Choël, M., Kim, H., Ro, C.-U., (2010), Characterization of individual submicrometer aerosol particles collected in Incheon, Korea, by quantitative transmission electron microscopy energydispersive X-ray spectrometry, Journal of Geophysical Research, 115, pD15306.
[https://doi.org/10.1029/2009JD013486]

-
Gwinn, M.R., Vallyathan, V., (2006), Nanoparticles: Health effects-Pros and cons, Environmental Health Perspectives, 114, p1818-1825.
[https://doi.org/10.1289/ehp.8871]

-
Harris, S.J., Maricq, M.M., (2001), Signature size distributions for diesel and gasoline engine exhaust particulate matter, Journal of Aerosol Science, 32, p749-764.
[https://doi.org/10.1016/s0021-8502(00)00111-7]

- IPCC, (2007), Climate Change, Cambridge University Press, New York.
-
Kang, S.J., Hwang, H.J., Kang, S., Park, Y.M., Kim, H.K., Ro, C.-U., (2009), Quantitative ED-EPMA combined with morphological information for the characterization of individual aerosol particles collected in Incheon, Korea, Atmospheric Environment, 43, p3445-3453.
[https://doi.org/10.1016/j.atmosenv.2009.05.008]

-
Kulmala, M., Korhonen, P., Napari, I., Karlsson, A., Berresheim, H., O’Dowd, C.D., (2002), Aerosol formation during PARFORCE: Ternary nucleation of H2SO4, NH3, and H2O, Journal of Geophysical Research, 107, p8111-8121.
[https://doi.org/10.1029/2001jd000900]

- Kulmala, M., (2003), How particles nucleate and grow, Science, 302, p1000-1001.
-
Kulmala, M., Kerminen, V.-M., Anttila, T., Laaksonen, A., O’Dowd, C.D., (2004), Organic aerosol formation via sulphate cluster activation, Journal of Geophysical Research, 109, pD04205.
[https://doi.org/10.1029/2003JD003961]

-
Maskey, S., Kang, T.H., Jung, H.J., Ro, C.-U., (2011), Single particle characterization of indoor aerosol particles collected at an underground shopping area in Seoul, Korea, Indoor Air, 21, p12-24.
[https://doi.org/10.1111/j.1600-0668.2010.00677.x]

-
McMurry, P.H., Eisele, F.L., (2005), Preface to topical collection on new particle formation in Atlanta, Journal of Geophysical Research, 110, D22S01.
[https://doi.org/10.1029/2005JD006644]

-
McMurry, P.H., Woo, K.S., Weber, R., Chen, D.-R., Pui, D.Y.H., (2000), Size distribution of 3-10 nm atmospheric particles: implications for nucleation mechanisms, Philosophical Transactions of the Royal Society of London Series B Biological Sciences, 358, p2625-2642.
[https://doi.org/10.1098/rsta.2000.0673]

- Oberdürster, G., (2000), Toxicology of ultrafine particles: In vivo studies, Philosophical Transactions of the Royal Society A, 358, p2719-2740.
- O’Dowd, C.D., Aalto, P., Hämeri, K., Kulmala, M., Hoffmann, T., (2002a), Atmospheric particles from organic vapours, Nature, 416, p497-498.
- O’Dowd, C.D, Jimenez, J.L., Bahreini, R., Flagan, R.C., Seinfeld, J.H., Hämeri, K., Pirjola, L., Kulmala, M., Jennigns, S.G., Hoffmann, T., (2002b), Marine aerosol formation from biogenic iodine emissions, Nature, 417, p632-636.
-
Park, K., Park, J.Y., Kwak, J.H., Cho, G.N., Kim, J.S., (2008), Seasonal and diurnal variations of ultrafine particle concentration in urban Gwangju, Korea: Observation of ultrafine particle events, Atmospheric Environment, 42, p788-799.
[https://doi.org/10.1016/j.atmosenv.2007.09.068]

-
Peters, A., Wichmann, H.E., Tuch, T., Heinrich, J., Heyder, J., (1997), Respiratory effects are associated with the number of ultrafine particles, American Journal of Respiratory and Critical Care Medicine, 155, p1376-1383.
[https://doi.org/10.1164/ajrccm.155.4.9105082]

-
Qian, S., Sakurai, H., McMurry, P.H., (2007), Characteristics of regional nucleation events in urban East St. Louis, Atmospheric Environment, 41, p4119-4127.
[https://doi.org/10.1016/j.atmosenv.2007.01.011]

-
Reid, J.S., Koppmann, R., Eck, T.F., Eleuterio, D.P., (2005), A review of biomass burning emissions part II: intensive physical properties of biomass burning particles, Atmospheric Chemistry and Physics, 5, p799-825.
[https://doi.org/10.5194/acp-5-799-2005]

-
Ristovski, Z.D., Morawska, L., Bofinger, N.D., Hitchins, J., (1998), Submicrometer and supermicrometer particulate emission from spark ignition vehicles, Environmental Science and Technology, 32, p3845-3852.
[https://doi.org/10.1021/es980102d]

-
Ruuskanen, J., Tuch, T., Ten Brink, H., Peters, A., Khlystov, A., Mirme, A., Kos, G.P.A., Brunekreef, B., Wichmann, H.E., Buzorius, G., (2001), Concentrations of ultrafine, fine and PM2. 5 particles in three European cities, Atmospheric Environment, 35, p3729-3738.
[https://doi.org/10.1016/s1352-2310(00)00373-3]

-
Shi, J.P., Evans, D.E., Khan, A.A., Harrison, R.M., (2001), Sources and concentration of nanoparticles (⁄10 nm diameter) in the urban atmosphere, Atmospheric Environment, 35, p1193-1202.
[https://doi.org/10.1016/s1352-2310(00)00418-0]

-
Sioutas, C., Delfino, E.J., Singh, M., (2005), Exposure assessment for Atmospheric Ultrafine Particles (UFPs) and implications in epidemiological research, Environmental Health Perspectives, 113, p947-955.
[https://doi.org/10.1289/ehp.7939]

- Stanier, C.O., Khlystov, A.Y., Pandis, S.N., (2004a), Ambient aerosol size distributions and number concentrations measured during the Pittsburgh Air Quality Study (PAQS), Atmospheric Environment, 38, p3275-3284.
- Stanier, C.O., Khlystov, A.Y., Pandis, S.N., (2004b), Nucleation events during the Pittsburgh Air Quality Study: Description and relation to key meteorological, gas phase, and aerosol parameters, Aerosol Science and Technology, 38, p253-264.
-
Stolzenburg, M.R., McMurry, P.H., Sakurai, H., Smith, J. N., Mauldin, R.L., III, Eisele, F.L., Clement, C.F., (2005), Growth rates of freshly nucleated atmospheric particles in Atlanta, Journal of Geophysical Research, 110, D22S05.
[https://doi.org/10.1029/2005JD005935]

-
Watson, J.G., Chow, J.C., Park, K., Lownthal, D.H., (2006), Nanoparticle and ultrafine particle events at the Fresno Supersite, Journal of Air and Waste Management Association, 56, p417-430.
[https://doi.org/10.1080/10473289.2006.10464526]

- Woo, K.S., Chen, D.R., Pui, Y.H., McMurry, P.H., (2001a), Measurement of Atlanta aerosol size distributions: Observations of ultrafine particle events, Aerosol Science and Technology, 34, p75-87.
- Woo, K.S., Chen, D.R., Pui, D.Y.H., McMurry, P.H., (2001b), Measurement of Atlanta aerosol size distributions: observations of ultrafine particle events, Aerosol Science and Technology, 34, p75-87.
-
Wu, Z., Hu, M., Liu, S., Wehner, B., Bauer, S., (2007), New particle formation in Beijing, China: Statistical analysis of a 1-year data set, Journal of Geophysical Research, 112, D09209.
[https://doi.org/10.1029/2006JD007406]

-
Wu, Z., Hu, M., Lin, P., Liu, S., Wehner, B., Wiedensohler, A., (2008), Particle number size distribution in the urban atmosphere of Beijing, China, Atmospheric Environment, 42, p7967-7980.
[https://doi.org/10.1016/j.atmosenv.2008.06.022]

-
Vester, B.P., Ebert, M., Barnert, E.B., Schneider, J., Kandler, K., Schutz, L., Weinbruch, S., (2007), Composition and mixing state of the urban background aerosol in the Rhein-Main area (Germany), Atmospheric Environment, 41, p6102-6115.
[https://doi.org/10.1016/j.atmosenv.2007.04.021]

-
Young, L.H., Keeler, G.J., (2007), Summertime ultrafine particles in urban and industrial air: Aitken and nucleation mode particle events, Aerosol and Air Quality Resarch, 7, p379-402.
[https://doi.org/10.4209/aaqr.2007.02.0012]

