Anomalous Variations in Atmospheric Carbon Monoxide Associated with the Tsunami
Abstract
Variations in ambient atmospheric carbon monoxide (CO) observed at an inland mining site in the Indo-Gangetic plains, Jaduguda (22°38′ N, 86°21′ E, 122m MSL, ~75 km away from the coast of the Bay of Bengal) during the Tsunami of 26 December 2004 were monitored. CO mixing ratio over this site was measured using a non-dispersive infrared analyzer (Monitor Europe Model 9830 B). Back trajectory analysis data obtained using NOAA Hybrid Single Particle Lagrangian Integrated Trajectory (HYSPLIT) Model was also used for this study. Variations in CO mixing ratio at a coastal site, Thiruvananthapuram (8°29′ N, 76°57′ E, located ~2 km from the Arabian Sea coast) have also been investigated using CO data retrieved from the Measurement Of Pollution In The Troposphere (MOPITT) instrument. Ground-based measurements indicated abnormal variations in CO mixing ratio at Jaduguda from 25 December 2004 evening (previous day of the Tsunami). MOPITT CO data showed an enhancement in CO mixing ratio over Thiruvananthapuram on the Tsunami day. Back trajectory analyses over Thiruvananthapuram and Jaduguda for a period of 10 days from 21st to 30th December 2004 depicted that there were unusual vertical movements of air from high altitudes from 25 December 2004 evening. CO as well as the back trajectory analyses data showed that the variations in the wind regimes and consequently wind driven transport are the most probable reasons for the enhancement in CO observed at Jaduguda and Thiruvananthapuram during the Tsunami.
Keywords:
Carbon monoxide, Tsunami, Mixing ratio, Back trajectory, Enhancement1. INTRODUCTION
Carbon monoxide (CO) is one of the most common and widely distributed air pollutants in the troposphere and it plays a key role in tropospheric chemistry. CO has a major role in determining the chemical composition and radiative properties of the atmosphere (Novelli et al., 1998). Influence of CO emission on radiative forcing was estimated to be more than the direct influence of N2O (Daniel and Solomon, 1998). CO contributes to the buildup of other greenhouse gases like methane (Crutzen and Golitsyn, 1992; Isaksen et al., 1992; Thompson, 1992; Crutzen and Andrea, 1990) through its reaction with hydroxyl radical (OH). OH is an important chemical scavenger for strong greenhouse gases such as methane and tropospheric ozone. CO has both natural and anthropogenic sources. Anthropogenic emissions of CO originate mainly from incomplete combustion of carbonaceous materials like fossil fuels, biomass etc. CO affects human and other oxygen-breathing organisms (Bernstein et al., 2008; James et al., 2000; U.S. Environmental Protection Agency (EPA), 1995). CO is used as a good tracer of long-range atmospheric transport as its molecular weight is close to that of air and it has a long lifetime within the boundary layer (Dickerson et al., 2002). Depending upon altitude and season, tropospheric lifetime of CO is between 1 to 2 months (Reichle et al., 1990). As a primary indicator of incomplete combustion it is also used as a proxy for inferring emissions and distributions of other species that are not so readily measured.
Understanding the impact of CO on global tropospheric chemistry requires global measurements of the atmospheric CO distribution. A strong infrared spectrum within the 2,100-2,200cm-1 spectral range makes CO readily observable by ground, air, and space-based remote-sensing observations. Measurement of Pollution in The Troposphere (MOPITT) instrument provides the first opportunity to routinely obtain regular global observations of the horizontal and vertical distribution of CO in the troposphere. It is an eight-channel gasfilter correlation radiometer onboard the EOS Terra spacecraft launched on 18 December, 1999 and measures the spatial and temporal distributions of CO CH4 over a period of two to five years (Drummond, 1992).
Since CO is an excellent tracer of atmospheric motions, the changes in atmosphere cause variations in CO levels. Abrupt alterations in circulation and meteorology associated with natural hazards like earthquake, Tsunami etc. may cause changes in the trace gas levels. Large vertical and horizontal wave motions linked to these hazards vary the wind regimes and wind driven transport. Such sudden changes invoke bulk transport of species like CO from polluted regions, which may lead to variations in the mixing ratio over that region.
Studies (Tzanis et al., 2007) were conducted for examining the impact of earthquakes on aerosols (Okada et al., 2004) and gaseous pollutants in the atmosphere. Geologists maintained that there is no connection between weather and earthquakes. But several recent studies (Singh et al., 2010b; Ganguly, 2009) reported that changes in surface, atmosphere and gases like ozone are associated with earthquakes. Surface and air temperature, RH and surface latent heat flux changes showed complementary nature one day prior to the earthquake. An enhancement in nitric oxide mixing ratio of ten times larger than the average peak level of normal days were reported by Matsuda and Ikeya (2001) before the Kobe earthquake on 17 January 1995. Singh et al. (2010a) reported anomalous changes in CO concentrations prior to the main earthquake in Gujarat on 26 January 2001.
The east and west coasts of India have experienced the aftereffects of an undersea mega thrust earthquake of magnitude Mw 9.3 at 3.316°N, 95.854°E off the coast of Sumatra in the Indonesian Archipelago at 00:58:53 UTC on 26 December 2004. The high magnitude, Mw 9.3 of the earthquake and its shallow epicenter (~30 km below the ocean floor) has triggered Tsunami in the northeast Indian Ocean. The intensity of the Tsunami wave that hit along the coastline of Orissa and Andhra Pradesh was weak due to their diagonal propagation. However, southern and eastern coasts of India and Sri Lanka experienced much stronger Tsunami due to their location in mere western side of epicenter. Tsunami experienced at the west coast of India (Kerala) is due to the wave refraction beyond Kanyakumari. Tide gauge data from major Ports of India maintained by Survey of India has been processed by National Institute of Oceanography which showed that the Tsunami hit the eastern coastal area of India 09:06 h IST and the west coast at around 11:10 h IST.
Present study describes the variations in CO levels observed at a rural mining site in the Indo-Gangetic plains, Jaduguda and at a coastal site, Thiruvananthapuram during the most devastating Tsunami on 26 December 2004. These two measurements sites were at a distance of ~1,800 km.
2. MEASUREMENTS AND METHODS
2. 1 Measurement Sites
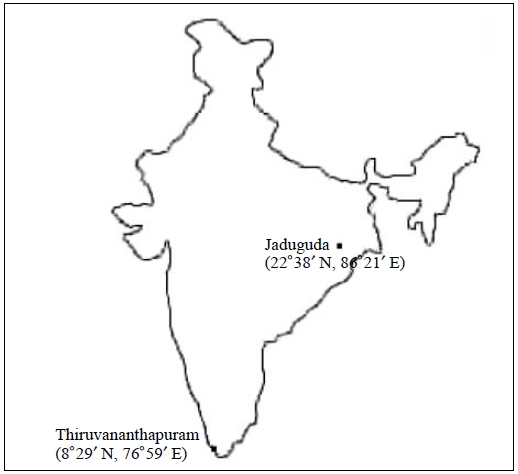
Jaduguda in Jharkhand state, India (22.50°N, 85.670° E, 122 m MSL) is a rural location in the Indo-Gangetic plains. It is an inland station located ~75 km away from the coast of the Bay of Bengal. Jaduguda is a place surrounded by the Chotanagpur hills and this region is rich in uranium deposits. CO in ambient air over Jaduguda was measured for a month, from 8th to 31st December 2004. The measurement site was located at Uranium Corporation of India (UCIL) campus in Jaduguda. At this site five uranium mines were active and large and heavy machineries were in operation during the period of CO measurements. Nearest city to the site of observation was Jamshedpur, ~25 km from the measurement site. A map showing the locations of the measurement sites is given in Fig. 1.
The measurement site at Thiruvananthapuram was a clean coastal site on the west coast of India (8°29′ N, 76°57′ E, ~15m MSL on the banks of a lake). It is about 3 km away from heavy traffic of the city and a plain terrain on the Arabian Sea coast, located about ~2 km away from the coastline. It is a sparsely populated area with good vegetation and a mild climate that is not too warm in summers and not too cold in winters. Monsoon has a prominent role in the meteorology at this region with an annual rainfall of 315 cm. The prevailing winds at the site are sea breeze and land breeze. Sea breeze circulation is westerly and land breeze circulation is almost easterly in all the seasons. CO at this coastal site has been monitoring continuously since 2003.
2. 2 Instrumentation and Methods
Ambient CO at Jaduguda and Thiruvananthapuram was measured using a non-dispersive IR analyzer (Monitor Europe, Model 9830B). The analyzer measures CO by spectroscopic absorption at the IR wavelength 4.6 μm. It measures CO from 0-200 ppm in 4 ranges, with 0-50 as the default range. The lowest CO level detectability is ~10 ppb full range and the accuracy of measurement is 1% of measured value in the lowest range. This instrument was internally calibrated against a known source of CO gas that is traceable to National Institute of Standards and Technology, USA. An inter-comparison of similar six CO measuring instruments was done at National Physical Laboratory (NPL), New Delhi in Nov 2004. More details of the instrument available elsewhere (Aneesh et al., 2008).
MOPITT CO data was used for studying the variations in CO over Thiruvananthapuram during the Tsunami. MOPITT instrument is onboard the Terra spacecraft launched on 18 December, 1999, which is flying in a polar sun synchronous orbit at an altitude of 705 km and measures CO and CH4 in the troposphere (Drummond, 1992). MOPITT has a swath width of about 600 km, means total global coverage can be achieved in ~3 days, which represents an improvement in spatial coverage over the IMG and MAPS instruments. MOPITT is a multichannel gas correlation radiometer (Tolton and Drummond, 1997). It uses gas correlation spectroscopy in six channels for CO in two distinct bands: the solar band at 2.3μm consisting of two Length Modulated Cell (LMC) channels and the thermal band at 4.7 μm comprising of two LMC and two Pressure Modulated Cell (PMC) channels. The MOPITT data set contains CO total column amount, CO mixing ratios at different altitudes (pressure levels) and the corresponding location and time along the track. The CO signals are measured with a horizontal resolution of 22 km and a vertical resolution of 3 km with a precision of about 10%. In the present study, we have used MOPITT level 3 version 4 CO data (http://mopitt.eos.ucar.edu/mopitt/data/index.html).
HYSPLIT (HYbrid Single Particle Lagrangian Integrated Trajectory) Model is used for computing air parcel trajectories. It computes simple air parcel trajectories to complex dispersion and deposition simulations. The dispersion of a pollutant is calculated by assuming either puff or particle dispersion. HYSPLIT computes the advection/trajectory of a single pollutant particle without the additional dispersion modules. Forward or backward trajectories over a region can be obtained from the trajectories archives from http://www.arl.noaa.gov/HYSPLIT_info.php.
3. RESULTS AND DISCUSSION
3. 1 Observed variations in CO over Jaduguda during the Tsunami
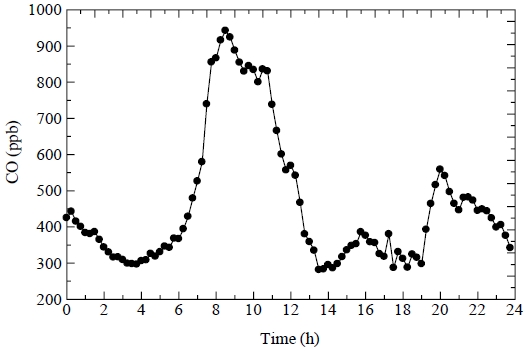
Ambient atmospheric CO at Jaduguda was measured continuously from 8th to 31st December 2004 as part of a campaign organized by the Indian Space Research Organization (ISRO) under the ISRO-Geosphere Biosphere Programme. Fig. 2 depicts the average diurnal CO pattern for the entire campaign period (December 9-31, 2004) observed at Jaduguda. It shows two distinct peaks, one in the morning (~08:00 h, IST) and the other in the late evening (~20:00 h, IST). Average CO observed during measurement period was 425 ppb. Since open mines function as storage for stagnant air that trap CO from the mines, the high background CO in ambient air could be due to the operation of open mines.
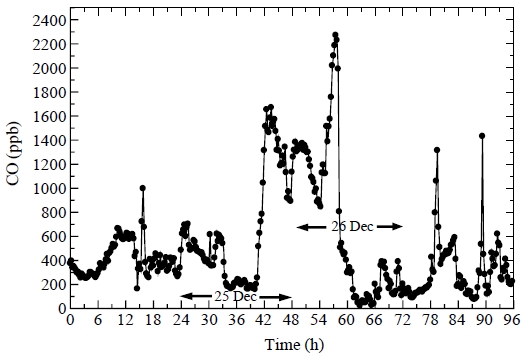
Temporal variations of CO for the campaign period show high CO mixing ratio during 26 December 2004 - the Tsunami day. Fig. 3 shows CO mixing ratio for a period of four days from 24th to 27th December 2004. Each point in Fig. 3 represents the CO value at 15-minute intervals as measured by the CO analyzer. A horizontal arrow in Fig. 3 represents the Tsunami day. The Tsunami waves hit the eastern coastal areas of India at around 09:00 h on December 26, 2004. From Fig. 3, it has been seen that, ambient CO at Jaduguda showed a very high mixing ratio on 26th December, in fact, the highest during the campaign period. CO levels went up to 2,271 ppb on the Tsunami day. Diurnal average CO mixing ratio over Jaduguda on the Tsunami day is found to be 707 ppb, which is ~2.2 times more than that of the normal days (325 ppb). A similar high in CO mixing ratio of slightly lesser magnitude is also found prior to the Tsunami, evening of the previous day (25 December 2004). A sudden increase in CO mixing ratio started at around 16:45 h on 25 December 2004 and attained a maximum of 1,674 ppb at around 18:30 h and it gradually decreased to 892 ppb at around 23:45 h. There after it started going high and continued to be high till the early morning hours (04:45 h) of the next day, 26 December 2004. CO mixing ratio is observed to be low from 04:45 h to 06:15 h on 26 December 2004 (Tsunami day), started increasing at around 06:30 h and it went high till 10:00 h with the highest value (2,271 ppb) at around 09:30 h. A low CO mixing ratio was observed after 10:00 h and continued to be low till 18:00 h, again it went high till the next day morning.
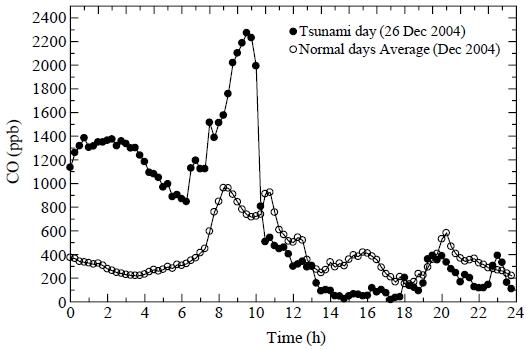
Fig. 4 shows CO diurnal pattern on the Tsunami day and average diurnal CO on normal days in December 2004. A very low CO mixing ratio can be seen during the morning hours on normal days. While from Fig. 3, it can be seen that CO mixing ratio during the morning hours as well as the morning peak on Tsunami day are very high compared to normal days. CO morning peak on a normal day is found to be ~937 ppb at around 08:30 h but on Tsunami day it is seen to be 2,271 ppb at around 09:30 h. Diurnal CO pattern on normal days shows low CO mixing ratio during the noon hours (12:30 h to 14:30 h). A low CO mixing ratio can also be seen from 17:00 to 19:15 h in the evening. High power diesel engines used for mining and transportation of raw materials at the mining site caused variations in diurnal CO. The observed lows in CO mixing ratio from 12:30 h to 14:30 h could be due to the break in operating time of mining activities. Earlier studies at the same mining site (Mohan Kumar et al., 2008) also reported that CO mixing ratio at this site depended on the operations of the mines. From Fig. 4 it can be seen that, on the Tsunami day, CO mixing ratio is very low from 10:00 h till the next day morning compared to normal days. Unlike normal days, diurnal CO pattern on the Tsunami day shows frequent highs and lows in CO mixing ratio during the night hours.
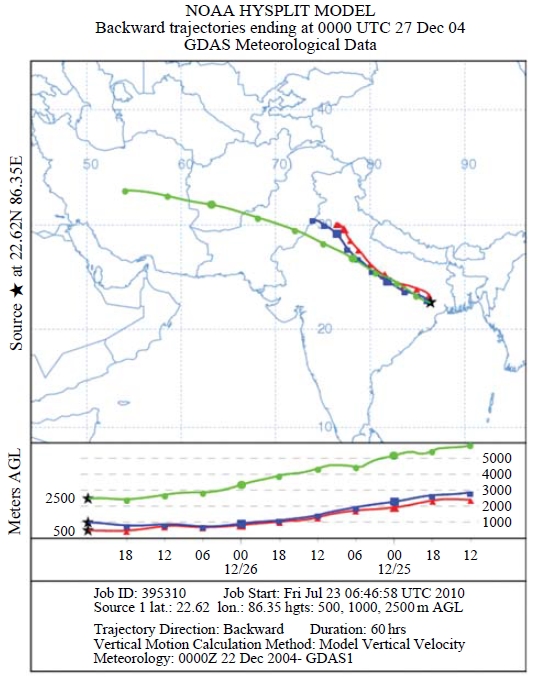
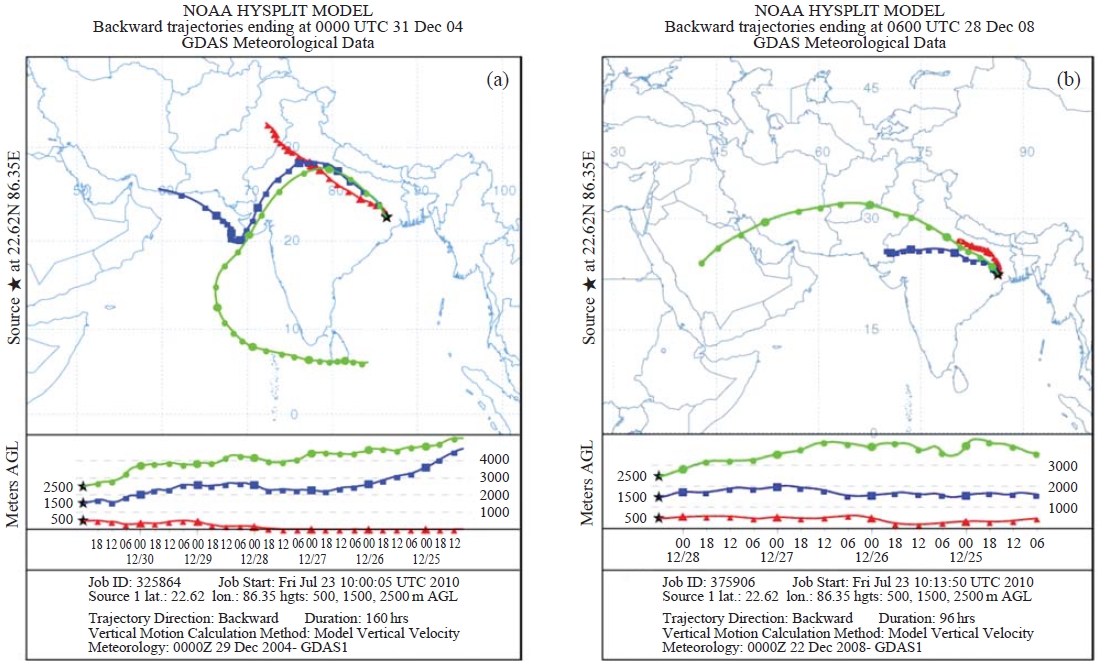
Fig. 5 depicts the back trajectory analysis over Jaduguda at shorter intervals (6 h) from 24 December 2004 to 27 December 2004. It shows vertical atmospheric circulations from high altitude to surface (<500m AGL) over Jaduguda. Strong vertical air movements from high altitudes can be seen on 25 December 2004 and on 26 December 2004. The vertical mixing of air started at around ~16:30 h on 25 December 2004 and it continued till around 17:30 h on 26 December 2004. A very high vertical mixing of air can be seen at around ~08:30 h to 10:30 h IST (03:00 to 05:00 UTC) on 26 December 2004. Ground-based CO measurements from the analyzer on 26 December 2004 shows a high CO mixing ratio from 08:30 h to 10:00 h, the time in which high vertical mixing occurred over Jaduguda. The high CO observed from 16:45 h on 25 December 2004 also coincides with the occurrence of vertical air mixing on the same day. The back trajectory analysis shown in Fig. 5 also shows the horizontal wind pattern over Jaduguda from 25 December 2004 to 27 December 2004. The horizontal wind pattern makes it clear that the winds coming from the north-west (NW) direction of Jaduguda causes transport of high CO from highly polluted regions situated NW of the measurement site. Fig. 6(a) depicts the back trajectory analysis at 500 m, 1,500 m and 2,500 m AGL over Jaduguda from 24 December 2004 to 31 December 2004. Back trajectory analysis on normal days in December 2008 is shown in Fig. 6(b). It can be seen that the horizontal as well the vertical wind patterns over Jaduguda on normal days (Fig. 6(b)) and on the Tsunami day (Fig. 6(a)) are significantly different.
3. 2 CO Variations Associated with the Tsunami over Thiruvananthapuram
As the Tsunami waves hit the west coast of India, in this study we have included the measurements of CO at a coastal station, Thiruvananthapuram, which is situated at the west coast of India. Such a measurement will help us to know the variation in CO associated with the changes in atmospheric conditions during the natural hazards like the Tsunami. Ground-based measurements of CO over at Thiruvananthapuram have been carried out continuously since 2003 using a non-dispersive IR analyzer, Monitor Europe Model 9830 B. The same analyzer was used for CO measurements at Jaduguda in December 2004. Due to the deployment of the instrument at Jaduguda, ambient CO measurements over Thiruvananthapuram in December 2004 were not possible. For monitoring the variations in CO mixing ratio over Thiruvananthapuram during the Tsunami 2004, we have used the satellite measurements of CO retrieved from MOPITT. Satellite CO data show high CO mixing ratio over Thiruvananthapuram on the Tsunami day (26 December 2004). It shows a high CO mixing ratio of ~225 ppb at 1,000 mb(surface) over Thiruvananthapuram on the Tsunami day compared to normal days in December (~200 ppb using satellite measurements, ~195 ppb using groundbased measurements). Earlier studies (Okada et al., 2004; Gupta et al., 2002) reported release of gases and oozing of water prior to the earthquake event. This supports the enhancement of CO and also changes in atmospheric parameters. Such an enhancement in CO mixing ratio is also seen at high altitudes in the troposphere on the Tsunami day.
CO mixing ratio at different altitudes (1,000-100 mb pressure levels) in the troposphere on the Tsunami day (26 December 2004), a day before the Tsunami (21 December 2004) and a day after the Tsunami (December 30, 2004) are shown in Fig. 7(a). A sudden increase in CO concentrations on the Tsunami day is also observed at 900, 800 and 700, 600 and 500 mb pressure levels compared to a normal day before the Tsunami (December 21, 2004). But on normal days, enhancement in surface CO causes enhancements in CO only up to 700 mb pressure level (~3 km altitude) on the same day. Even in summer, in which high boundary layer causes faster dispersion of pollutants to high altitude, transport of CO from 700 to 400 mb in the troposphere over Thiruvananthapuram takes more than a week. The gaseous pollutants like CO takes more time in winter than that in summer to get transported to high altitudes in the troposphere due to low boundary layer height in winter. On the contrary, dispersion of CO from 1,000 to 400 mb on the Tsunami day took only less than 12 h. Vertical mixing of air in the troposphere due to strong vertical circulations associated with the Tsunami could be the possible reason for this. From Fig. 7(a), it can be seen that CO mixing ratio from 300 to 100 mb is high on 28th December 2004 compared to the Tsunami day. It shows that high CO at 400 mb altitude takes only 2 days to get transported to 100 mb. But, even in summer, it needs nearly one week to get transported the gaseous pollutants like CO from 400 to 100 mb (Fig. 6(b)). Only very strong vertical circulations can cause such fast and strong vertical dispersion of pollutants to high altitudes in the troposphere.
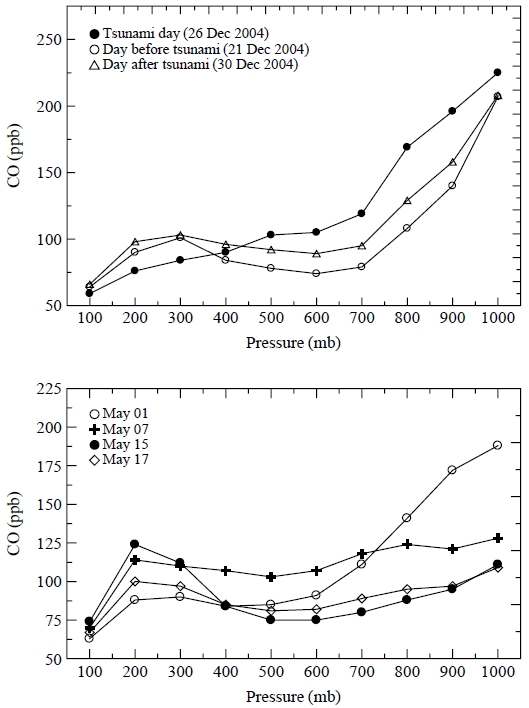
(a) CO mixing ratio at different altitudes (1,000-100 mb pressure levels) in the troposphere over Thiruvananthapuram from 26-30 December 2004. (b) CO mixing ratio at different altitudes (1,000-100 mb pressure levels) in the troposphere over Thiruvananthapuram during a summer month (1-17 May 2008).
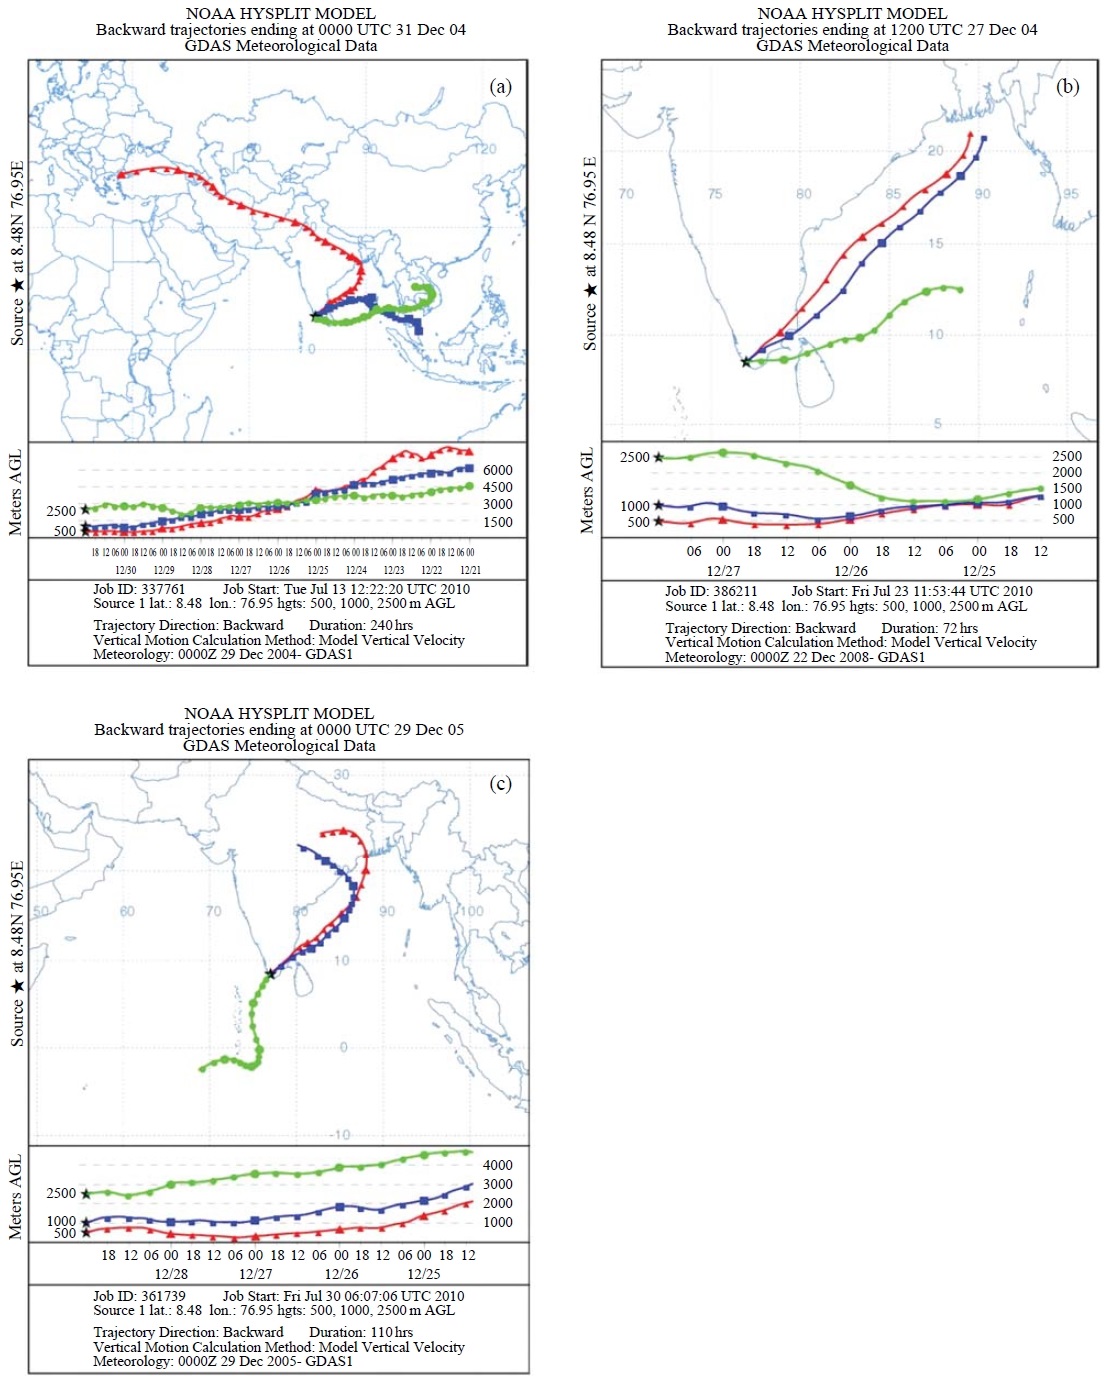
Fig. 8(a) depicts the back trajectory analysis over Thiruvananthapuram from 21st December 2004 to 31st December 2004. Strong vertical circulations over Thiruvananthapuram on the previous day of the Tsunami (25 December 2004) can be seen from Fig. 8(a). Vertical mixing of air over Thiruvananthapuram at ~17:30 h on 25 December 2004 is seen from Fig. 8 (a). It shows that the winds from high altitudes (>6 km) in the troposphere converged at ~3 km height. Convergence of high altitude winds causes a high degree of vertical mixing of air in the troposphere. Fig. 8(a) also shows the horizontal winds blown from the Bay of Bengal area. The strong horizontal as well as the vertical circulations along with the convergence in the lower troposphere causes accumulation of high CO at the surface over Thiruvananthapuram. Fig. 8(b) shows the back trajectory analysis from 24th December 2004 to 27th December 2004 over Thiruvananthapuram. Vertical mixing of air over Thiruvananthapuram on 25th December 2004 can be seen from Fig. 8(b). The back trajectory analysis over Thiruvananthapuram during the normal days in December 2008 is shown in Fig. 8(c). It can be seen that the back trajectory analysis during the days near to the Tsunami in December 2004 is significantly different from that of the normal days during December in the successive year (December 2005).
4. CONCLUSIONS
Observed the variations in CO mixing ratio associated with the Tsunami in 2004 over an inland mining site in the Indo-Gangetic plains, Jaduguda and over a coastal site Thiruvananthapuram, located on the south west coast of India. High CO mixing ratios were observed at Jaduguda and Thiruvananthapuram on the Tsunami day in 2004. Even though the two sites were at a distance of more 1,800 km and the topography as well as the distance of the two sites from the sea was entirely different, a similar enhancement in CO mixing ratio at both the sites were observed during the Tsunami. Diurnal average CO mixing ratio over Jaduguda on the Tsunami day was found to be 707 ppb (with a peak of ~2,271 ppb at around 10:00 h). This was ~2.2 times more than that of the CO levels on normal days (325 ppb). A similar high in CO mixing ratio of slightly lesser magnitude (1,674 ppb) was also found prior to the Tsunami, the previous day (25 December 2004) evening (16:45 h). CO was observed to be increasing at ~06:30 h on the Tsunami day and it continued to be high till 10:00 h with high CO (~2,271 ppb) at around 09:30 h. A low CO mixing ratio was observed after 10:00 h and it went low till 18:00 h. The back trajectory analysis over Jaduguda showed strong vertical mixing of high altitude downward winds in the troposphere on the Tsunami day (~08:30 h to 10:30 h IST (03:00-05:00 UTC)) as well as on the previous day evening (started at ~16:30 h and continued till next day morning). It was seen that the enhancements in CO mixing ratio observed on 25th December, 2004 and 26th December, 2004 were found to be coinciding with the occurrence of vertical air mixing on those days. The horizontal wind pattern from the back trajectory analysis showed that the winds coming from the NW direction of Jaduguda caused transport of high CO from highly polluted regions to the measurement site. MOPITT CO over Thiruvananthapuram showed a high CO mixing ratio of ~225 ppb at 1,000mb (surface) on the Tsunami day compared to normal days in December (~200 ppb). CO mixing ratio at different altitudes in the troposphere over Thiruvananthapuram also showed high CO at 900, 800 and 700, 600 and 500 mb pressure layers compared to normal days. On normal days high surface CO causes CO enhancements only up to 700 mb (~3 km) altitude within a day. On contrary to this, dispersion of CO from 1,000 to 400 mb on the Tsunami day took place within 12 h. A strong vertical mixing of winds from high altitudes (>6 km) in the troposphere was observed over Thiruvananthapuram at ~17:30 h on 25 December 2004. Strong horizontal as well as the vertical circulations and air mixing in the lower troposphere caused accumulation of high CO at the surface over Thiruvananthapuram. This horizontal and vertical convection caused transport of CO from highly polluted region to other places and from high altitude to the surface. Variations in CO mixing ratio as well as the back trajectory data analysis showed that the changes in the vertical and the horizontal transport pattern were the most probable reason for the abnormal enhancements in CO observed over Jaduguda and Thiruvananthapuram during the Tsunami.
Acknowledgments
Authors express their gratitude to Indian Space Research Organization, Government of India for funding the project under the Geosphere Biosphere Programme through the Space Physics Laboratory, Vikram Sarabhai Space Centre, Thiruvananthapuram. The authors thank the Director, Centre for Earth Science Studies for all support.
REFERENCES
-
Aneesh, V.R., Mohan Kumar, G., Sampath, S., (2008), Spatial distribution of atmospheric carbon monoxide over Bay of Bengal and Arabian Sea: Measurements during pre-monsoon period of 2006, Journal of Earth System Science, 117(4), p449-455.
[https://doi.org/10.1007/s12040-008-0044-8]

- Bernstein, J.A., Alexis, N., Bacchus, H., Bernstein, I.L., Fritz, P., Horner, E., Li, N., Mason, S., Nel, A., Oullette, J., Reijula, K., Reponen, T., Seltzer, J., Smith, A., Tarlo, S.M., (2008), The health effects of non-industrial indoor air pollution, Journal of Allergy and Clinical Immunology, 121(3), p585-591.
- Crutzen, P.J., Golitsyn, G.S., (1992), Linkags between global warming, ozone depletion and other aspects of global environmental changes, In Confronting Climate Change: Risks, Implications and Responses, Mintzer, H.M., Ed.Cambridge University Press, Cambridge, p15-92.
-
Crutzen, P.J., Andrea, M.O., (1990), Biomass burning in the tropics:impact on atmospheric chemistry and biogeochemical cycles, Science, 250, p669-1678.
[https://doi.org/10.1126/science.250.4988.1669]

-
Daniel, J.S., Solomon, S., (1998), On the climate forcing of carbon monoxide, Journal of Geophysical Research, 103, p13249-13260.
[https://doi.org/10.1029/98jd00822]

-
Dickerson, R.R., Andreae, M.O., Campos, T., Mayol-Bracero, O.L., Neusuess, C., Streets, D.G., (2002), Analysis of black carbon and carbon monoxide observed over the Indian Ocean: Implications for emissions and photochemistry, Journal of Geophysical Research, 107(D19), p8017.
[https://doi.org/10.1029/2001jd000501]

- Drummond, J.R., (1992), Measurements of pollution in the troposphere (MOPITT), In The Use of EOS for Studies of Atmospheric Physics, Gille, J.C., and Visconti, G., Eds.North-Holland, Amsterdam, p77-101.
-
Ganguly, N.D., (2009), Variation in atmospheric ozone concentration following strong earthquakes, International Journal of Remote Sensing, 30(2), p349-356.
[https://doi.org/10.1080/01431160802282862]

- Gupta, S.K., Bhandari, N., Thakker, P.S., Rengaranjan, R., (2002), On the origin of the artesian groundwater and escaping gas at Narveri after the 2001 Bhuj earthquake, Current Science, 82, p463-468.
- Isaken, I.S.A., Ramaswamy, V., Rodhe, H., Wingley, T.M.L., (1992), Rdaiative forcing of climate. In Climate change 1992: The supplymentary report to the IPCC Scientific assessment, Cambridge University Press, Cambridge, p47-67.
- James, A.R., Monique, M.N., Neil, B.H., Stephen, R.T., (2000), Carbon monoxide poisoning-a public health perspective, Toxicology, 145(1), p1-14.
- Matsuda, T., Ikeya, M., (2001), Variation of nitric oxide concentration before the Kobe earthquake, Japan Atmospheric Environment, 35, p3097-3102.
- Mohan Kumar, G., Sampath, S., Jeena, V.S., Anjali, R., (2008), Carbon monoxide pollution levels at environmentally different sites, Journal of Indian Geophysical Union, 12(1), p31-40.
-
Novelli, P.C., Masarie, K.A., Lang, P.M., (1998), Distributions and recent changes of carbon monoxide in the lower troposphere, Journal of Geophysical Research, 103, p19015-19033.
[https://doi.org/10.1029/98jd01366]

-
Okada, Y., Mukai, S., Singh, R.P., (2004), Changes in atmospheric aerosol parameters after Gujarat earthquake of January 26, 2001, Advances in Space Research, 33, p268-273.
[https://doi.org/10.1016/s0273-1177(03)00474-5]

-
Reichle, H.G., Connors, V.S., Holland, J.A., Sherrill, R.T., Wallio, H.A., Casas, J.C., Condon, E.P., Gormsen, B.B., Seiler, W., (1990), The distribution of middle tropospheric carbon monoxide during early October 1984, Journal of Geophysical Research, 95, p9845-9856.
[https://doi.org/10.1029/jd095id07p09845]

-
Singh, R.P., Senthil Kumar, J., Jacques, Z., Menas, K., (2010a), Satellite detection of carbon monoxide emission prior to the Gujarat earthquake of 26 January 2001, Applied Geochemistry, 25(4), p580-585.
[https://doi.org/10.1016/j.apgeochem.2010.01.014]

- Singh, R.P., Mehdi, W., Sharma, M., (2010b), Complementary nature of surface and atmospheric parameters associated with Haiti earthquake of 12 January 2010, Natural Hazards and Earth System Science, 10, p1299-1305.
-
Tolton, B.T., Drummond, J.R., (1997), Characterization of the length modulated radiometer, Applied Optics, 36, p5409-5419.
[https://doi.org/10.1364/ao.36.005409]

-
Thompson, A.M., (1992), The oxidizing capacity of the Earth’s atmosphere: probable past and future, changes, Science, 256, p1157-1165.
[https://doi.org/10.1126/science.256.5060.1157]

- Tzanis, C., Varotsos, C., Viras, L., (2007), Impacts of the solar eclipse of 29 March 2006 on the surface ozone and nitrogen dioxide concentrations at Athens, Greece, Atmosperic Chemistry and Physics Discussions, 7, p14331-14349.
- U.S. Environmental Protection Agency (EPA), (1995), National air pollution emission trends, 1900-1994, Rep. EPA-454/R-95-011, Washington D.C.
