
Effects of Aerosol Hygroscopicity on Fine Particle Mass Concentration and Light Extinction Coefficient at Seoul and Gosan in Korea
Abstract
The sensitivity of aerosol light extinction coefficient to the aerosol chemical composition change is estimated by (1) calculating the aerosol water content and chemical concentrations by a gas/particle equilibrium model and (2) calculating the aerosol light extinction coefficient by a Mie theory based optical model. The major chemical species are total (gas and particle phase) sulfuric acid, total nitric acid, and total ammonia which are based on the measurement data at Seoul and Gosan. At Seoul, since there were enough ammonia to neutralize both total sulfuric acid and total nitric acid, the dry ionic concentration is most sensitive to the variation of the total nitric acid level, while the total mass concentration (ionic concentration plus water content) and thus, the aerosol light extinction coefficient are primarily determined by the total sulfuric acid. At Gosan, since the concentration of ambient sulfuric acid was the highest among the inorganic species, sulfate salts determined aerosol hygroscopicity. Thus, both ionic and total mass concentration, and resultant aerosol light extinction coefficient are primarily determined by the sulfuric acid level.
Keywords:
Aerosol water content, Relative humidity, Inorganic ion, Aerosol mass concentration, Light extinction coefficient1. INTRODUCTION
Hygroscopicity of aerosols is an important factor that determines aerosol water content. One of the aerosol properties that are closely related with aerosol water content is aerosol optical property, such as light extinction coefficient. Aerosol water content affects aerosol light extinction coefficient in two ways; (1) by changing aerosol size and (2) by changing aerosol chemical composition. In addition, aerosol water content directly affects aerosol mass concentration. Since aerosol mass concentration, especially, that of fine particles is closely related with various atmospheric environmental phenomena such as visibility reduction and lung disease, it is critical to understand hygroscopic properties of fine particles. It is known that inorganic ionic species in an aerosol and relative humidity (RH) are major factors that affect aerosol water content. But direct measurement of aerosol water content is difficult because sampling and analytical techniques are inappropriate. One way to circumvent it is to use a gas/particle equilibrium model to calculate aerosol water content.
Several research activities have been carried out to measure or estimate aerosol water content and relate it with various aerosol properties (Choi et al., 2005; Choi and Kim, 2004; Day and Malm, 2001; Malm and Day, 2001; Meng et al., 1995; Zhang and McMurry, 1993; McMurry and Stolzenburg, 1989; Winkler, 1973). For example, Meng et al. (1995) estimated aerosol water content and acidity based on the measurement data at Los Angeles. Choi and Kim (2004) tried to find major factors that affect the aerosol water content at Seoul and Gosan. Based on the aerosol water content calculation, Choi et al. (2005) estimated the sensitivity of aerosol mass concentration to the ambient ionic concentrations at Seoul.
In this work, sensitivity of aerosol chemical composition and mass concentration (including water content) to the ambient ionic concentrations was estimated by following the approach of Choi and Kim (2004), using a multi-component gas-aerosol equilibrium model, SCAPE2 (Simulating Composition of Atmospheric Particles at Equilibrium 2) for the measurement data at Seoul and Gosan, Korea. Then, aerosol size change was calculated from the aerosol mass concentration change. Finally, resultant aerosol optical property change was estimated by a Mie theory based model, ELSIE (Elastic Light Scattering Interactive Efficiency).
2. MODELS
To estimate water content of aerosol, a thermodynamic model, SCAPE2 is used. This model estimates the state and composition of atmospheric inorganic ionic species between the gas and particle phases in chemical equilibrium. The model assumes that chemical species in an aerosol is internally mixed, chemical composition of the given aerosol size is the same, and the chemical species in the aerosols are in chemical equilibrium with those in the gaseous phase (Kim et al., 1993a, b).
The input data for the SCAPE model consist of total (the sum of the gas and particle phase) concentrations of sulfate (denoted as total sulfuric acid), total nitric acid, total ammonia, and the ionic concentrations of sodium, chloride, calcium, magnesium, potassium, and carbonate, and temperature (T) and RH. Details on SCAPE2 are given by Kim et al. (1993a, b) and Meng et al. (1998). It has been widely used since (1) it includes most number of chemical species, eight ionic components and 19 solid species; (2) it is both computationally efficient and rigorous; and (3) it has been used to estimate aerosols properties, such as water content and strong acidity (Meng et al., 1995).
In ELSIE, the light extinction coefficients of size segregate aerosols are estimated based on the Mie theory. Aerosol size change is estimated from the aerosol water content increase of the aerosols with the given aerosol chemical composition. It can be estimated by using either an experimentally determined growth factor or a chemical equilibrium model. In this work, the aerosol water content calculation result by SCAPE2 is used. In the original ELSIE, two aerosol size modes, fine and coarse mode, were considered. However, in the measurement data used in this work, only fine particles were collected and analyzed. Thus, following the measurements, only fine particle mode is estimated with the log-normal distribution assumption (geometric mean diameter of 0.6 μm and the geometric standard deviation of 1.5).
The input data for the ELSIE model consist of aerosol mass concentration, concentrations of sulfate, nitrate, OC (organic carbon), EC (elemental carbon), and T and RH. It is assumed that the OC and EC concentrations are constant and does not change with the changes of the ambient conditions nor affect the aerosol properties. The used OC and EC concentrations are the average values from Seoul, 13.9 and 5.74 μg m-3, respectively. Light absorption coefficient is mostly determined by the EC concentration. Since the constant concentration values for OC and EC are used, the sensitivity of the light extinction coefficient is based on the variation of the light scattering coefficient. The concentrations of ionic species are obtained from SCAPE2. The densities and refractive indices for each chemical species are from Sloane (1984) and the representative light frequency of 0.58 μm is used in which the human eyes recognize the object most well (Tang, 1996). Details on ELSIE are given by Sloane (1984, 1986).
If one assumes the total aerosol number concentration be constant which is a reasonable assumption in this case since we have measured ambient aerosols with the 24-h interval, the aerosol size (diameter) change could be related with the aerosol mass concentration change with the following relationship:
| (1) |
When calculating the sensitivity, the concentrations of total sulfuric acid, total nitric acid, and total ammonia are changed from a half of the measured concentration to double of the measured one (50-200%).
3. MEASUREMENT DATA
Aerosol measurement data used in this study are obtained from Kang (2003) for Seoul and from Korea Institute of Science and Technology for Gosan. At Seoul, the measurement was carried out at Konkuk University. Gosan is located at the western tip of Jeju Island which is about 100 km from Korean Peninsula. Gosan is a background area in Korea and several routine and intensive measurements have been carried out. At both sites, PM2.5 cut size cyclones were used collect fine particles. Kang (2003) applied denuder and 3-stage filter-pack system to quantify evaporation errors in addition to collect gaseous and particulate matters. A 3-stage filter-pack was applied at Gosan to collect gaseous and particulate matters.
Both are 24-h sampling data. Sampling periods are between April 2001 and February 2002 for Seoul and between 1994 and 2002 for Gosan, respectively. The numbers of the sampling data are 60 for Seoul and 163 for Gosan, respectively. Details of the sampling and analysis for Seoul data are given by Kang (2003) and for Gosan data given by Lee et al. (2001). Meteorological data, T and RH, are obtained from the surface weather stations near to the sampling sites operated by the Korea Meteorological Administration.
To ensure the quality of the data, we apply the quality assurance/quality control (QA/QC) procedure to the measured data. In addition to the instrument check, ion balance is used to check the validity of the data. The data with the ratio of the sum of the cation concentrations to the anion concentrations being within 30% are used for further data analysis. The criterion of 30% is chosen since the concentrations of organic and carbonates could be up to 30% of the total ion concentrations (Park et al., 2004). After this process, 48 data are remained at Seoul and 151 data are remained at Gosan, respectively.
4. RESULTS
4. 1 General Characteristics
Table 1 shows the average measured aerosol concentrations at Seoul and Gosan, respectively, along with the meteorological conditions. SCAPE2 is based on the assumption that the chemical species are in thermodynamic equilibrium between the gas and particle phases and between the aqueous and solid phases in aerosol. By comparing the calculated particulate concentration with those measured, the assumption was validated in Choi and Kim (2004). Fig. 1 in Choi and Kim (2004) showed that most samples at Gosan were in equilibrium while at Seoul the estimate ammonium concentrations were generally higher than the measured ones. There are two probable reasons for the overestimation of the ammonium concentration; measurement error and/or non-equilibrium state. At present it is not clear which one caused it.

Summary of the ambient relative humidity (RH), temperature (T), and ionic species concentrations (μg m-3) at Seoul and Gosan.
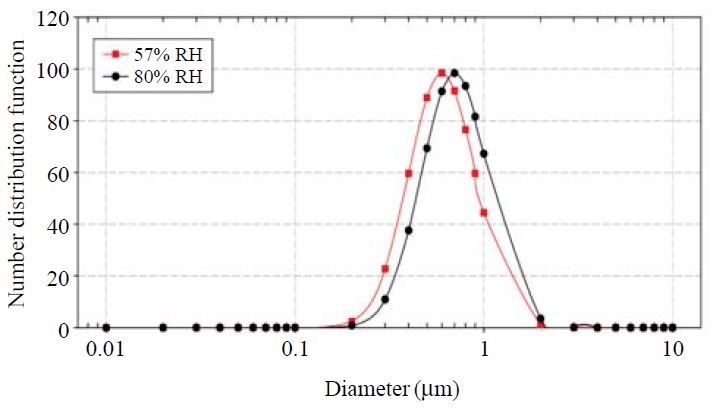
Change of aerosol size distribution with RH (solid square line: aerosol size distribution at 57% RH, solid circle line: aerosol size distribution at 80% RH) at Seoul.
Table 2 shows the calculated aerosol ionic concentration and water content. Though the ionic concentrations at Seoul were higher than Gosan, due to lower RH, the calculated aerosol water content at Seoul is lower than Gosan.
4. 2 Sensitivity of the Aerosol Composition and Size to the Total Ionic Concentrations and RH
The calculated water content per aerosol mass concentration shown in Table 2 is based on the seasonal mean RH values. Aerosol water content with varying RH could be calculated by fixing the aerosol chemical composition (seasonal mean values) and then varying the ambient RH which was shown in detail by Choi and Kim (2004). One particular case is that the calculation of aerosol water content for the ambient average RH (57%) at Seoul and for the RH value of 80% in which most aerosol components would be in solution state. It is found that by changing the RH from 57% to 80% for the average chemical composition data at Seoul, the diameter increases by 17% as shown in Fig. 1. For this calculation, we assume the same aerosol size distribution as in the optical property calculation, namely, the log-normal size with the geometric mean diameter of 0.6 μm and the geometric standard deviation of 1.5. The overall size range is not changed much and both size ranges are in the same optical efficiency range.
The sensitivity of aerosol mass concentrations (both not including and including aerosol water content) on the changes of the concentrations of each chemical species are calculated for the changes of total sulfuric acid, total nitric acid, and total ammonia from 50%, 100% (based case), 150%, and 200% of the average measurement values. Figs. 2 and 3 show the seasonal sensitivities for Seoul and Gosan, respectively. At Seoul, the aerosol dry mass concentrations are most sensitive to the total nitric acid change except summer. However, the total aerosol mass concentrations (including dry aerosol mass concentration and aerosol water content) are most sensitive to total sulfuric acid concentration irrespective of season. It is because the aerosol water content per unit mass of each chemical species is the largest for sulfate salts (Kim and Seinfeld, 1995; Kim et al., 1993a, b). On the contrary, at Gosan, total aerosol mass concentrations (both dry and total) were most sensitive to the change of total sulfuric acid since, at Gosan, the concentration of total nitric acid was very low as shown in Tables 1 and 2.
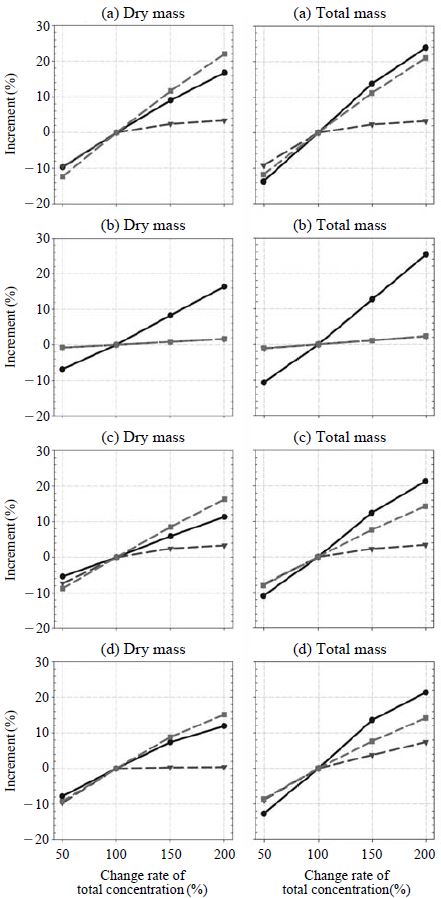
Sensitivity of aerosol dry mass concentration and total mass concentration with ambient total ionic concentration changes at (a) spring, (b) summer, (c) fall, and (d) winter (solid circle line: total sulfuric acid change, dotted triangle line: total ammonia change, dotted square line: total nitric acid change) at Seoul.
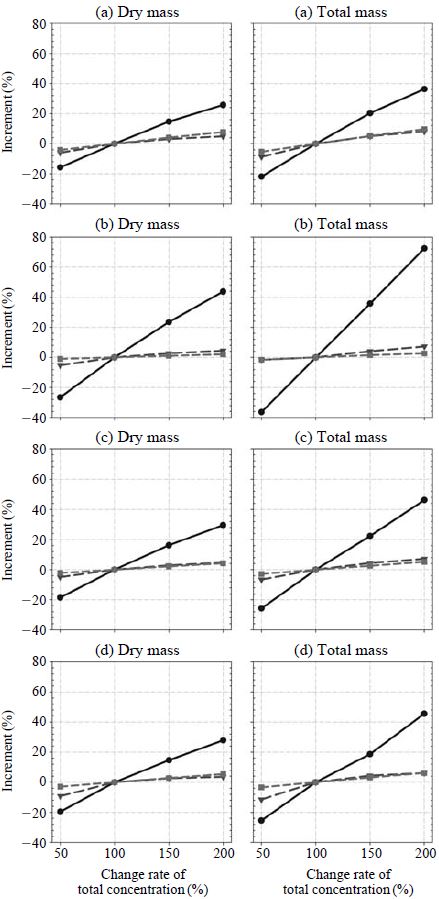
Sensitivity of aerosol dry mass concentration and total mass concentration with ambient total ionic concentration changes at (a) spring, (b) summer, (c) fall, and (d) winter (solid circle line: total sulfuric acid change, dotted triangle line: total ammonia change, dotted square line: total nitric acid change) at Gosan.
4. 3 Sensitivity of the Aerosol Light Extinction Coefficient to the Total Ionic Concentrations
Since it is likely that in the real ambient condition, the concentrations of several chemical species be changed simultaneously, we have carried out the sensitivity study of the aerosol light extinction coefficient when the concentrations of two chemical species change simultaneously. This kind of calculation is essential since each chemical species might affect the concentration of other chemical species in the particle phase. We have changed the pair of (1) total sulfuric acid-total ammonia, (2) total ammonia-total nitric acid, and (3) total sulfuric acid-total nitric acid.
Figs. 4 and 5 show the contour plots (isopleths) of the percent changes of the aerosol light extinction coefficients due to aerosol composition changes of two chemical species. At Seoul, for the case of total sulfuric acid-total ammonia change, the light extinction coefficient is sensitive to total sulfuric acid change when there is sufficient ammonia. If the total ammonia concentration is low, the light extinction coefficient is strongly dependent on the concentration change of total ammonia. This is because excess total ammonia does not go to the particle phase and stays in the gas phase and, thus, does not affect the aerosol concentration. However, if there is insufficient total ammonia in the system, decrease of total ammonia directly removes the aerosol concentration of ammonium sulfate.
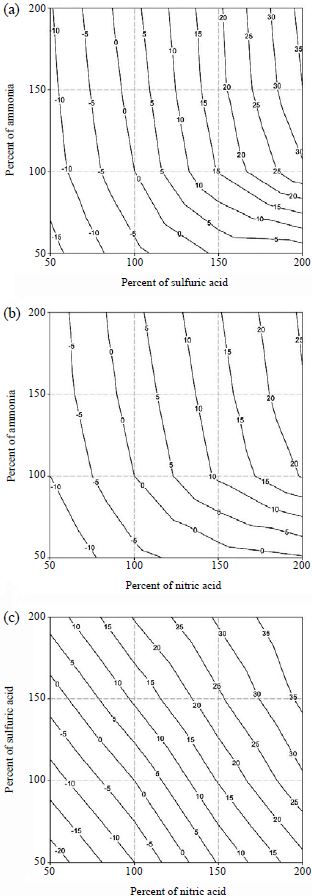
Sensitivity of aerosol light extinction coefficient with ionic concentration changes of (a) total sulfuric acid-total ammonia, (b) total nitric acid-total ammonia, and (c) total sulfuric acid-total nitric acid at Seoul (unit: %).
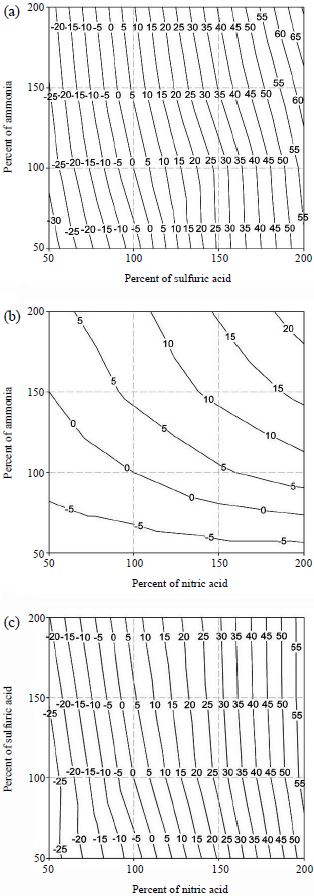
Sensitivity of aerosol light extinction coefficient with ionic concentration changes of (a) total sulfuric acid-total ammonia, (b) total nitric acid-total ammonia, and (c) total sulfuric acid-total nitric acid at Gosan (unit: %).
The system of total nitric acid-total ammonia shows similar behavior to the total sulfuric acid-total ammonia system. For the system of total sulfuric acid-total nitric acid, since the aerosol water contents of sulfate salts are higher than nitrate salts (Kim et al., 1993a, b) the sensitivity of the aerosol light extinction coefficient to total sulfuric acid is higher than total nitric acid.
At Gosan, since sulfuric acid is the dominant species with very low total nitric acid concentration, the light extinction coefficient is sensitive to total sulfuric acid (in total sulfuric acid-total ammonia system) or total nitric acid (in total sulfuric acid-total nitric acid system). The former case occurs since the change of total sulfuric acid directly affects the total sulfate level. The latter case is caused since total nitric acid is the limiting species.
5. CONCLUSIONS
In this work, aerosol water content is estimated by a gas/particle equilibrium model based on the measurement data at Seoul, the capital of Korea and Gosan, a background area in Korea. In addition, the sensitivity of aerosol composition to the change of ambient ionic species’ concentration is calculated. At Seoul, since there are enough ammonia to neutralize both total sulfuric acid and nitric acid, the dry ionic concentration is most sensitive to the variation of the total nitric acid level, while the total mass concentration (ionic concentration plus water content) are most sensitive to the variation of total sulfuric acid. At Gosan, the concentration of ambient sulfuric acid is the highest among the inorganic species, sulfate salts determines aerosol hygroscopicity. Thus, both dry ionic concentration and total mass concentration are most sensitive to the variation of sulfuric acid level.
The sensitivity of aerosol light extinction coefficient to the aerosol chemical composition change is also estimated by a Mie theory based optical model with varying ambient concentrations of major chemical species, sulfuric acid, nitric acid, and ammonia. At both Seoul and Gosan, the aerosol light extinction coefficients are primarily determined by the total sulfuric acid level.
Acknowledgments
This paper was supported by the National Research Foundation of Korea (NRF) grant funded by the Korea government (MEST) (No. 2009-0066341 and No. 2009-0093459).
References
- Choi, E.K., Kim, Y.P., (2004), Major factors affecting PM2.5 water content in Seoul and Gosan (in Korean), Journal of Korean Society Atmospheric Environment, 20, p803-810.
- Choi, E.K., Sul, K., Oh, S.O., Kim, Y.P., (2005), Sensitivity of particle mass concentration to the ambient ionic concentration changes in Seoul (in Korean), Seoul Studies, 6, p59-69.
-
Day, D.E., Malm, W.C., (2001), Aerosol light scattering measurements as a function of relative humidity: a comparison between measurements made at three different sites, Atmospheric Environment, 35, p5169-5176.
[https://doi.org/10.1016/s1352-2310(01)00320-x]

- Kang, C.M., (2003), Characteristics of the fine particles and source apportionments using the CMB model in Seoul area, Ph.D. Thesis, Konkuk University, Seoul.
- Kim, Y.P., Seinfeld, J.H., Saxena, P., (1993a), Atmospheric gas-aerosol equilibrium I. Thermodynamic model, Aerosol Science Technology, 19, p157-181.
- Kim, Y.P., Seinfeld, J.H., Saxena, P., (1993b), Atmospheric gas-aerosol equilibrium II. Analysis of common approximations and activity coefficient calculation methods, Aerosol Science Technology, 19, p182-198.
- Kim, Y.P., Seinfeld, J.H., (1995), Atmospheric gas-aerosol equilibrium III, Thermodynamics of crustal elements Ca2+, K+, Mg2+, Aerosol Science Technology, 22, p93-110.
-
Lee, J.H., Kim, Y.P., Moon, K.C., Kim, H.K., Lee, C.B., (2001), Fine particle measurements at two background sites in Korea between 1996 and 1997, Atmospheric Environment, 35, p635-643.
[https://doi.org/10.1016/s1352-2310(00)00378-2]

-
Malm, W.C., Day, D.E., (2001), Estimates of aerosol species scattering characteristics as a function of relative humidity, Atmospheric Environment, 35, p2845-2860.
[https://doi.org/10.1016/s1352-2310(01)00077-2]

-
McMurry, P.H., Stolzenburg, M.R., (1989), On the sensitivity of particle size to relative humidity for Los Angeles aerosols, Atmospheric Environment, 23, p497-507.
[https://doi.org/10.1016/0004-6981(89)90593-3]

-
Meng, Z., Seinfeld, J.H., Saxena, P., Kim, Y.P., (1995), Contribution of water to particulate mass in the south coast air basin, Aerosol Science Technology, 22, p111-123.
[https://doi.org/10.1080/02786829408959731]

-
Meng, Z., Dabdub, D., Seinfeld, J.H., (1998), Size-resolved and chemically resolved model of atmospheric aerosol dynamics, Journal of Geophysical Research, 103, p3419-3435.
[https://doi.org/10.1029/97jd02796]

-
Park, M.H., Kim, Y.P., Kang, C.H., (2004), Aerosol composition change due to dust storm: measurements between 1992 and 1999 at Gosan, Korea, Journal of Geophysical Research, 109(D19S13).
[https://doi.org/10.1029/2003JD004110]

-
Sloane, C.S., (1984), Optical properties of aerosols of mixed composition, Atmospheric Environment, 18, p871-878.
[https://doi.org/10.1016/0004-6981(84)90273-7]

-
Sloane, C.S., (1986), Effects of composition on aerosol light scattering efficiencies, Atmospheric Environment, 20, p1025-1037.
[https://doi.org/10.1016/0004-6981(86)90288-x]

-
Tang, I.N., (1996), Chemical and size effects of hygroscopic aerosols on light scattering coefficients, Journal of Geophysical Research, 101, p19245-19250.
[https://doi.org/10.1029/96jd03003]

-
Winkler, P., (1973), The growth of atmospheric aerosol particles as a function of the relative humidity II. An improved concept of mixed nuclei, Aerosol Science, 4, p373-387.
[https://doi.org/10.1016/0021-8502(73)90027-x]

-
Zhang, X.Q., McMurry, P.H., (1993), Mixing characteristics and water content of submicron aerosols measured in Los Angeles and at the Grand Canyon, Atmospheric Environment, 27A, p1593-1607.
[https://doi.org/10.1016/0960-1686(93)90159-v]
