Association of Traffic-Related Air Pollution (TRAP) with DNA Damage and Respiratory Health Symptoms among Primary School Children in Selangor
Copyright © 2019 by Asian Journal of Atmospheric Environment
This is an open-access article distributed under the terms of the Creative Commons Attribution Non-Commercial License (http://creativecommons.org/licenses/by-nc/4.0/), which permits unrestricted non-commercial use, distribution, and reproduction in any medium, provided the original work is properly cited.
Abstract
Exposure to Traffic-Related Air Pollution (TRAP) is a public health concern accountable for several health problems each year in Malaysia. Several studies globally have shown that children in schools near high traffic roads have increased risks for Deoxyribonucleic Acid (DNA) damage due to higher exposure to TRAP. The study aimed to determine the association between TRAP exposure with DNA damage and respiratory symptoms among school children in Selangor state. PM2.5, PM10, Ultrafine Particle (UFP), Carbon Monoxide (CO), Carbon Dioxide (CO2), Nitrogen Dioxide (NO2) and Sulphur Dioxide (SO2) were measured as TRAP. A cross-sectional comparative study was carried out among children in Kajang as exposed group (n=52) and Hulu Langat as comparative group (n=52). A set of standardized and validated questionnaires were used to determine respiratory symptoms and history of exposure. Measurements of indoor and outdoor air pollutants were conducted in schools. Buccal mucosa cells were collected, which then followed by investigation of DNA damage using a comet assay. All pollutants were significantly associated with reported cough and wheezing at p<0.05. Meanwhile, PM2.5, PM10 and UFP were significantly associated with comet tail length at p<0.05. Additionally, comet tail length in the exposed group was significantly higher (35.95±7.93 μm) than those in the comparative group (30.32±8.358 μm), and the difference was significantly different (t=3.450, p=0.001). Children were more likely to have genotoxicity of buccal mucosa if they were exposed to higher levels of ultrafine particles (UFP). This study demonstrated that children in schools near heavy traffic roads have an increased risk for respiratory symptoms and DNA damage due to higher exposure to TRAP. Therefore, this study supports its importance as a risk factor in associations documented between TRAP and respiratory health among children.
Keywords:
Air pollution, DNA damage, Respiratory symptoms, School children, Comet assay1. INTRODUCTION
Traffic-Related Air Pollution (TRAP) is a worldwide issue as airborne pollutant can be found across the globe from developed, developing and underdeveloped countries. In 2013, the International Agency for Research on Cancer (IARC) classified air pollution and particulate matter as carcinogenic to human (Whyand et al., 2018). Many epidemiological studies have demonstrated potential respiratory health outcomes that arise from the inhalation of TRAP especially among children. In a study by Choo and Jalaludin (2015), they found that children living in households or studying in schools in urban areas were more likely to suffer from respiratory illnesses compared with children living in homes or studying in schools in rural areas. Short term TRAP exposure increases respiratory symptoms such as cough, chest tightness, wheezing and phlegm especially for those who living within 100 m from the heavy traffic area. Meanwhile, the chronic exposure to a complex mixture of toxic air pollutants also may induce genotoxic damage such as oxidative damage and formation of DNA adducts (Muhamad Daud et al., 2018).
DNA damage due to pollutants in an environment that occurred during childhood can elevate the risk of the initiation of cancer development in adulthood (Muhamad Daud et al., 2018; Carpenter and Bushkin-Bedient, 2013). Particulate matter interacts with biological systems through direct generation of reactive oxygen species (ROS) and further contributes to the oxidative stress (Risom et al., 2005). Oxidative stress is an imbalance between free radical production and antioxidant capacity resulting to DNA damage (Scandalious, 2002). Besides that, UFP has high alveolar deposition fraction, large surface area, and is able to enter into the circulation and induce inflammation. On the other hand, the synergistic effect between SO2 and NO2 in the atmosphere play an important role on the health effects as well. The ROS production within the lungs in response to SO2 and NO2 exposure can induce airway inflammation and activate oxidant pathways (Reno et al., 2015; Lodovici and Bigagli, 2011). The health impact associated with exposure to genotoxic air pollutants can be assessed through the assessment of DNA damage which could serve as biomarkers of early effects of exposure (Tuntawiroon et al., 2007).
Previous study in Bangkok, Thailand found a higher levels of DNA damage in children who attended schools within 500 m of a high traffic road compared with children who went to a rural school (Ruchirawat et al., 2007; Tuntawiroon et al., 2007). Besides that, many studies have assessed the genotoxic effects on the TRAP exposure in the common population and in highly exposed population (Domingues et al., 2018; Mohamad Fandi et al., 2018; Ceretti et al., 2014; Kavitha et al., 2011). Neri et al. (2006) has highlighted on the insufficient data with regards to the obtainable biomarkers of children outcome to the TRAP exposure: only few studies have shown a higher level of biomarkers of DNA damage in children that are exposed to high level of TRAP compared children that are less exposed. Thus, this study aimed to determine the association between TRAP (PM2.5, PM10, UFP, CO, CO2, NO2, SO2) exposure with DNA damage in buccal mucosa cells and respiratory health symptoms among primary school children attending schools near busy and less busy roads. This study also assessed the sources of indoor air pollutants in houses because children’s exposure also occurred inside the houses, aside from transfer of ambient pollutants indoors.
2. METHODS
This cross-sectional comparative study was carried out among primary school children in Kajang, Selangor as exposed group (n=52) and Hulu Langat, Selangor as comparative group (n=52) from February to March 2018. Exposed group was those primary school children attending schools near the busy roads and comparative group was those primary school children attending school near the less busy roads. The two study groups were identified based on the distance of school from the main road and Level of Severity (LOS). The selected schools in Kajang, Selangor were located near busy roads, while the selected schools in Hulu Langat, Selangor were located near less busy roads. LOS was used to categorise the traffic volume on the road captured by the traffic census station based on Road Traffic Volume Report Malaysia (RTVM, 2016). According to RTVM (2016), heavy traffic area can be defined based on LOS. It starts with LOS A, which means no congestion, free flow with low traffic volumes and high speeds and the list goes up to LOS B, LOS C, LOS D, LOS E, and LOS F. LOS F is when there is extreme congestion with stopand-go traffic and forced flow. The traffic volume on the road in Kajang was categorised as LOS F, whereas the traffic volume on the road in Hulu Langat was categorised as LOS A. Fig. 1 shows the location of sampling point in Kajang and Hulu Langat (Fig. 1).
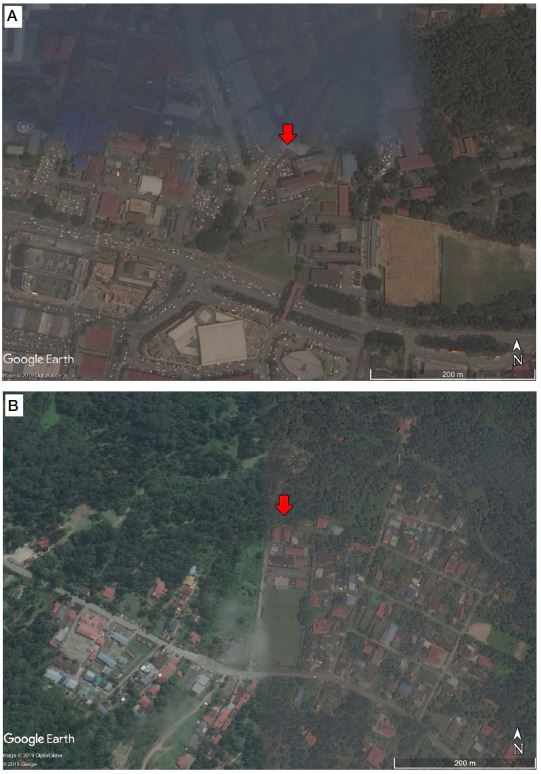
(A) Red pointing arrow in the map shows the location of school in Kajang, Selangor. (B) Red pointing arrow in the map shows the location of school in Hulu Langat, Selangor (Source: Images generated by Google Earth, 2019).
2. 1 Ethical Approval
The study was approved by Ministry of Education Malaysia and reviewed by Ethics Committee for Research Involving Human Subjects Universiti Putra Malaysia (reference no: JKEUPM-2017-192) before conducting the study.
2. 2 Questionnaire
This study used standardized questionnaires adapted from American Thoracic Society child questionnaire ATS-DLD-78-C, and International Study of Asthma and Allergies (ISAAC) questionnaire. The adapted questionnaires were translated to local Malay language (the national language in Malaysia). The questionnaires were distributed to children’s parents or guardians along with the consent letter, and they were collected a week later.
2. 3 Measurement of TRAP
TRAP parameters measured were PM2.5, PM10, UFP, CO, CO2, NO2, and SO2. Measurement of UFP was conducted using the P-Trak® Ultrafine Particle Counter 8525. Measurements of PM2.5 and PM10 were conducted using the DustTrakTM DRX Aerosol Monitor 8534. Measurement of CO was conducted using Q-Trak Monitor 7565. Measurements of NO2 and SO2 were conducted using the LaMotte Portable Air Sampling Pump. All sampling instruments were calibrated by the manufacturers and checked before operating to maintain its sensitivity and to prevent the error from occurring during measurement. Zero calibration was conducted to prevent zero error during operating the equipment. The operational procedure of the devices was based on the manual downloaded in the internet for each equipment used. The indoor and outdoor air sampling were executed simultaneously. The data were logged at 1-min interval for each measurement period. The measurement time was during school hours from Monday to Friday, specifically 6 hours during the start and end time of classes from 7.20 a.m. to 1.20 p.m. For indoor air sampling, the instruments were placed at a height of 0.6 to 1.5 meter above the floor, to simulate the location of breathing zo ne and was not closer than 1 meter to a door, window and wall. All instruments were placed at the back of the classroom to ensure no sound disruption from equipment during learning sessions and to avoid the children from being distracted by them. For outdoor air sampling, the instruments were placed at a height of 0.6 to 1.5 meter above the floor at the guard house.
2. 4 Exfoliated Buccal Mucosa Cells and Comet Assay
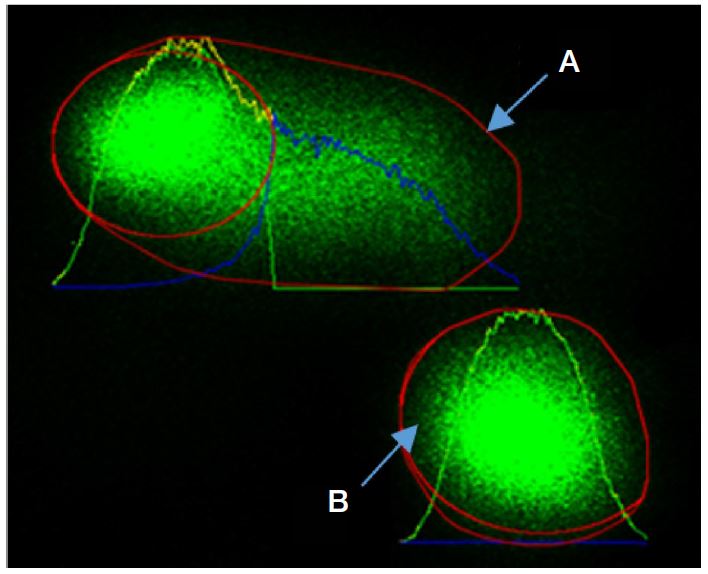
The children were asked to rinse their mouths 3 times with mineral water provided. The inside of right cheek was gently scrapped 10 times using a cytology brush. The cytology brush was dipped into 1.5 mL microcentrifuge tubes containing 0.1 M Phosphate Buffer Saline solution (PBS) with pH of 7.5. The procedures were repeated for the left cheek tissue surface using the other cytology brush. The samples were stored in a cool box and subsequently transported to a freezer in a laboratory for storage (-20°C). Comet assay determined the extent of DNA damage in the cells, which was performed by using the Trivigen Comet AssayTM kit protocol. Slides were examined using the fluorescence microscope under 200X magnification. Images of cells were analysed by using commercially available OpenComet software, which was an open-source software tool providing automated analysis of comet assay images. Before analyses were done, the captured images were first viewed in full spectrum. This was where the comet images were transformed in a way that the tail and the head can easily be distinguished. Tail lengths of the comet were determined, from the center of the head towards the last visible signs at the end of the tail as shown in Fig. 2 (Fig. 2).
2. 5 Statistical Analysis
All data were analyzed using Statistical Package for Social Science (SPSS) Version 21.0. There were three steps of analyzing data, namely univariate, bivariate and multivariate. Univariate analysis is a descriptive analysis where the mean, mode, median and standard deviation was used to illustrate the background of the respondents. Next, bivariate analysis was used to test the difference and association between studied variables. The tests involved during bivariate analysis were Independent-Samples T test, Mann-Whitney U test and Chi-square test. As for multivariate analysis, the multiple logistic regression test was performed to identify the main factors that influence the DNA damage of the respondents. The dependent variable was comet tail length, which was divided into length of ≥32.78 μm or <32.78 μm. Noting that the observed values of DNA damage for each subject show a skewed distribution, median values of DNA damage were selected to represent the amount of DNA damage. Tail length is the distance of DNA migration from the body of the nuclear core and it is used to evaluate the extent of DNA damage.
3. RESULTS AND DISCUSSION
3. 1 Socio-Demographic Status and TRAP Exposure History of Children
Table 1 shows TRAP exposure history of children. A total number of 104 primary school children aged 10 and 11 years old, consisted of both genders were included from two schools in Kajang as exposed group and from two schools in Hulu Langat as comparative group (Table 1).
In this study, 50 children in exposed group (96.2%) lived in urban area, while 52 children in comparative group (100%) lived in rural area. All children in exposed group lived within exposed vicinity. Therefore, the school children in exposed group were more likely to experience respiratory health symptoms compared to the primary school children in comparative group.
Besides that, the comparison between the distance of children’ houses from the main road between exposed and comparative group also showed a high significant difference (χ2=70.19, p<0.001). Most of the children in exposed group (82.7%) resided less than 500 m from the main road, whereas most of the primary school children in comparative group (76.9%) resided more than 1000 m from the main road. Many studies found that a shorter distance from the residence to the nearest main road, especially within a 75-m home area, was significantly related to an increased prevalence of respiratory health symptoms (McConnell et al., 2006; Morgenstern et al., 2008).
3. 2 Comparison of the TRAP Concentration in Exposed and Comparative School
Table 2 shows the comparison of TRAP concentration in schools between study groups (Table 2). Overall, the concentration of air pollutants in the classrooms of the exposed group were significantly higher compared to comparative group’s concentration. The trend of land use in Kajang, which is located in Klang Valley, has changed over the years. The building of many new housing developments, flyovers, and underpasses in Kajang contribute to high traffic intensity in the area. Many people are relocating to Kajang to take advantage of its strategic location to several major places in Malaysia such as Putrajaya and Kuala Lumpur International Airport. Meanwhile, Hulu Langat is popular with its natural surroundings with spots for several agricultural and recreational activities. The statistical test showed that the comparison of the air pollutants between exposed and comparative group were significantly different for PM2.5 (z=-2.309, p=0.021), PM10 (z=-2.323, p=0.020), UFP (z=-2.309, p=0.021), NO2 (z=-2.530, p=0.011) and SO2 (z=-2.530, p=0.013).
Similarly, the statistical test showed that the comparison of the pollutants between exposed and comparative group were significantly different for PM2.5 (z=-2.323, p=0.020), PM10 (z=-2.323, p=0.020), UFP (z=-2.309, p=0.021), NO2 (z=-2.477, p=0.013) and SO2 (z=-2.477, p=0.013).
Indoor PM10 in exposed group was higher at 83.0 μg/m3 compared to comparative group with 24.5 μg/m3. Yang Razali et al. (2015) showed that the concentrations PM2.5 and PM10 measured in schools at semi urban areas during school hours were 18 μg/m3 and 31 μg/m3 respectively. These were in contrast with the findings presented in this study where the concentration of PM2.5 and PM10 were higher compared to the previous study. Indoor UFP in exposed group was higher compared to comparative group’s concentration with 4344.5 pt/cm3 and 1927.5 pt/cm3 respectively. Indoor CO2 in exposed group was 363.5 ppm, while indoor CO2 in comparative group was 209.5 ppm. This indicates that the ventilation inside the classrooms for both study groups could be considered as good ventilation since CO2 levels inside the classrooms were below 1000 ppm as recommended by Department of Occupational Safety and Health (DOSH) guideline (Department of Occupational Safety and Health, 2010). Moreover, indoor concentration of NO2 and SO2 in exposed group was 0.04 and 0.07 ppm respectively. There was no concentration recorded for indoor NO2 and SO2 in comparative group. This showed that the primary school children in comparative group were either not exposed to indoor NO2 and SO2 or their exposure were below detection limit.
3. 3 Comparison of DNA Damage in Buccal Mucosa Cells
The comparison between the comet tail length in both exposed and comparative group is shown in Table 3 (Table 3). Statistical analysis showed that the mean comet tail length in exposed group was significantly higher (35.95±7.93 μm) compared to comparative group’s (30.32±8.358 μm). T-test analysis found a significant difference between comet the tail length in both study groups (t=3.450, p=0.001).
One of the measures of DNA damage that had been shown to be particularly good indicators of the underlying damage was comet tail length (Kumaravel and Jha, 2006). The comet parameter of tail length was defined as length of the tail in μm (Gyori et al., 2014). The total respondents were 100 with the division of 50 respondents from exposed group and another 50 respondents from comparative group. There were 2 missing data from each group because the children dropped out from the study along the way. The mean of comet tail length for exposed group was 35.95 μm, which was significantly higher than the mean from comparative group with 30.32 μm. In accordance with the present results, a previous study by Tuntawiroon et al. (2006) had demonstrated that primary school children who went to schools near high traffic density had greater DNA damage than the primary school children who went to schools in rural area, as reflected by a longer tail length.
3. 4 Reported Respiratory Health Symptoms
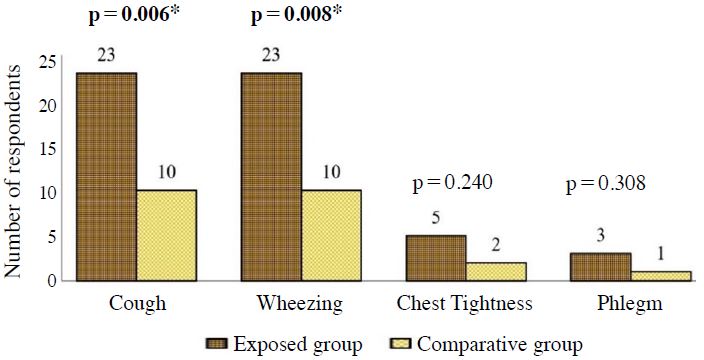
Respiratory health symptoms of those children could be resulted from exposure to TRAP. Previous studies have shown higher rates of respiratory health symptoms among people working, studying and living close to busy roads (Arifuddin et al., 2019; Mohamad Fandi et al., 2018). There were four parameters of respiratory health symptoms that had been studied which included cough, phlegm, chest tightness and wheezing. As shown in Fig. 3, 23 children (44.2%) from the exposed group and 10 children (19.2%) from comparative group had cough (Fig. 3). Besides, about 20 children (38.5%) from exposed group and 8 children (15.4%) from comparative group had wheezing. Chest tightness was not common among school children with only 5 children (9.6%) from exposed group and 2 (3.8%) from comparative group reported the symptom. In addition, only 3 children (5.8%) in exposed group and 1 child (1.9%) in comparative group experienced phlegm.
Statistical analysis from Chi-square proved a significant difference on the reported cough (χ2=7.50, p=0.006). Therefore, the primary school children in exposed group were more likely to get cough as compared to those primary school children in comparative group. This finding was consistent with the study conducted by Gehring et al. (2002) who stated that there was some indication of an association between TRAP and cough. As for the reported wheezing, Chi-square showed a significantly different result (χ2=7.04, p=0.008,). Thus, the primary school children in exposed group were more likely to get wheezing as compared to those primary school children in comparative group. A study conducted in Sweden found that persistent wheezing was associated similarly with exposure to traffic-PM10 and traffic-NOx (Nordling et al., 2008).
3. 5 Association of TRAP Concentration and DNA Damage
DNA damage of buccal mucosa cells play a role as a biomarker of exposure to PM because there is evidence that exposure to PM causes oxidative stress and genotoxicity (Muhamad Daud et al., 2018). Table 4 shows the association of TRAP concentration and DNA damage among children from exposed and comparative group (Table 4). Presence of DNA damage was identified as tail length ≥32.78 μm, while unlikely presence of DNA damage was identified as tail length<32.78 μm. TRAP in this study were divided into high and low categories based on their median. Values lower than median were determined to be low concentration of TRAP, while median and values higher were determined to be high concentration of TRAP. The median of PM2.5, PM10, UFP, CO2, NO2 and SO2 were 48.50 μg/m3, 56.88 μg/m3, 2866.50 pt/cm3, 299.07 ppm, 0.07 ppm, and 0.10 ppm respectively.

Association of TRAP concentration and DNA damage among respondents from exposed and comparative group.
There were significant associations between PM2.5 (p=0.014), PM10 (p=0.025) and UFP (p=0.001) with comet tail length among study groups. However, there was no association found between CO2, NO2 and SO2 with comet tail length in both study groups. These results were in line with those of previous studies that a significant association was found between high levels of urban pollution and DNA damage detected by the comet assay assessed from strand breaks in human blood samples (Huang et al., 2012). The results of this study indicate that there was a significant association between PM2.5, PM10 and UFP with the comet tail length within both study groups.
3. 6 Association of TRAP Concentration and Respiratory Health Symptoms
The associations between TRAP concentration and respiratory health symptoms among children are shown in Figs. 4 to 6 (Figs. 4-6). There were significant associations between PM2.5 with cough and wheezing. Besides that, there were significant associations between PM10 with cough and wheezing. Significant associations were also found between UFP with cough and wheezing. On the other hand, there were no significant association between NO2 and SO2 with respiratory health symptoms.
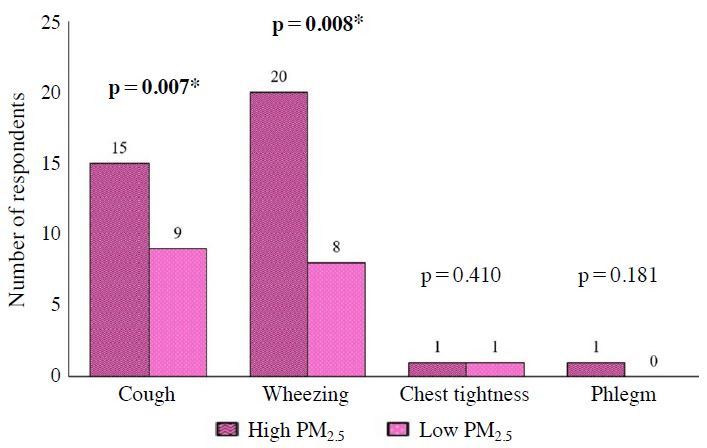
Association between concentration of PM2.5 and reported respiratory health symptoms among children. N=104, Chi-square test, *Significant at p<0.05.
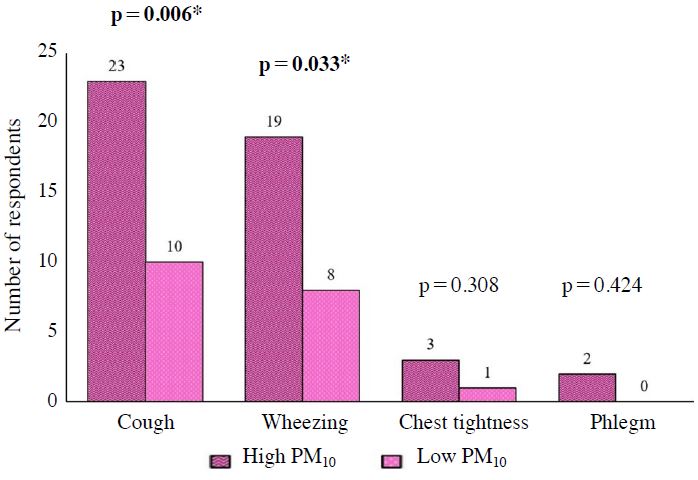
Association between concentration of PM10 and reported respiratory health symptoms among children. N=104, Chi-square test, *Significant at p<0.05.
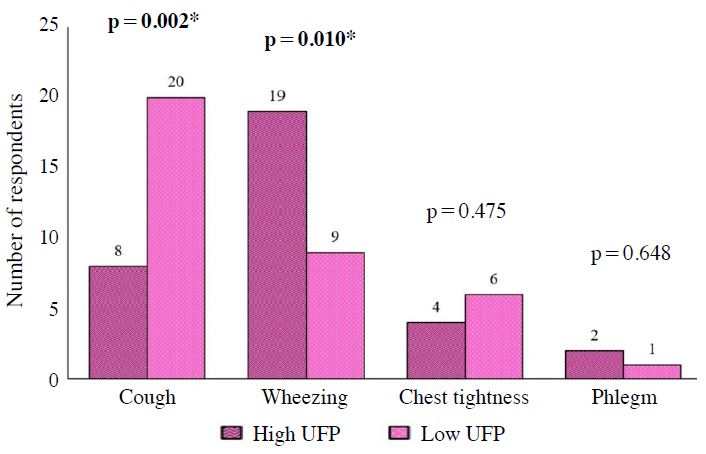
Association between concentration of UFP and reported respiratory health symptoms among children. N=104, Chi-square test, *Significant at p<0.05.
Children who were exposed to PM2.5 and UFP have increased risk of suffering cough with insignificant CI. The study by Kim et al. (2014) suggested that PM2.5 was mostly responsible for cough and wheezing prevalent in children. These results also reflect those of Rawi et al. (2015) who found significant associations between wheezing with PM2.5 and PM10 concentrations in preschools.
3. 7 Factors that Influenced Comet Tail Length among Children after Controlling All the Confounders
Table 5 shows the findings from multiple logistic regression that was carried out to determine the factors that influenced comet tail length among children after controlling all the confounders (Table 5). Such confounders were housing area, distance of house from main road, open burning, source of indoor pollutants in houses (indoor smoking, types of building material, change of floor in house, paint of interior part in house, open windows during cooking and carpet usage).
PM2.5 and PM10 were found to have significant associations with comet tail length at p<0.05. Exposure to PM2.5 and PM10 caused DNA damage in the human buccal cells as observed from the comet tail length. Multiple logistic regression showed the main factor that influenced comet tail length was UFP. This indicated that the children in exposed group who were exposed to UFP were more likely to have genotoxicity of buccal mucosa than those children in comparative group after controlling all the confounders in the study.
These results reflect those findings of Vinzents et al. (2005), whom had proven in demonstrating association between UFP and biologic effects in terms of DNA damage. This may be explained by the fact that UFP fraction of particulate matter with a diameter of <100 nm typically consisted of “fresh” combustion emissions of which vehicle engines were the primary source in urban areas Sioutas et al. (2005). A study by Madureira et al. (2012) also proved that the increasing level of traffic emission outside the school building influenced the level of indoor air parameters such as particulate matter (PM) and UFP in the classrooms. A local study by Muhamad Daud et al. (2018) also indicated that indoor air pollutants in classrooms especially UFP and NO2 are most likely to have an impact on the micronuclei (MN) frequency found in the exfoliated buccal mucosa.
4. CONCLUSIONS
The present findings indicate that exposures among primary school children to the high TRAP concentrations might increase the risk of suffering respiratory health symptoms, which ultimately increase the DNA damage. The proximity of children’ houses from the main road also showed a significant difference between the two groups. This study showed that there were significant differences of the TRAP concentrations in schools especially for PM2.5, PM10, UFP, CO, NO2 and SO2 between exposed and comparative group. Indoor PM2.5 and PM10 in exposed area had average concentration of approximately 3 times higher than in indoor of comparative area, while outdoor PM2.5 and PM10 in exposed area had average concentration of approximately 2 times higher than in outdoor of comparative area. Indoor and outdoor UFP and CO in exposed area had average concentration of approximately 2 times higher than in indoor and outdoor of comparative area. We also observed approximately 4-fold and 7-fold increases in indoor NO2 and SO2 between classrooms in exposed and comparative area. Moreover, we observed approximately 10-fold and 13-fold increases in outdoor NO2 and SO2 between classrooms in exposed and comparative area.
TRAP concentrations in exposed schools were significantly higher compared to comparative schools’ concentrations. The respondents in exposed group who were exposed to UFP were more likely to have genotoxicity of buccal mucosa than those respondents in comparative group who were exposed to low concentrations of UFP, after controlling all the confounders in the study. The impact of air pollution at the molecular level is a potential field to be explored for future plans of interventions and policies. Moreover, respiratory health symptoms were found to be significantly higher in exposed group than comparative group. This study also suggests that knowledge should be given to the public, primary school managements and parents to educate and increase awareness specifically about the risk of getting respiratory problems due to the TRAP exposure.
This study is bounded by limitations. The measurements of the TRAP concentrations were only executed in schools. Based on the questionnaire, all children in exposed group lived within exposed vicinity since birth, therefore we only conduct the air measurement in school. However, further studies are needed to evaluate the impact between the TRAP concentrations and respiratory health symptoms among primary school children living in heavy traffic area, with air monitoring to be performed at residences. Higher reported respiratory health symptoms among students attending schools near busy roads emphasized the necessity of school managements to improve indoor air quality by modifying ventilation and filtration systems at schools. It is recommended that the guideline on indoor air quality management particularly in domestic buildings should be developed by the related authorities or ministries. Environmental health impact assessments also need to be conducted prior to the construction of schools to make the best possible school siting decisions.
Acknowledgments
The authors would like to thank Universiti Putra Malaysia for supporting the study with grant under Impact Putra Grant (Project Code: UPM/800-3/3/1/GPB/2018/9659700). We also wish to extend our gratitude to the teachers and staffs of the primary schools for their cooperation and assistance during the data collection process, as well as parents and their children who had voluntarily participated in this study.
References
-
Arifuddin, A.A., Jalaludin, J., Hisamuddin, N.H., (2019), Air Pollutants Exposure with Respiratory Symptoms and Lung Function among Primary School Children nearby Heavy Traffic Area in Kajang, Asian Journal of Atmospheric Environment, 13(1), p21-29.
[https://doi.org/10.5572/ajae.2019.13.1.021]

-
Carpenter, D.O., Bushkin-Bedient, S., (2013), Exposure to Chemicals and Radiation During Childhood and Risk for Cancer Later in Life, Journal of Adolescent Health, 52(5), pS21-S29.
[https://doi.org/10.1016/J.JADOHEALTH.2013.01.027]

-
Ceretti, E., Feretti, D., Viola, G.C.V., Zerbini, I., Limina, R.M., Zani, C., Gelatti, U., (2014), DNA Damage in Buccal Mucosa Cells of Pre-School Children Exposed to High Levels of Urban Air Pollutants, PLoS One, 9(5), e96524.
[https://doi.org/10.1371/journal.pone.0096524]

-
Domingues, É.P., Silva, G.G., Oliveira, A.B., Mota, L.M., Santos, V.S.V., de Campos, E.O., Pereira, B.B., (2018), Genotoxic effects following exposure to air pollution in street vendors from a high-traffic urban area, Environmental Monitoring and Assessment, 190(4), p215.
[https://doi.org/10.1007/s10661-018-6598-2]

-
Gehring, U., Cyrys, J., Sedlmeir, G., Brunekreef, B., Bellander, T., Fischer, P., Bauer, C.P., Reinhardt, D., Wichmann, H.E., Heinrich, J., (2002), Traffic-related air pollution and respiratory health during the first 2 yrs of life, European Respiratory Journal, 19(4), p690-698.
[https://doi.org/10.1183/09031936.02.01182001]

-
Gyori, B.M., Venkatachalam, G., Thiagarajan, P.S., Hsu, D., Clement, M.-V., (2014), OpenComet: An automated tool for comet assay image analysis, Redox Biology, 2, p457-465.
[https://doi.org/10.1016/j.redox.2013.12.020]

-
Huang, H.-B., Lai, C.-H., Chen, G.-W., Lin, Y.-Y., Jaakkola, J.J.K., Liou, S.-H., Wang, S.-L., (2012), Traffic-Related Air Pollution and DNA Damage: A Longitudinal Study in Taiwanese Traffic Conductors, PLoS ONE, 7(5), e37412.
[https://doi.org/10.1371/journal.pone.0037412]

- Kavitha, M., Juliana, J., Abdah, M., (2011), Relationship between Exposure to Particulate Matter and Biomarkers among Bus Drivers in Klang Valley, Malaysia, Health and the Environment Journal, 2(2), p1-7, Retrieved from http://www.hej.kk.usm.my/pdf/HEJVol.2No.2/Article01.pdf.
-
Kim, W.K., Lee, Y.W., Yoon, H.-S., (2014), Associations between outdoor of PM2.5 with cough and wheeze symptoms in asthmatic children in Korea, The Journal of Allergy and Clinical Immunology, 133(2), pAB98.
[https://doi.org/10.1016/j.jaci.2013.12.364]

-
Kumaravel, T.S., Jha, A.N., (2006), Reliable Comet assay measurements for detecting DNA damage induced by ionising radiation and chemicals, Mutation Research, 605(1-2), p7-16.
[https://doi.org/10.1016/j.mrgentox.2006.03.002]

-
Lodovici, M., Bigagli, E., (2011), Oxidative Stress and Air Pollution Exposure, Journal of Toxicology, 2011, p1-9.
[https://doi.org/10.1155/2011/487074]

-
Madureira, J., Paciência, I., Fernandes, E., de, O., (2012), Levels and Indoor-Outdoor Relationships of Size-Specific Particulate Matter in Naturally Ventilated Portuguese Schools, Journal of Toxicology and Environmental Health, 75(22-23), p1423-1436.
[https://doi.org/10.1080/15287394.2012.721177]

- Mohamad Fandi, N.F., Wan Mansor, W.A., Jalaludin, J., (2018), Work exposure to traffic air pollutants (PM10, Benzene, Toluene, and Xylene) and respiratory health implications among urban traffic policemen in Klang Valley, Malaysia, Malaysian Journal of Medicine and Health Sciences, 14(SP2), p2636-9346, Retrieved from http://www.medic.upm.edu.my/upload/dokumen/2018120408583509_MJMHS_SP_Nov_2018.pdf.
- Muhamad Daud, S.A., Jalaludin, J., Sopian, N.A., (2018), Air pollutants exposure and frequency of micronuclei (MN) among primary school children nearby industrial area, Malaysian Journal of Medicine and Health Sciences, 14(SP2), p2636-9346, http://www.medic.upm.edu.my/upload/dokumen/2018120408575208_MJMHS_SP_Nov_2018.pdf.
-
Neri, M., Ugolini, D., Bonassi, S., Fucic, A., Holland, N., Knudsen, L.E., Merlo, D.F., (2006), Children’s exposure to environmental pollutants and biomarkers of genetic damage: II. Results of a comprehensive literature search and meta-analysis, Mutation Research, 612(1), p14-39.
[https://doi.org/10.1016/j.mrrev.2005.04.003]

-
Nordling, E., Berglind, N., Melén, E., Emenius, G., Hallberg, J., Nyberg, F., Bellander, T., (2008), Traffic-Related Air Pollution and Childhood Respiratory Symptoms, Function and Allergies, Epidemiology, 19(3), p401-408.
[https://doi.org/10.1097/EDE.0b013e31816a1ce3]

-
Rawi, N.A.M.N., Jalaludin, J., Chua, P.C., (2015), Indoor air quality and respiratory health among Malay preschool children in Selangor, BioMed Research International, 248178.
[https://doi.org/10.1155/2015/248178]

-
Reno, A.L., Brooks, E.G., Ameredes, B.T., (2015), Mechanisms of Heightened Airway Sensitivity and Responses to Inhaled SO2 in Asthmatics, Environmental Health Insights, 9(Suppl 1), EHI.S15671.
[https://doi.org/10.4137/EHI.S15671]

-
Sioutas, C., Delfino, R.J., Singh, M., (2005), Exposure assessment for atmospheric ultrafine particles (UFPs) and implications in epidemiologic research, Environ Health Perspect, 113(8), p947-955.
[https://doi.org/10.1289/ehp.7939]

-
Tuntawiroon, J., Mahidol, C., Navasumrit, P., Autrup, H., Ruchirawat, M., (2006), Increased health risk in Bangkok children exposed to polycyclic aromatic hydrocarbons from traffic-related sources, Carcinogenesis, 28(4), p816-822.
[https://doi.org/10.1093/carcin/bgl175]

-
Vinzents, P.S., Møller, P., Sørensen, M., Knudsen, L.E., Hertel, O., Jensen, F.P., Loft, S., (2005), Personal exposure to ultrafine particles and oxidative DNA damage, Environmental Health Perspectives, 113(11), p1485-1490.
[https://doi.org/10.1289/ehp.7562]

-
Whyand, T., Hurst, J.R., Beckles, M., Caplin, M.E., (2018), Pollution and respiratory disease: can diet or supplements help? A review, Respiratory Research, 19(1), p79.
[https://doi.org/10.1186/s12931-018-0785-0]

-
Yang Razali, N.Y., Latif, M.T., Dominick, D., Mohamad, N., Sulaiman, F.R., Srithawirat, T., (2015), Concentration of particulate matter, CO and CO2 in selected schools in Malaysia, Building and Environment, 87, p108-116.
[https://doi.org/10.1016/j.buildenv.2015.01.015]

