Behavior and Exposure of Chalk Dust during Classroom Teaching
Copyright © 2019 by Asian Journal of Atmospheric Environment
This is an open-access article distributed under the terms of the Creative Commons Attribution Non-Commercial License (http://creativecommons.org/licenses/by-nc/4.0/), which permits unrestricted non-commercial use, distribution, and reproduction in any medium, provided the original work is properly cited.
Abstract
It is meaningful to estimate the chalk dust behavior and its exposure for school-aged children and teachers who spend a lot of time in the classroom. In the present study, model classes were designed to characterize temporal and spatial variations of chalk dust in a classroom and indoor exposure dose to children and teachers. For about 20% of the entire class time, the PM2.5 level greatly exceeded that of ambient PM2.5 daily standard (35 μg m-3). Meanwhile, there was no apparent elevation of PM2.5 during the control experiment carried out using a whiteboard and a dry erase marker with the same teaching behavior. The largest quantity of chalk dust was deposited in the front of the classroom when a cleaner of the blackboard eraser was operated. A SEM image revealed that chalk particles have random shape in a broad range (mainly in the diameter range of 2.0 to 5.0 μm) of their size. The calculated chalk PM2.5 deposition dose, DosePM2.5 (μg), in the alveolar interstitial region revealed the highest level during the period from operating a cleaner of the chalkboard eraser to the end of the class. The DosePM2.5 (μg) in that period was 3.86, 18.95, and 15.79 μg for 10y male/female students, male teacher, and female teacher, respectively.
Keywords:
Chalk dust, Classroom, Exposure, Dose, Children, PM2.51. INTRODUCTION
Usage of chalk in a classroom is a traditional teaching method and it has been popular in many countries for a long time. However, a large amount of chalk dusts including submicrometer dust are generated during a class. A portion of chalk dusts can penetrate into the respiratory system of students and teachers who spend their time in the classroom for many hours of the day (Lin et al., 2015).
Although the chemical composition of chalk depends on its raw material, chalk dusts are considered to be non-toxic because it is usually made of calcium carbonate or magnesium silicate sometimes containing a small portion of aluminum silicate (Fayez-Hassan, 2011; Fujinuki, 1983). However, as a trace element of chalk, Fe was also detected by Fayez-Hassan (2011). Aryal (2007) suggested that inhalation of a small amount of chalk dust does not cause acute illness, but breathing in it for a number of years can trigger respiratory diseases. Zhang et al. (2015) suggested that the chalk PM2.5 can also stimulate alveolar macrophages to produce reactive oxygen species and cause oxidative stress and cytotoxicity.
Meanwhile, using dustless chalk known as anti-dust chalk or low-powder chalk leads to less chalk dust generation during writing and wiping. However, it still releases small particles into the air. Moreover, casein, a milk protein, is often used as one of the raw materials of dustless chalk. It is quite serious for milk allergic school-aged children because when they inhale chalk dusts containing casein, asthma and other respiratory symptoms can occur (Larramendi et al., 2013). Despite this, the most concerning thing is that no adequate legislation is made for indoor air quality of the classroom.
There have been many papers on the human exposure to indoor dusts when chalk is used for teaching (Lin et al., 2015; Alves et al., 2013; Lin and Peng, 2010; Majumdar and William, 2009; Fromme et al., 2008). Lin et al. (2015) investigated human exposure to harmful dust when antidust chalk was used for teaching, as well as how chalk dust affects indoor air quality. Alves et al. (2013) studied comfort parameters and particulate matter (PM10 and PM2.5) in school classrooms and outdoor air. The characterization of indoor PM10, PM2.5, and ultrafine particles in elementary school classrooms was reported by Lin and Peng (2010). Majumdar and William (2009) have examined the nature of particulate chalk dust settled on classroom floor during traditional teaching activities. Fromme et al. (2008) estimated the chemical and morphological properties of particulate matter (PM10, PM2.5) in school classrooms and outdoor air.
However, no study has been conducted on PM2.5 deposition dose in the respiratory tract according to the teacher’s activities during the whole period of a class. Also, a serious effort for the real measurement of spatial distribution of PM2.5 during a class has not been performed.
The current study aims to characterize the spatiotemporal behavior of the chalk dust and to estimate the time dependence of chalk dust exposure to school-aged children and teachers during a classroom teaching.
2. EXPERIMENTAL METHODS
2. 1 A model Classroom and Measurement Setup
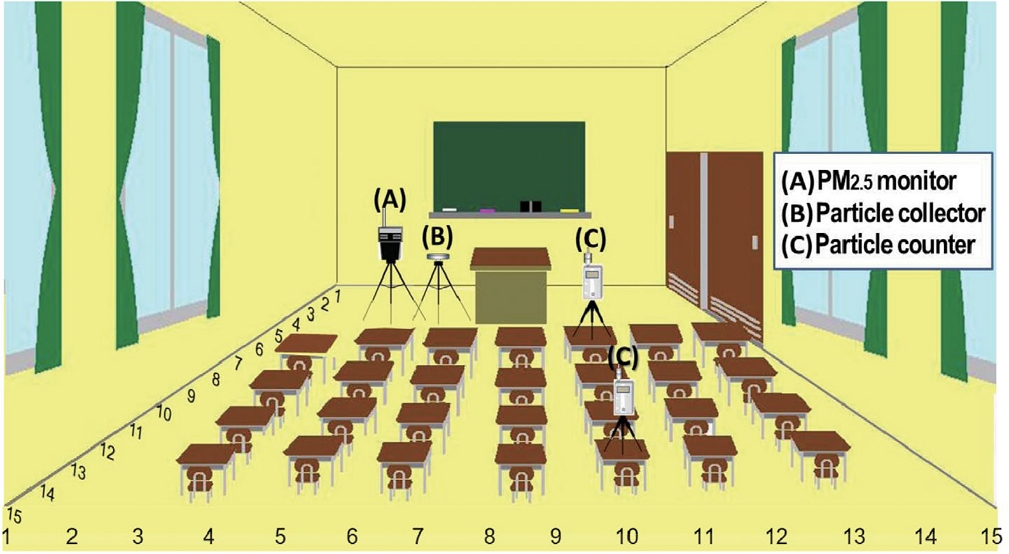
To estimate the dust generated only by teaching activities without external inflow of particles, the middle-size classroom located inside a building was selected. Fig. 1 illustrates the schematic view of the classroom (W6.5 m×L7.6 m×H2.7 m) used for the model classes. The experimental setup designed in the classroom are also found in Fig. 1. The experimental setup consists of two optical particle counters (HHPC3+, HACH Co.) and a PM2.5 monitor (IPM2.5, TSI Co.). A silver (99.99%) foil lying on a passive dust collector was also placed. All our equipments were installed within one meter considering the spatial unevenness of particle loading in the model classroom. In addition to these, two optical particle counters were employed for measuring the spatial distribution of chalk dusts. Every measuring instrument is placed in the front of the classroom within 1.5 m distance from a black (or white) board.
Because every instrument contains a low-capacity minipump, the operation of the instruments did not have significant effect on the behavior (e.g., settlement and resuspension) of the chalk dusts generated during a class. Although an air conditioner and two ceiling fans were situated inside the model classroom, they were not powered during measurements and thus particles were not introduced to classrooms through the infiltration of outdoor air. The indoor-outdoor air circulation was just done through the front door of the classroom when students entered before the class.
2. 2 Model Class and Measurement
The adopted chalk in the model class was produced from Nihon Hakuboku Industry Co. It is widely used in Japan as well as 14 foreign countries. Therefore, this chalk is considered suitable for the assessment of the health hazard of the people related to education fields in the world. Its material, overall length, color, and diameter are calcium carbonate, 80 mm, white, and 9.8 mm, respectively. The JIS ( Japanese Industrial Standards) regulates that a calcium carbonate chalk should contain more than 60% of calcium carbonate ( JIS Id No. S 6010). Its minor components are MgO, Fe2O3, Al2O3, SiO2, P2O5, and MnO (Fujinuki, 1983). Although there are various class duration types, a 50 minutes class was adopted in the present study. The common acts of teacher during the class was assumed to be “writing with a chalk” - “explaining” - “wiping a blackboard” - “writing with a chalk” - “wiping a blackboard” - “operating a cleaner of a blackboard eraser”.
Every measuring instrument was operated through the whole class duration. Some coarse-fraction chalk dusts are probably not widely spread in the classroom compared to fine-fraction dusts. In order to determine the spreading trend of relatively large-size chalk dusts in the whole classroom, a semi-real-time measurement of size-resolved coarse particles was attempted. As shown in Fig. 1, considering the area assigned to a student, the model classroom was divided into 15 coordinates (one section is 43 cm×51 cm) in lengthwise and crosswise, respectively. The mobile measurements were carried out for 5 seconds at one point and the semi-real-time measurements were repeated five times per each model class.
Both fix and mobile measurements were made seven times between April and June 2018. The classroom applied to our model class was occupied with students during every experiment. To avoid the effect of particles created in the previous model class, the new model class was conducted after a daily routine cleaning of a classroom. In the daily routine cleaning, the classroom floor was swept and wiped with a broom and a wet mop.
2. 3 Visual Observation and Elemental Analysis of Chalk Dust
For the purpose of observing the morphology of chalk dusts and their elemental analysis, a SEM ( JEOL JSM-5400) equipped with an EDX (Philips, EDAX DX-4) was employed. After ion-beam sputter coating, the chalk dusts deposited onto a silver foil were placed into the SEM's sample chamber (10-6 Torr). Then several randomly selected dusts were analyzed at 15-20 kV working conditions. The more details on the analytical processes of SEM-EDX were reported earlier (Ma and Kang, 2019).
3. RESULTS AND DISCUSSION
3. 1 Temporal and Spatial Variations of Chalk Dusts
Fig. 2 shows the time series variation of the number concentration of size-resolved particles at the proximity of the chalkboard during the model class. About 55,400 fine particles (Dp 0.3-2.0 μm) per liter already existed as the background level and this level was maintained without a large change until 19 minutes after the class. This background particle number concentration of the model classroom is significantly lower than those of other places such as a Japanese home (131,900 particles per liter) and an ambient nearby roadway in Japan (227,800 particles per liter) (Ma et al., 2015).
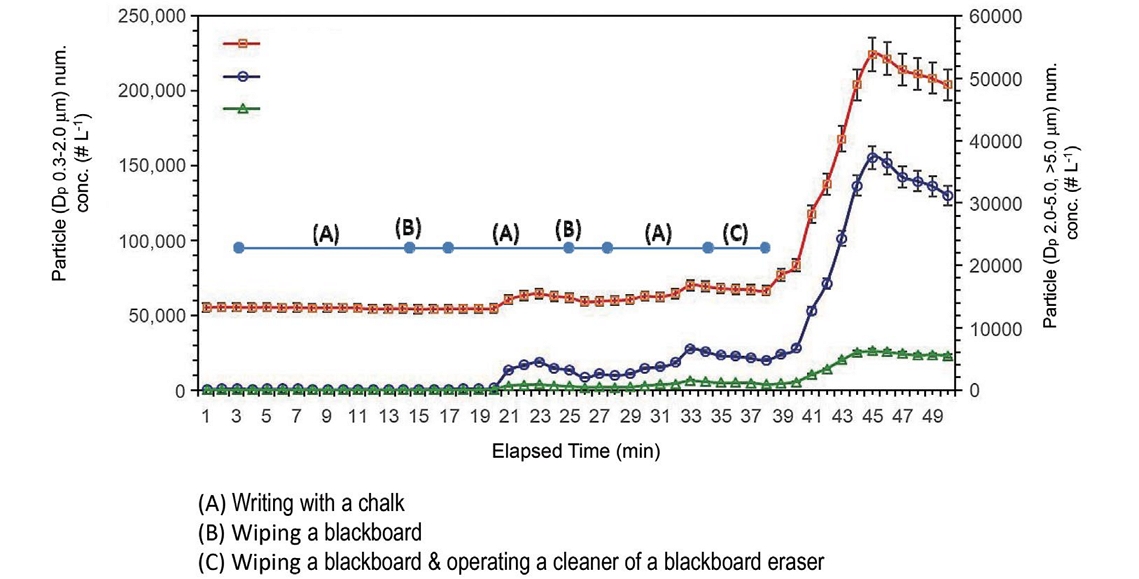
Time series variation of the number concentration for size-resolved particles at the proximity of the chalkboard during a class.
As shown in Fig. 2, the first teacher’s activates (i.e., the first writing with a chalk and wiping a blackboard) did not significantly affect the prompt change of particle concentration. Contrary to expectations, an immediate increasing of dust number concentration did not happen right after wiping the blackboard (15 to 19 minutes). It may be because it took some time for the chalk dust to be detected by the optical particle counter. The increase of particle concentration (especially the particles larger than 2.0 μm) between 23 and 33 minutes indicates that wiping a blackboard can cause some variation in particle concentration during the class. Meanwhile, according to the rapid increase of the particles of all sizes after 39 minutes, the operation of the cleaner of the blackboard eraser, which was located right next to the blackboard, can stir up the chalk dusts including the upper size range (>5.0 μm) settled on the floor and allows the chalk dusts to keep their higher concentrations in the latter period of the class. The cleaner of the blackboard eraser has been used to shake off and trap the attached chalk dusts. However, when it is running, some of the collected chalk dusts are getting into all over the classroom atmosphere by blowing air from the rear of a motor. As a result, it generates a high level of chalk dusts in the classroom which may be a dangerous indoor environment for both the teacher as well as the student.
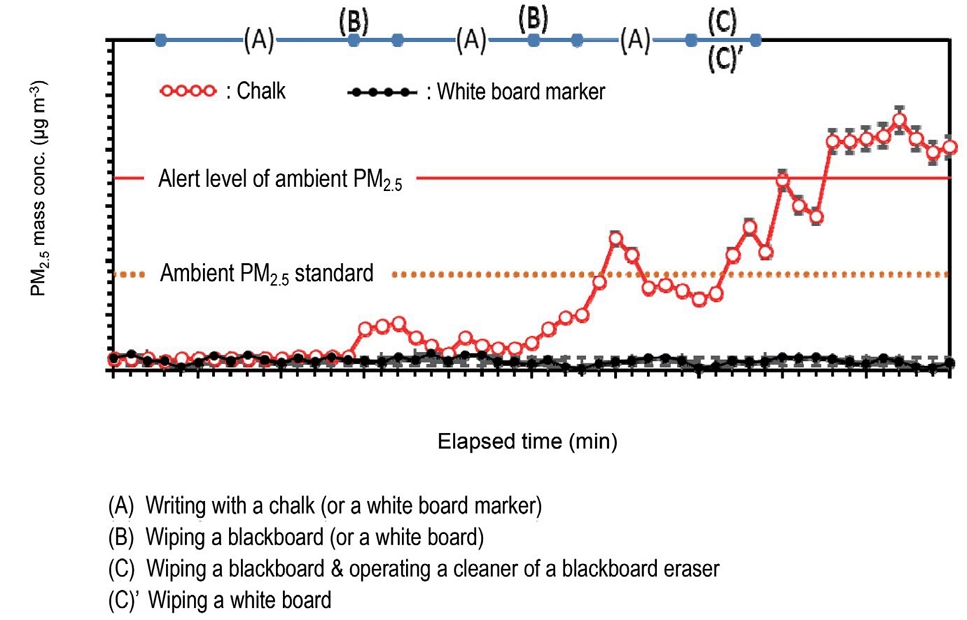
The reduction trend of particle concentration after 46 minutes shown in Fig. 2 suggests that it take about 30 minutes before being recovered to the background state. Therefore, as the normal class schedule, if a next class begins right after 10 minutes from the previous class, school-aged children and teachers would be exposed to very high PM levels. Fig. 3 shows the timely variation of PM2.5 at the front of the classroom during the whole period of the model classes. As shown in Fig. 3, the time-series fluctuation of PM2.5 shows the similar results to that of the particle number concentrations. The result indicates that a large quantity of PM2.5 was also generated when chalk was used during the class. The highest PM2.5 level (which significantly exceeds the Japanese alert level of ambient PM2.5) was observed until the end of the class after operating the cleaner of the blackboard eraser. The fine chalk powders clumped onto the blackboard eraser might be scattered when they came out of the cleaner of the blackboard eraser. The resuspending of the small particles deposited on the floor before the class by the mechanical air flow in the closed classroom is also considered as another reason for the elevated PM2.5 level. According to Fig. 3, for about 20% of the entire class time, the indoor PM level was greatly exceeded that of the Japanese ambient PM2.5 standard. Meanwhile, there was no apparent elevation of PM2.5 during the control experiment carried out using a white board under the same teaching activities (i.e., the same amount of the word written on a whiteboard and same time schedule).
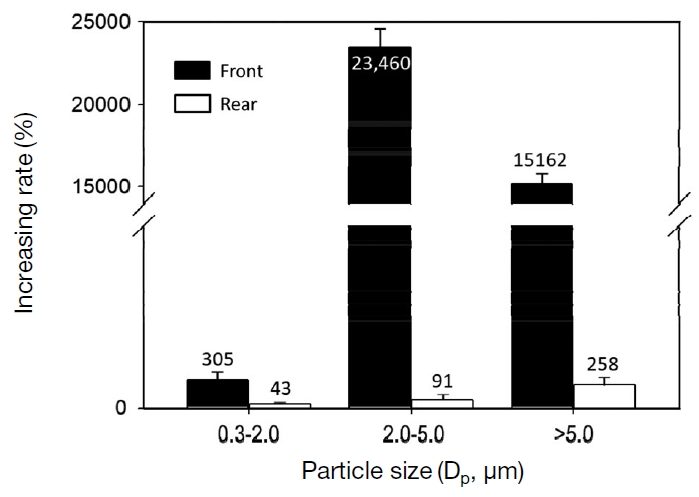
Fig. 4 shows the increasing rate of the particle number concentrations when they reached to the highest level (i.e., a few minutes after operating the cleaner of the blackboard eraser) at the front and rear of the model classroom, respectively. The increasing rate, Rinc. (%), was simply calculated by the formula below.
Increasing rate of the number concentrations of size-resolved particles at the front and rear of classroom by class.
where, Cmax and Cback are the maximum and the background particle number concentrations, respectively. Rinc. (%) was obviously higher in the proximity of the chalkboard than in the rear of the classroom. Among three kinds of particle sizes, the medium sized particles (i.e., in the diameter range of 2.0 to 5.0 μm) show the biggest increasing rate. This result agrees with that of Majumdar and William (2009). They suggested that a large proportion of dusts generated from chalks were of <4.5 μm size. They also reported non-dusting chalks, on an average, produced about 62% of PM (by volume) which is with <4.5 μm (respirable diameter). Elsewhere, Almeida et al. (2011) argued that high concentrations of PM10-2.5 containing calcium were attributed to the chalk use in the classroom.
Our discussion so far has focused mostly on the situation of the front of the model classroom during class activities. However, in is necessary to estimate the spatial distribution of the chalk dusts through the whole classroom, as it is very important to know if it is reasonable to allocate the students with allergy symptoms at the rear of the classroom. As mentioned previously, the chalk dusts containing casein can be particularly dangerous to the milk allergic children.
Fig. 5 shows the spatial distribution of particles in two different fractions (PM5.0-2.0 and >PM5.0) at the classroom during a whole class. The high concentrations of chalk dusts were observed in the front of the classroom, especially in the proximity of the blackboard. At the whole classroom area, the particles sized in 2.0-5.0 μm show a relatively higher concentration than that of the particles larger than 5.0 μm. Both kinds of particles were primarily distributed in the proximity of the chalkboard. Thus, teachers and students who took a seat in the front row are easy to be exposed to high levels of chalk dusts. The chalk dust concentration was sharply decreased from the front to the back of the classroom. Meanwhile, as expected, a relatively low concentration was found in the back row, and the lowest concentration was found at the corner of the back which is farthest from the classroom door. Therefore, teachers should pay special attention to seat the allergic school-aged children in the back row where chalk dusts are less. Unexpectedly, an extremely low dust concentration was observed near the entrance door. It is probably because the presence of some air exchange can dilute the indoor dust concentration locally.
3. 2 Exposure Dose to Children and Teachers
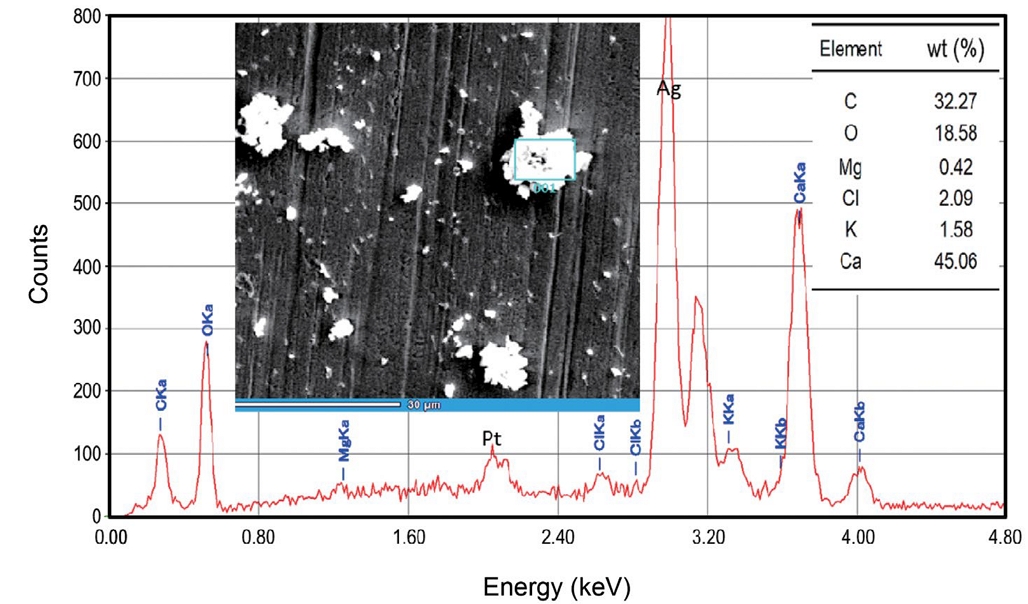
Although the manufacturer of chalk revealed the major components of chalk, in order to clarify its real elemental compositions, the chalk dusts deposited on the silver foil were analyzed by SEM-EDX. Fig. 6 illustrates the SEM morphology of the deposited chalk dusts and the EDX spectrum for a large chalk dust. The elemental wt (%) can also be found in Fig. 6. A SEM image revealed that chalk particles had random shape in a broad range of particle sizes. Most of the dusts collected during the model classes consisted primarily of calcium and followed by carbon and oxygen, and no significant difference was found among the analyzed dusts. The peaks of Pt and Ag in the EDX spectrum were from the coating agent and the Ag foil used as the collecting material, respectively. Based on the elemental compositions of dusts, it is clear that the chalk dusts are the primary source of indoor particles of the classroom. Health risks associated with the exposure to calcium carbonate in chalk dust are both potential acute and chronic health effects. Irritation to the eyes, respiratory tract, mucous membranes, and digestive tract are examples of the former. Examples of the latter case include lung and liver damage (Sciencelab. com, 2005).
It is crucial to know how much chalk origin PM2.5 actually enter the respiratory system of the teacher and students. In the present study, the chalk PM2.5 deposition doses in the alveolar interstitial (AI) region of elementary school students (10-year-old females and males) and female and male teachers during the model class were estimated. The PM2.5 deposition dose (DosePM2.5, μg) was determined using the average PM2.5 concentration (μg m-3) in each period of model classes, deposition fraction (FDEP.), exposure time (TEXP., h), and breathing rate (RBRE., m3 h-1). The DosePM2.5 (μg) was calculated by the below empirical equation proposed by Löndahl et al. (2007).
DosePM2.5 (μg) = PM2.5 × FDEP. × TEXP. × RBRE.
The detail parameters for the calculation of DosePM2.5 (μg) are summarized in Table 1. In Table 1, the deposition fraction (FDEP.) is the maximum deposition efficiency (%) in the AI region according to the activity patterns suggested by Yamada et al. (2007).

The parameters for the calculation of DosePM2.5 (μg) in the AI (alveolar interstitial) region for elementary school students and teachers during a model class.
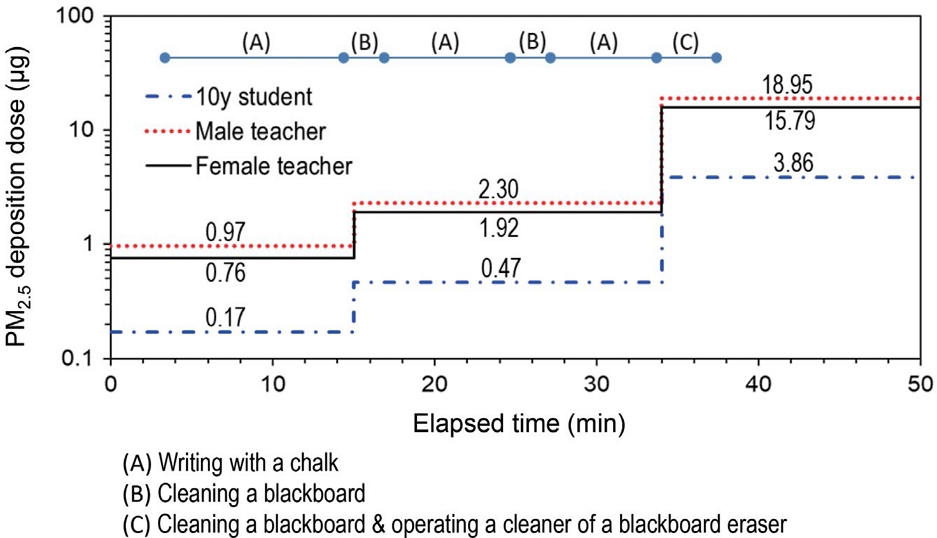
Fig. 7 shows the DosePM2.5 (μg) in the AI region according to the teacher’s conducts during the whole period of the model class. The highest dose was estimated during the period from operating the cleaner of the chalkboard eraser to the end of the class. The dose levels in this period are 3.86, 18.95, and 15.79 μg for 10-year-old male/female students, male teacher, and female teacher, respectively. Considering the entire classes in every weekday, the chalk PM2.5 inhalation from the classroom will account for the greatest percentage of the whole exposure of PM2.5. Although the DosePM2.5 for 10-year-old students evaluated in this study is lower compared to that for adult teachers, children’s lung surface area per body weight makes them especially susceptible to ultra-fine particles (Almeida et al., 2011).
PM2.5 deposition dose (μg) in the AI region according to the teacher’s conducts during whole period of a class.
In this study, the DosePM2.5 (μg) was determined by assuming the PM2.5 concentration in the classroom was uniform. However, as already shown in Fig. 5, PM2.5 concentration can also be high and low depending on the student’s seat. Therefore, some students may have higher levels of DosePM2.5 (μg) locally. Kesten et al. (1990) suggested that the respiratory rate of asthmatic patients was higher than that of the healthy people. Thus, if an asthmatic student takes a class, his (or her) DosePM2.5 (μg) will increase significantly compared to other normal students. Although the chalk origin PM2.5 is a menace to not only students but teachers, it can be thought that the PM2.5 derived from chalk can be more potentially harmful to teachers. This is both because of proximity to the chalkboard and because of teaching with their mouth open during the classes.
4. CONCLUSIONS
Although the teaching with boards and chalks is shifting to that with marker-whiteboards, chalk is still widely used in the world because it is cheaper than whiteboard markers. Under this circumstance, because chalk dust is considered an irritant and an occupational hazard, we should pay special attention to the health of students and teachers who are exposed to chalk dust for a long time. It is more worrisome as no adequate legislation for the indoor air quality of the classroom has been made yet. In this study, it was clarified that a large quantity of chalk dust was deposited in the front of classroom, especially when a blackboard eraser was cleaned off. Although chalk dusts have no extremely dangerous ingredient, the calculated chalk PM2.5 deposition dose in the AI region revealed the highest level when the cleaner of the chalkboard eraser was operated. Therefore, the potential health risks of chalk dust particles to school-aged children and teachers cannot be overlooked. Now, people should be seriously concerned about what is the best way to make the school-aged children and teachers inhale as little chalk-dusts as possible during the classes. The establishment of a related law is the first priority. After that, educational authorities should ban the use of chalk. If the full abolition is impossible, using a non-dust chalk, wiping blackboard with a wet cloth, and equipping the vacuum chalk-dust collector must be actively promoted.
Acknowledgments
This paper was supported by Wonkwang Health Science University in 2019. The authors would like to extend their sincere appreciations to the students of both Department of Environmental Science, Fukuoka Women’s University, Japan and Department of Medical Administration, Wonkwang Health Science University, Korea for their experimental supports.
References
-
Almeida, S.M., Canha, N., Silva, A., Freitas, M.D.C., Pegas, P., Alves, C., Evtyugina, M., Pio, C.A. (2011) Children exposure to atmospheric particles in indoor of Lisbon Primary Schools. Atmospheric Environment 45, 7594-7599
[https://doi.org/10.1016/j.atmosenv.2010.11.052]

-
Alves, C., Nunes, T., Silva, J., Duarte, M. (2013) Comfort parameters and particulate matter (PM10 and PM2.5) in school classrooms and outdoor air. Aerosol and Air Quality Research 13, 1521-1535
[https://doi.org/10.4209/aaqr.2012.11.0321]

-
Aryal, B. (2007). Rationale of school-site Health promotion for Teacher. Journal of HEPASS 3(1), 45-48
[https://doi.org/10.1063/1.4929304]

- Fayez-Hassan, M. (2011) Investigation of lecturer’s chalk by X-ray florescence and fast neutron activation techniques. Proceedings of the 8th Conference on Nuclear and Particle Physics, 20-24 Nov. 2011, Hurghada, Egypt.
-
Fromme, H., Diemer, J., Dietrich, S., Cyrys, J., Heinrich, J., Lang, W., Kiranoglu, M., Twardella, D. (2008) Chemical and morphological properties of particulate matter (PM10, PM2.5) in school classrooms and outdoor air. Atmospheric Environment 42, 6597-6605
[https://doi.org/10.1016/j.atmosenv.2008.04.047]

- Fujinuki, T. (1983) Chemical properties of limestone, The limestone industry association, p. 43-73 (in Japanese).
- JIS ( Japanese Industrial Standards) Id Number 0 575 S 6009 Chalk (Replaces S 6010).
-
Kesten, S., Maleki-Yazdi, R., Sanders, B.R., Wells, J.A., McKillop, S.L., Chapman, K.R., Rebuck, A.S. (1990) Respiratory rate during acute asthma. Chest 97(1), 58-62
[https://doi.org/10.1378/chest.97.1.58]

-
Larramendi, C.H., Marco, F.M., Llombart, M., de la Vega, A., Chiner, E., García-Abujeta, J.L., Sempere, J.M. (2013) Allergenicity of casein containing chalk in milk allergic schoolchildren. Annals of Allergy, Asthma & Immunology 110(5), 335-339
[https://doi.org/10.1016/j.anai.2013.02.006]

-
Lin, C.C., Lee, M.K., Huang, H.L. (2015) Effects of chalk use on dust exposure and classroom air quality. Aerosol and Air Quality Research 15, 2596-2608
[https://doi.org/10.4209/aaqr.2015.04.0216]

-
Lin, C.C., Peng, C.K. (2010) Characterization of indoor PM10, PM2.5, and ultrafine particles in elementary school classrooms: A Review. Environmental Engineering Science 27, 915-922
[https://doi.org/10.1089/ees.2010.0175]

-
Löndahl, J., Massling, A., Pagels, J., Swietlicki, E., Vaclavik, E., Loft, S. (2007) Size-resolved respiratory-tract deposition of fine and ultrafine hydrophobic and hygroscopic aerosol particles during rest and exercise. Inhalation Toxicology 19, 109-116
[https://doi.org/10.1080/08958370601051677]

-
Ma, C.J., Kang, G.U. (2019) Chemical property of the fly ash collected at an incinerator and its effects on near ambient particles. Asian Journal of Atmospheric Environment 13(2), 136-143
[https://doi.org/10.5572/ajae.2019.13.2.136]

-
Ma, C.-J., Lee, K.B., Kim, S.D., Sera, K. (2015) Chemical properties and source profiles of particulate matter collected on an underground subway platform. Asian Journal of Atmospheric Environment 9, 165-172
[https://doi.org/10.5572/ajae.2015.9.2.165]

-
Majumdar, D., William, S.P. (2009) Chalk dust fall during classroom teaching: Particle size distribution and morphological characteristics. Environmental Monitoring and Assessment 148, 343-351
[https://doi.org/10.1007/s10661-008-0164-2]

- Sciencelab.com. (2005) Material Safety Data Sheet: Calcium Carbonate, http://www.sciencelab.com/msds.php?msdsId=9923275, , Last Access: 25 October 2015.
-
Yamada, Y., Fukutsu, K., Kurihara, O., Momose, T., Miyabe, K., Akashi, M. (2007) Influences of biometrical parameters on aerosol deposition in the ICRP 66 human respiratory tract model: Japanese and Caucasians. Aarozoru Kenkyu 22, 236-243
[https://doi.org/10.11203/jar.22.236]

-
Zhang, Y., Yang, Z., Li, R., Geng, H., Dong, C. (2015) Investigation of fine chalk dust particles’ chemical compositions and toxicities on alveolar macrophages in vitro. Chemosphere 120, 500-506
[https://doi.org/10.1016/j.chemosphere.2014.09.009]


