How Vegetation Spatially Alters the Response of Precipitation and Air Temperature? Evidence from Pakistan
 ; Ammar Ahmad Baig2) ; Liaqat Ali Shah2) ; Jehanzeb Khan3)
Copyright © 2020 by Asian Association for Atmospheric Environment
This is an open-access article distributed under the terms of the Creative Commons Attribution Non-Commercial License (http://creativecommons.org/licenses/by-nc/4.0/), which permits unrestricted non-commercial use, distribution, and reproduction in any medium, provided the original work is properly cited.
Abstract
Precipitation, air temperature and Normalized Difference Vegetation Index (NDVI) data of 32 sites for a period of 1983 to till date in Pakistan were collected with the objective of studying the effects of vegetation on precipitation and air temperature in Pakistan. Spatial trends were assessed for NDVI, precipitation and air temperature (maximum and minimum). Increasing trends were observed at 18, 20, 24 and 26 number of monitoring stations for NDVI, precipitation and maximum and minimum temperature respectively. The trends of NDVI were compared with the trends of precipitation and maximum and minimum temperature in hilly and urban areas. NDVI and precipitation showed parallel trends in hilly areas at 64% of the monitoring stations. Whereas, only 53% of the stations displayed parallel trends in urban areas. 71% of the stations showed opposite NDVI and maximum temperature trends and 79% of the stations showed opposite NDVI and minimum temperature trends in hilly areas. However, in urban areas only 47% and 41% of the stations showed opposite trends of NDVI and maximum temperature and NDVI and minimum temperature respectively. Pearson’s correlation coefficients were calculated to determine the effects of vegetation on precipitation and air temperature (maximum and minimum) in hilly and urban areas. The results showed that there exists positive relationship between NDVI and precipitation and negative relationship between NDVI and temperature (maximum and minimum) in most of the hilly areas. However, in urban areas, the positive relationship between NDVI and precipitation exists only in 47% of the stations and negative relationships between NDVI and maximum temperature and between NDVI and minimum temperature exist only in 47% and 41% of the stations respectively. Results of the current study suggest afforestation practices at country level to reduce climate change effects.
Keywords:
Climate change, Normalized difference vegetation index, Precipitation, Temperature, Vegetation1. INTRODUCTION
Precipitation and air temperature are important climatic factors that have great influence on human activities and ecosystem. Climate of the world is changing abruptly and scientists around the world have developed a consensus about the fact that climate is changing, and warming is due. Globally per year the sum of hot days is more than the sum of cold days and extreme precipitation events have increased in more regions than where it has decreased (Amin et al., 2018).
The leading factor in controlling the distribution of vegetation types is climate. On the other hand, vegetation cover also exerts some influence over climate by changing the physical characteristic of the land surface like albedo, roughness, water conductivity (bio geophysical mechanisms) and atmospheric gas composition, for example, CO2 and CH4 (biogeochemical effects) (Brovkin, 2002).
Studies conducted on relationship between terrestrial ecosystems and changes in climate show that there exist relations between the two (Cao et al., 1998; Pielke et al., 1997). Variation in climatic system has a noteworthy influence on the global ecosystem. Similarly, many physical, physiological, and chemical feedback processes of the land ecosystems effect the climate system (Zhou et al., 2007). Studies show that changes in local, regional and global climate at a diurnal, seasonal, and long-term scale are caused by changes in vegetation (Kaufmann et al., 2003).
Vegetation provides a transitional linkage between pedosphere, atmosphere and hydrosphere. Therefore, analyzing variation in vegetation and determining their association with climatic changes is becoming a significant feature of research on climate change (Rees et al., 2001).
Altering the properties of the surface of land like albedo and roughness can effectively influence the climate (Bonan, 1997). The most immediate example is the tropical forest, where grassland has taken the place of dense vegetation and has resulted in a climate which is warmer and drier (McGuffie et al., 1995; Henderson-Sellers et al., 1993). Climatic simulations of desertification, in which the vegetation is replaced by desert by increasing albedo of the surface, reduction of the length of the roughness and decrease of water retention capacity of the soil, display reduction in precipitation in response to desert surfaces (Charney et al., 1977). In the boreal forests the trees cover the snow having high albedo in summer and spring due to which the temperature rises (5°C to 10°C) as compared to tundra vegetation (Bonan et al., 1992). Past and future changes in the location of the forest tundra are significant responses to the climate system (Pielke et al., 1995). Variation in soil properties and vegetation in N. Africa some six thousand years ago due to increase in precipitation has strengthened the monsoon and thus more wet conditions prevail (Kutzbach et al., 1996).
To determine spatial distribution and productivity of vegetation remote sensing was used. Normalized difference vegetation index (NDVI) is frequently applied for assessments of spatial distribution of vegetation. It is often applied to specify activity of vegetation, as it shows almost linear relationship with the fraction of photosynthetically active radiation absorbed by the vegetation canopy (FPAR) (Asrar et al., 1984) and net primary production (NPP) (Goward et al., 1985).
Vegetation provides a connection between soil, air, water and other environmental variables and is an important component of the land surface system (Foley et al., 2000). Vegetation dynamics can offer important evidence about global warming (Pettorelli et al., 2005). Normalized Difference Vegetation Index (NDVI), obtained from measuring the visual reflectance of the light of sun in the red and near-infrared wavelengths (Tucker, 1979), is very sensitive to ecosystem surroundings (Myneni et al., 1995). Therefore, it can be used as a substitution for perceiving variations in vegetation activity, e.g., increase of greening (NDVI increase) and increase of browning (NDVI decrease) (Alcaraz-Segura et al., 2010).
Scientific research on effects of vegetation on precipitation and air temperature in Pakistan is somewhat rare. This research was the first step towards filling this gap. Based on the spot vegetation data and in-situ meteorological data from the Pakistan Meteorological Department (PMD), this research aimed to find the effects of vegetation on precipitation and air temperature in Pakistan.
2. MATERIALS AND METHODS
2. 1 Study Area
The study area included the whole of Pakistan. The 36th largest country by area, Pakistan, is situated in South Asian region between 24-37°N of latitude and 61-76°E of longitude. Most of the Pakistan lies in subtropics while some parts of the country lie in the temperate region. A major portion of the country is arid to semi-arid with a few areas in the southern half of the country as hyper-arid. Coastal type of climate is prevalent along the sub-mountain regions of Himalayas. The climate is generally characterized by hot summers and cool or cold winters, and wide variations between extremes of temperature at given locations. The rainfall is generally low with exception of the monsoons.
There are four seasons in Pakistan. From December to February the weather is cool and dry. It is followed by spring which starts in March and ends in May. From June the rainy season starts. This rainy season extends till the month of September. From October to November there is a disappearing monsoon period. The beginning and the length of these seasons are not uniform and are different at different locations.
A large diversity of plant life is found in the country due to the diversity of landscapes and climates. Forests include deciduous forests, coniferous alpine and subalpine, juniper, palms (coconut and date) and tamarisk trees. There are also rough grasses and brushwood. Mangrove forests are found in the south near coastal marshlands.
The forest of Pakistan covers 2.1% of the total land. Pakistan has the following six major types of forests. Alpine/Temperate Forests and Grasslands, Sub-Tropical Moist Evergreen Scrub Forests, Dry Tropical Thorn Forests, Man-Made Irrigated Forest Plantation, Riverian (Bela) Forests and Mangrove (Coastal) Forests.
2. 2 Data Collection
Precipitation, air temperature (minimum and maximum) and NDVI data were collected for the current study as described below.
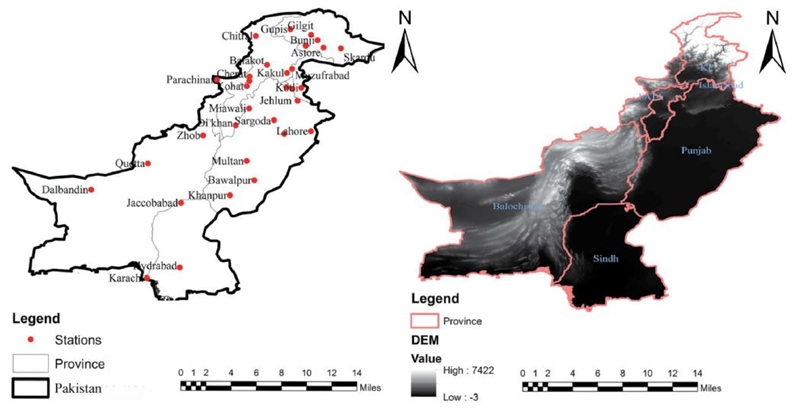
Pakistan Meteorological Department established in 1947 has the responsibility to provide information on weather, climate and geophysical phenomena. The department has installed observatory stations throughout the country to gauge air temperature and precipitation. Precipitation and Air Temperature (minimum and maximum) data were collected from these observatory stations. Fig. 1 shows the location of meteorological stations. This study was based on the data of daily precipitation and air temperature of 32 observatory stations located throughout Pakistan for the period of 1983 to till date. The arrangement of stations is reasonably spread in Pakistan, thus well-representing the precipitation and air temperature of the study area. One of the most important features of this dataset is that it is a record of the lengthiest attainable data of daily precipitation and air temperature in Pakistan.
This research considered the Normalized Difference Vegetation Index as an independent variable. National Oceanic and Atmospheric Administration (NOAA)’s Advanced Very High-Resolution Radiometer (AVHRR) is among one of the sources of global NDVI. The NDVI is calculated by the amount of reflectance in near infrared and red portions of the electromagnetic spectrum and is an efficient indicator for vegetation photosynthesis dynamics. The data are provided as weekly NDVI images at a 4-kilometer spatial resolution. Global NDVI data was downloaded from 1983 to till date form the below mentioned webpage: https://www.star.nesdis.noaa.gov/smcd/emb/vci/VH/vh_ftp.php
2. 3 Methods
In this portion a brief description of the methods used in the analysis of this study is provided.
Gridded weekly NDVI data was extracted for the selected precipitation and air temperature monitoring stations using Spatial Analyst Tools (Extract Multi Values to Points) of the ArcMap. Later weekly NDVI values are converted to average annual values.
2. 3. 2. 1 Spatial Trend Patterns
The non-parametric Mann-Kendall test was used to assess the presence of significant trends in NDVI, precipitation and air temperature. The Mann-Kendall statistic S of the series x is given by:
| (1) |
Where sgn is the signum function. The variance associated with S will be calculated from:
| (2) |
Where m is the number of tied groups and tk is the number of data points in group k. In cases where the sample size n>10, the test statistic Z(S) is calculated from:
| (3) |
Positive values of Z(S) indicate increasing trends, while negative Z(S) values reflect decreasing trends. Trends are considered significant if |Z(S)| are greater than the standard normal deviate Z1-α/2 for the desired value of α.
2. 3. 2. 2 Generic Relationships between Vegetation and Meteorological Factors
Pearson’s correlation was used to make associations of NDVI with precipitation and air temperature at significance level of 0.05 and at confidence level of 95%. The main purpose is to develop linkage between NDVI and precipitation and air temperature.
3. RESULTS AND DISCUSSION
3. 1 Spatial Trend Pattern of Precipitation, NDVI, Maximum and Minimum Air Temperature
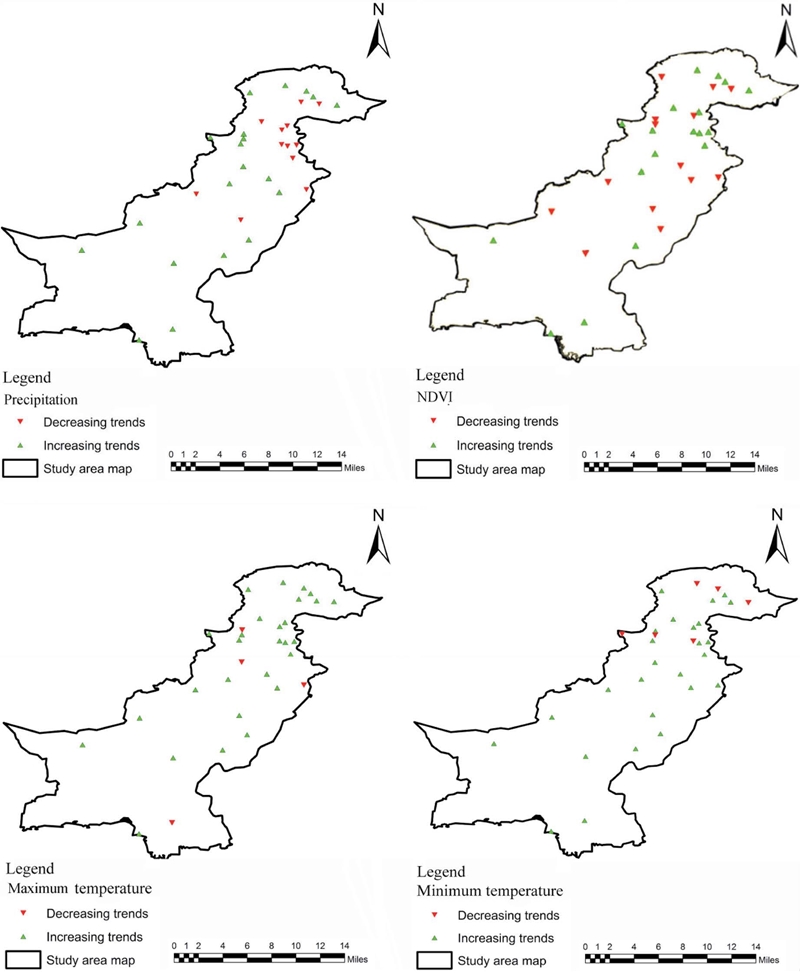
Fig. 2 shows spatial trend pattern of precipitation, NDVI, maximum and minimum air temperature in Pakistan. At majority stations precipitation showed increasing trends. Out of 32 stations 20 stations displayed increasing trends. Most of the stations show increasing trends of maximum temperature. Out of 32 stations 24 stations displayed increasing trends. Like maximum temperature, increasing trends of minimum temperature were found in most of the stations. Only 6 stations showed decreasing trends. 14 stations out of 32 showed decreasing NDVI trends.
3. 2 Comparative Analysis of NDVI, Precipitation and Air Temperature Trends
NDVI trends pattern were compared with precipitation and air temperature (maximum and minimum). This comparison was carried out separately for hilly and urban areas.
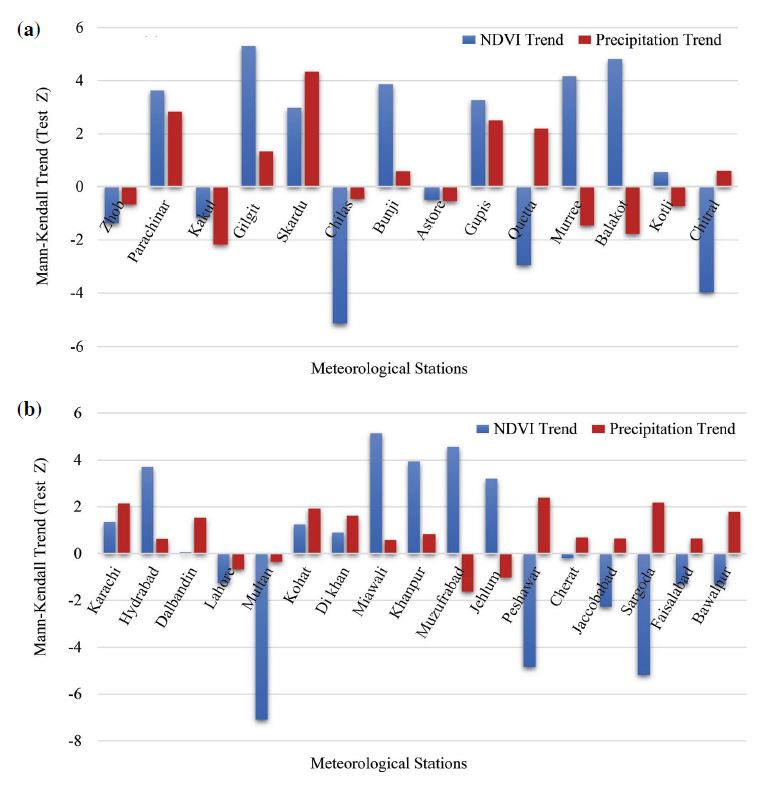
Fig. 3 shows a comparison of NDVI trends pattern with precipitation trends pattern in hilly areas. At majority stations, NDVI and precipitation exhibited parallel spatial trend pattern. Increase or decrease in NDVI is accompanied by increase or decrease in precipitation at the same monitoring station. At 64% stations, spatial trends pattern of NDVI and Precipitation are unidirectional.
NDVI trends pattern were compared with precipitation trends pattern in urban areas as demonstrated by Fig. 3. 53% stations showed unidirectional trend pattern between NDVI and precipitation. Increase or decrease in NDVI is accompanied by increase or decrease in precipitation at the same monitoring station.
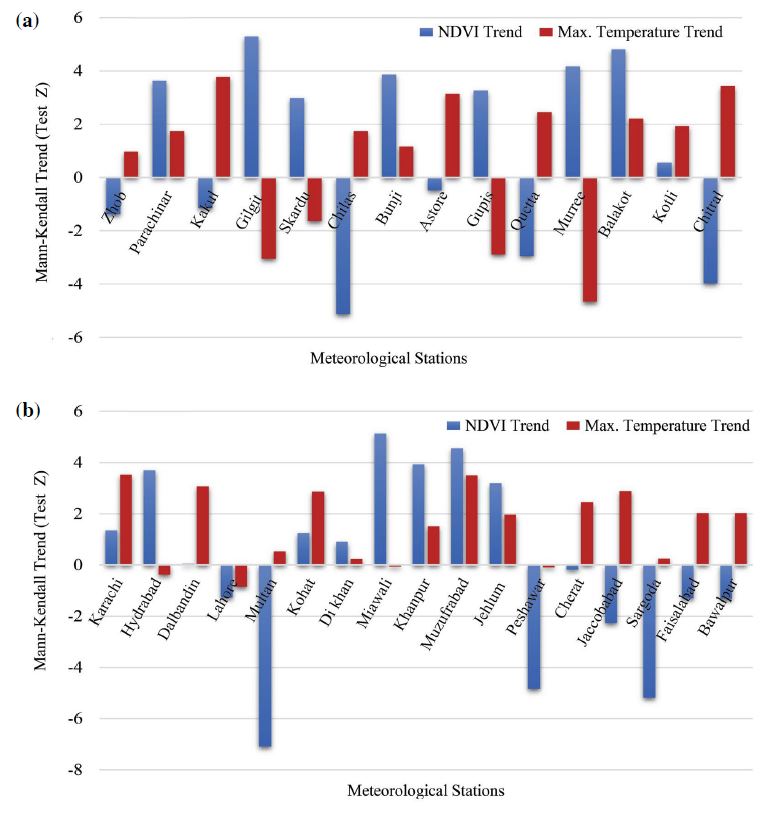
In Fig. 4, NDVI and maximum temperature trends of hilly areas are compared. At majority stations, increasing trend in NDVI is accompanied by decreasing trend in maximum temperature and vice versa. Here we find that in 71% of the stations the trends of NDVI and maximum temperature are in opposite direction.
NDVI trends were compared with maximum temperature trends in urban areas as demonstrated by Fig. 4. At 47% stations bidirectional trend was observed i.e. increase in NDVI is favored by decrease in maximum temperature and vice versa.
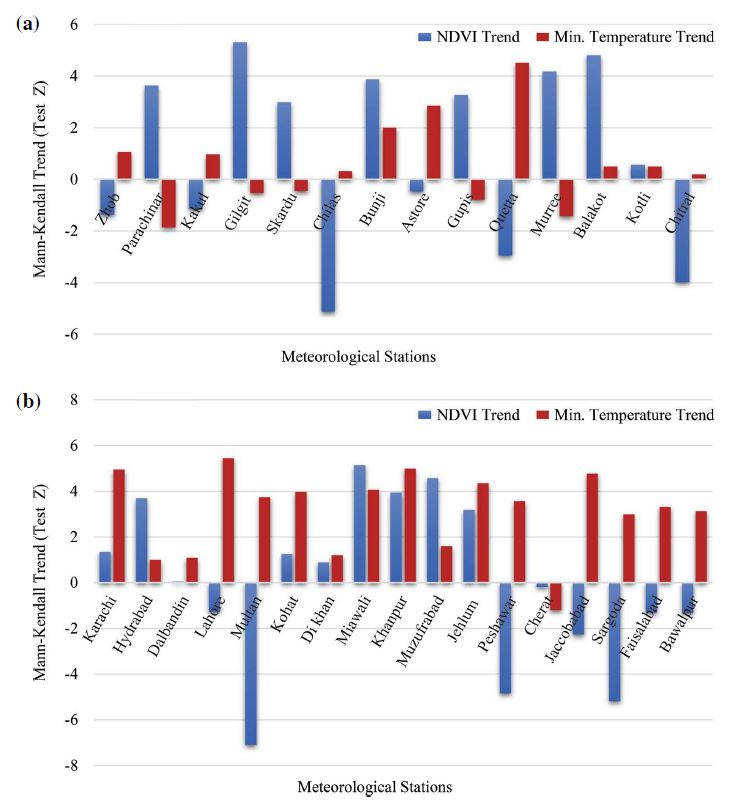
NDVI and minimum temperature trends of hilly areas were compared as obvious from Fig. 5. At 79% stations uphill trends in NDVI is supported by downhill trend in minimum temperature and vice versa.
Fig. 5 shows the comparison of NDVI and minimum temperature trends in urban areas. In 41% stations opposite trends pattern was observed i.e. increasing trends pattern was favored by decreasing trend pattern in minimum temperature and vice versa.
3. 3 Correlation between NDVI, Precipitation and Air Temperature
In order to find the effects of vegetation on precipitation and air temperature (maximum and minimum), Pearson correlation coefficients were calculated.
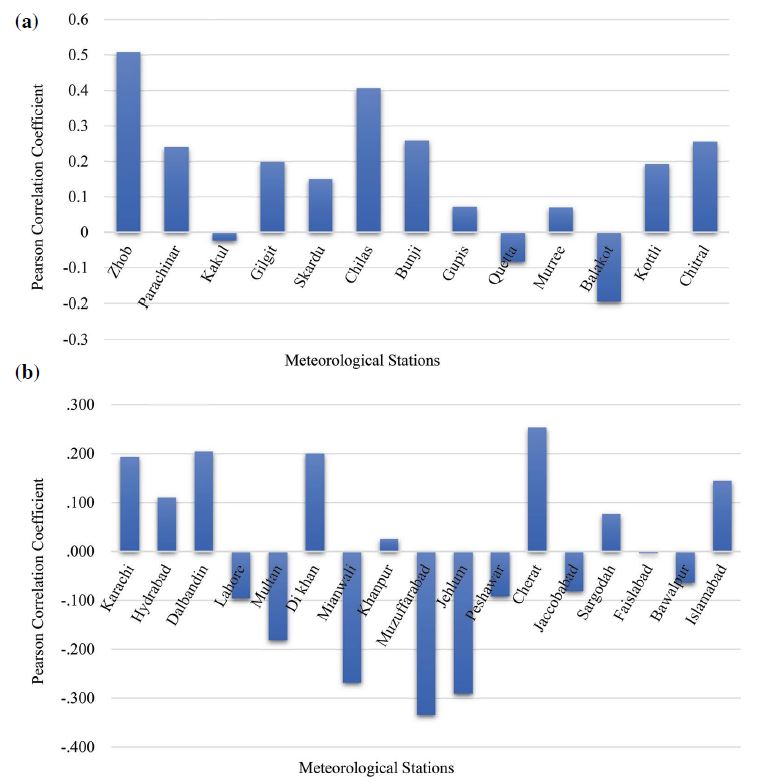
The correlation between NDVI and precipitation of hilly areas were calculated to determine the effects of vegetation on precipitation. The correlations of the abovementioned variables are given in Fig. 6. Results demonstrated that in hilly areas vegetation has a positive effect on precipitation. Positive correlations exist at 77% stations, meaning that in 77% of the stations precipitation has increased or decreased with increase or decrease in NDVI respectively.
The correlation between NDVI and precipitation is positive due to the reason that vegetation is instrumental in regulating moisture content of the atmosphere. Water vapour is released by ocean surface and land into the atmosphere. Vegetation also aids this process trough transpiration. The atmospheric moisture that is produced by this process is circulated by wind and thus causes precipitation.
About 40% of the precipitation on the earth’s surface is caused by evapotranspiration and in some areas like Rio de Plata River, 70% of the precipitation is caused by evapotranspiration (Van der Ent et al., 2010). Transpiration constitutes a major portion of global evapotranspiration (Schlesinger et al., 2014; Jasechko et al., 2013), in that way producing a portion of the water vapor that is available for precipitation.
The effects of evapotranspiration produced by the forests can be perceived in satellite observations of precipitation: above maximum of the tropics, at least two times more precipitation is produced by the air that flows over forests for ten days than air that flows over thin vegetation (Spracklen et al., 2012). Increase in relative humidity has similarly resulted in increase in the probability of precipitation. Increase of 10% rise in relative humidity can result in two-to-three times increase in the quantity of rainfall (Khain, 2009; Fan et al., 2007). Besides, satellite observations propose that cloud formation is mainly affected by European forests (Teuling et al., 2017), and resultantly sunshine/shade dynamics and precipitation.
In some areas, decrease in vegetation declined precipitation. It is because that transpiration has reduced and resultantly the moisture content has decreased. Climate change experts have predicted that extensive deforestation will result in reduction of precipitation by 30% in some areas (Lawrence et al., 2015; Spracklen et al., 2015).
Fig. 6 shows the correlations between NDVI and precipitation of urban areas. In urban areas only 47% of the stations showed positive correlations.
In urban areas other factors such as urban heat island, large surface roughness and concentration of aerosols also influence precipitation. In the atmosphere of urban areas, the concentration of pollutants is high which has considerable impact on precipitation. It has been reported that aerosols have two effects on precipitation. On one hand they act as a screen reducing the amount of sun energy reaching the surface which reduces the production of water vapours necessary for precipitation, while on the other hand they are necessary for cloud formation.
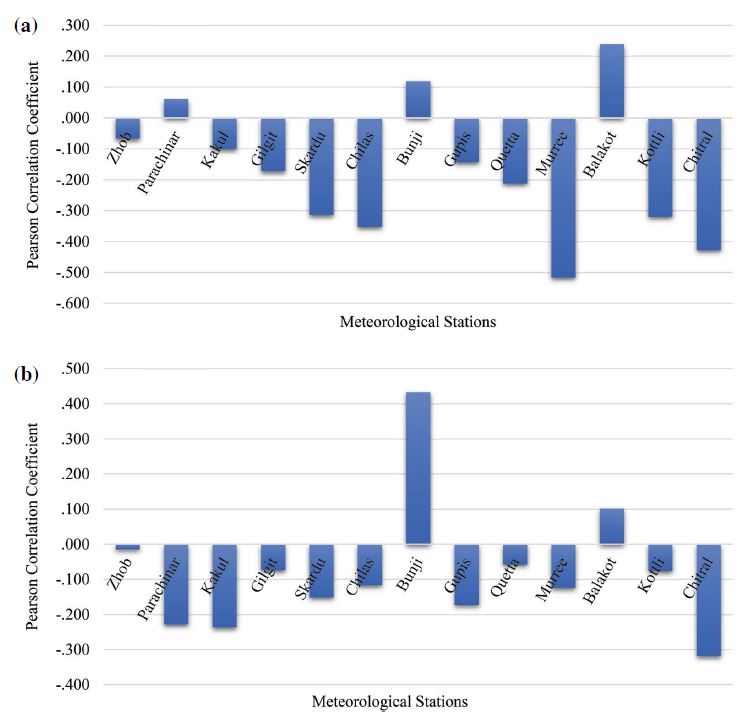
The correlation between NDVI and maximum temperature in hilly areas is demonstrated by Fig. 7. Fig. 7 demonstrates that at 77% of the stations the correlations are negative, meaning that temperature has decreased or increased with increase or decrease in NDVI respectively.
Similarly, Fig. 7 shows the correlation between NDVI and minimum temperature in hilly areas. In 85% of the stations the correlations are negative.
The above results show that maximum and minimum temperature decrease or increase with increase or decrease in vegetation respectively. Both local and global temperatures are affected by vegetation. Locally the temperature of forests can remain much low because of shade and contribution of transpiration in reduction of sensible heat (Hesslerová et al., 2013; Maes et al., 2011; Pokorný et al., 2010). The surface of the earth is cooled by vegetation in regions of tropical and temperate climates.
Forests aids in the formation of clouds at a low level and increase reflectivity (Heiblum et al., 2014; Ban-Weiss et al., 2011). With more area under tree cover such phenomena are increased. In a single day a large tree can transpire roughly hundreds of liters of water. A transpiration of 100 liters of waters equal to a cooling power of 70 kWh, a power enough to operate central air-conditioning units of two average households for a single day (Ellison et al., 2017). Trees having deep roots can have a cooling effect even during extreme hot weather (Teuling et al., 2010; Zaitchik et al., 2006). Similarly, in urban areas trees help in reduction of temperature. Those urban regions where vegetation density is high and have less impermeable surfaces have much low temperatures than those urban areas where solid surfaces are more (Bounoua et al., 2015).
The density and spread of the vegetation cover affect cooling. The role of forests in lowering down the temperature in tropical regions is recognized by inhabitants of those areas (Meijaard et al., 2013; Sodhi et al., 2010). Growing trees within agrarian surroundings (agroforestry) can reduce the temperature (Zomer et al., 2016), and judiciously planning to plant trees in urban surrounding can provide cushion to severe temperatures.
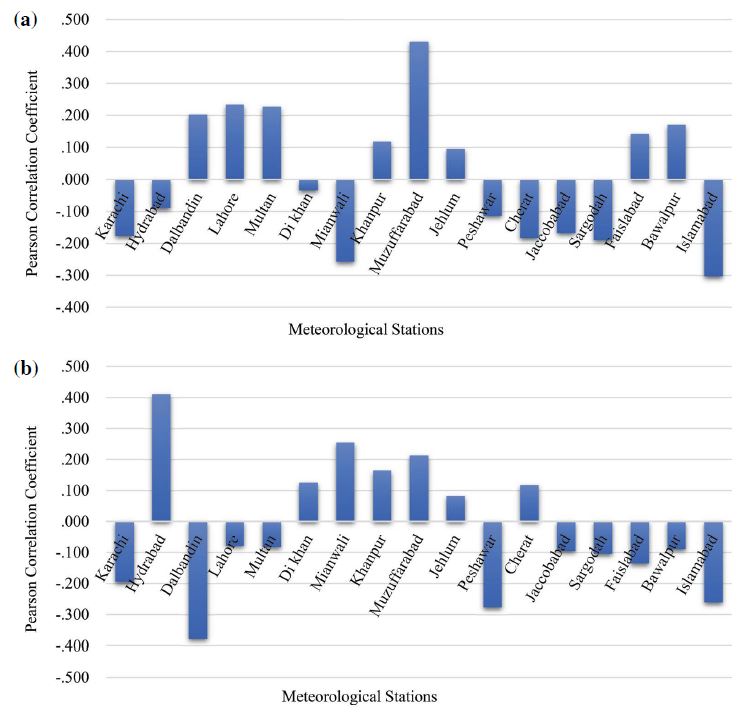
The correlation between NDVI and maximum temperature in urban areas is shown on Fig. 8. 53% of the stations show negative correlation.
Similarly, the correlation between NDVI and minimum temperature is demonstrated by Fig. 8. In urban areas 59% of the stations showed negative trends.
In urban areas the temperature is higher than the rural area because during summers the masonry and asphalt surfaces absorb, store and radiate more heat per unit area. At night the radiative losses from these surfaces keep the air warm. While in winter the temperature is warmer due to fuel burning to keep home and offices etc. warm, to generate power, to run industries and for transportation. Also, the concentration of pollutants is higher in urban areas which absorb more thermal radiation resulting in high temperatures.
4. CONCLUSION
From the above findings it is concluded that precipitation is directly related to vegetation. With increase or decrease in vegetation at a particular station, precipitation also increases or decreases at the same station respectively. However, this relationship is more pronounced in hilly areas than in urban areas. In hilly areas human interference is minimum and therefore vegetation effects on precipitation are more pronounced in contrast to urban areas where human interference is maximum. Due to various anthropogenic activities in urban areas other factors such as urban heat islands, large surface roughness and concentration of aerosols also come into play and affect the precipitation.
On the other hand, the relation between vegetation and temperature was found to be indirect. Increase or decrease in vegetation resulted in decrease or increase in maximum and minimum temperature at majority stations in hilly areas. Similarly, this relationship is more prominent in hilly areas than in urban areas. In urban areas, buildings and roads absorb and radiate more heat per unit area, thus causing the temperature to rise. Also, the concentration of pollutants in the urban area is higher which absorb more thermal radiation causing temperature to rise.
DATA AVAILABILITY
The precipitation, air temperature and NDVI data used to support the findings of the current study are available from the corresponding author upon request.
References
-
Alcaraz-Segura, D.O.M.I.N.G.O., Chuvieco, E., Epstein, H.E., Kasischke, E.S., Trishchenko, A. (2010) Debating the greening vs. browning of the North American boreal forest: differences between satellite datasets. Global Change Biology, 16(2), 760-770.
[https://doi.org/10.1111/j.1365-2486.2009.01956.x]

-
Amin, A., Nasim, W., Mubeen, M., Sarwar, S., Urich, P., Ahmad, A., Wajid, A., Khaliq, T., Rasul, F., Hammad, H.M., Rehmani, M.I.A. (2018) Regional climate assessment of precipitation and temperature in Southern Punjab (Pakistan) using SimCLIM climate model for different temporal scales. Theoretical and Applied Climatology, 131(1-2), 121-131.
[https://doi.org/10.1007/s00704-016-1960-1]

-
Asrar, G.Q., Fuchs, M., Kanemasu, E.T., Hatfield, J.L. (1984) Estimating absorbed photosynthetic radiation and leaf area index from spectral reflectance in wheat 1. Agronomy Journal, 76(2), 300-306.
[https://doi.org/10.2134/agronj1984.00021962007600020029x]

-
Ban-Weiss, G.A., Bala, G., Cao, L., Pongratz, J., Caldeira, K. (2011) Climate forcing and response to idealized changes in surface latent and sensible heat. Environmental Research Letters, 6(3), 1-8.
[https://doi.org/10.1088/1748-9326/6/3/034032]

-
Bonan, G.B. (1997) Effects of land use on the climate of the United States. Climatic Change, 37(3), 449-486.
[https://doi.org/10.1023/A:1005305708775]

-
Bonan, G.B., Pollard, D., Thompson, S.L. (1992) Effects of boreal forest vegetation on global climate. Nature, 359(6397), 716-718.
[https://doi.org/10.1038/359716a0]

-
Bounoua, L., Zhang, P., Mostovoy, G., Thome, K., Masek, J., Imhoff, M., Shepherd, M., Quattrochi, D., Santanello, J., Silva, J., Wolfe, R. (2015) Impact of urbanization on US surface climate. Environmental Research Letters, 10(8), 1-9.
[https://doi.org/10.1088/1748-9326/10/8/084010]

-
Brovkin, V. (2002) Climate-vegetation interaction. In Journal de Physique IV (Proceedings), 12(10), 57-72.
[https://doi.org/10.1051/jp4:20020452]

-
Cao, M., Woodward, F.I. (1998) Dynamic responses of terrestrial ecosystem carbon cycling to global climate change. Nature, 393(6682), 249-252.
[https://doi.org/10.1038/30460]

-
Charney, J., Quirk, W.J., Chow, S.H., Kornfield, J. (1977) A comparative study of the effects of albedo change on drought in semi-arid regions. Journal of the Atmospheric Sciences, 34(9), 1366-1385.
[https://doi.org/10.1175/1520-0469(1977)034<1366:ACSOTE>2.0.CO;2]

-
Ellison, D., Morris, C.E., Locatelli, B., Sheil, D., Cohen, J., Murdiyarso, D., Gutierrez, V., Van Noordwijk, M., Creed, I.F., Pokorny, J., Gaveau, D. (2017) Trees, forests and water: Cool insights for a hot world. Global Environmental Change, 43, 51-61.
[https://doi.org/10.1016/j.gloenvcha.2017.01.002]

-
Fan, J., Zhang, R., Li, G., Tao, W.K. (2007) Effects of aerosols and relative humidity on cumulus clouds. Journal of Geophysical Research: Atmospheres, 112(D14), 1-15.
[https://doi.org/10.1029/2006JD008136]

-
Foley, J.A., Levis, S., Costa, M.H., Cramer, W., Pollard, D. (2000) Incorporating dynamic vegetation cover within global climate models. Ecological Applications, 10(6), 1620-1632.
[https://doi.org/10.1890/1051-0761(2000)010[1620:IDVCWG]2.0.CO;2]

-
Goward, S.N., Tucker, C.J., Dye, D.G. (1985) North American vegetation patterns observed with the NOAA-7 advanced very high resolution radiometer. Vegetatio, 64(1), 3-14.
[https://doi.org/10.1007/BF00033449]

-
Heiblum, R.H., Koren, I., Feingold, G. (2014) On the link between Amazonian forest properties and shallow cumulus cloud fields. Atmospheric Chemistry and Physics, 14(12), 6063-6074.
[https://doi.org/10.5194/acp-14-6063-2014]

-
Henderson-Sellers, A., Dickinson, R.E., Durbidge, T.B., Kennedy, P.J., McGuffie, K., Pitman, A.J. (1993) Tropical deforestation: Modeling local to regional scale climate change. Journal of Geophysical Research: Atmospheres, 98(D4), 7289-7315.
[https://doi.org/10.1029/92JD02830]

-
Hesslerová, P., Pokorný, J., Brom, J., Rejšková-Procházková, A. (2013) Daily dynamics of radiation surface temperature of different land cover types in a temperate cultural landscape: Consequences for the local climate. Ecological Engineering, 54, 145-154.
[https://doi.org/10.1016/j.ecoleng.2013.01.036]

-
Jasechko, S., Sharp, Z.D., Gibson, J.J., Birks, S.J., Yi, Y., Fawcett, P.J. (2013) Terrestrial water fluxes dominated by transpiration. Nature, 496(7445), 347-350.
[https://doi.org/10.1038/nature11983]

-
Kaufmann, R.K., Zhou, L., Myneni, R.B., Tucker, C.J., Slayback, D., Shabanov, N.V., Pinzon, J. (2003) The effect of vegetation on surface temperature: A statistical analysis of NDVI and climate data. Geophysical Research Letters, 30(22), 1-4.
[https://doi.org/10.1029/2003GL018251]

-
Khain, A.P. (2009) Notes on state-of-the-art investigations of aerosol effects on precipitation: a critical review. Environmental Research Letters, 4(1), 1-20.
[https://doi.org/10.1088/1748-9326/4/1/015004]

-
Kutzbach, J., Bonan, G., Foley, J., Harrison, S.P. (1996) Vegetation and soil feedbacks on the response of the African monsoon to orbital forcing in the early to middle Holocene. Nature, 384(6610), 623-626.
[https://doi.org/10.1038/384623a0]

-
Lawrence, D., Vandecar, K. (2015) Effects of tropical deforestation on climate and agriculture. Nature Climate Change, 5(1), 27-36.
[https://doi.org/10.1038/nclimate2430]

-
Maes, W.H., Pashuysen, T., Trabucco, A., Veroustraete, F., Muys, B. (2011) Does energy dissipation increase with ecosystem succession? Testing the ecosystem exergy theory combining theoretical simulations and thermal remote sensing observations. Ecological Modelling, 222(23-24), 3917-3941.
[https://doi.org/10.1016/j.ecolmodel.2011.08.028]

-
McGuffie, K., Henderson-Sellers, A., Zhang, H., Durbidge, T.B., Pitman, A.J. (1995) Global climate sensitivity to tropical deforestation. Global and Planetary change, 10(1-4), 97-128.
[https://doi.org/10.1016/0921-8181(94)00022-6]

-
Meijaard, E., Abram, N.K., Wells, J.A., Pellier, A.S., Ancrenaz, M., Gaveau, D.L., Runting, R.K., Mengersen, K. (2013) People’s perceptions about the importance of forests on Borneo. PloS One, 8(9), 1-14.
[https://doi.org/10.1371/journal.pone.0073008]

-
Myneni, R.B., Hall, F.G., Sellers, P.J., Marshak, A.L. (1995) The interpretation of spectral vegetation indexes. IEEE Transactions on Geoscience and Remote Sensing, 33(2), 481-486.
[https://doi.org/10.1109/TGRS.1995.8746029]

-
Pettorelli, N., Vik, J.O., Mysterud, A., Gaillard, J.M., Tucker, C.J., Stenseth, N.C. (2005) Using the satellite-derived NDVI to assess ecological responses to environmental change. Trends in Ecology & Evolution, 20(9), 503-510.
[https://doi.org/10.1016/j.tree.2005.05.011]

-
Pielke, R.A., Vidale, P.L. (1995) The boreal forest and the polar front. Journal of Geophysical Research: Atmospheres, 100(D12), 25755-25758.
[https://doi.org/10.1029/95JD02418]

-
Pielke, R.A., Lee, T.J., Copeland, J.H., Eastman, J.L., Ziegler, C.L., Finley, C.A. (1997) Use of USGS provided data to improve weather and climate simulations. Ecological Applications, 7(1), 3-21.
[https://doi.org/10.1890/1051-0761(1997)007[0003:UOUPDT]2.0.CO;2]

-
Pokorný, J., Brom, J., Čermák, J., Hesslerova, P., Huryna, H., Nadezhdina, N., Rejšková, A. (2010) Solar energy dissipation and temperature control by water and plants. International Journal of Water, 5(4), 311-336.
[https://doi.org/10.1504/IJW.2010.038726]

-
Rees, M., Condit, R., Crawley, M., Pacala, S., Tilman, D. (2001) Long-term studies of vegetation dynamics. Science, 293(5530), 650-655.
[https://doi.org/10.1126/science.1062586]

-
Schlesinger, W.H., Jasechko, S. (2014) Transpiration in the global water cycle. Agricultural and Forest Meteorology, 189, 115-117.
[https://doi.org/10.1016/j.agrformet.2014.01.011]

-
Sodhi, N.S., Lee, T.M., Sekercioglu, C.H., Webb, E.L., Prawiradilaga, D.M., Lohman, D.J., Pierce, N.E., Diesmos, A.C., Rao, M., Ehrlich, P.R. (2010) Local people value environmental services provided by forested parks. Biodiversity and Conservation, 19(4), 1175-1188.
[https://doi.org/10.1007/s10531-009-9745-9]

-
Spracklen, D.V., Garcia-Carreras, L. (2015) The impact of Amazonian deforestation on Amazon basin rainfall. Geophysical Research Letters, 42(21), 9546-9552.
[https://doi.org/10.1002/2015GL066063]

-
Spracklen, D.V., Arnold, S.R., Taylor, C.M. (2012) Observations of increased tropical rainfall preceded by air passage over forests. Nature, 489(7415), 282-585.
[https://doi.org/10.1038/nature11390]

-
Teuling, A.J., Seneviratne, S.I., Stöckli, R., Reichstein, M., Moors, E., Ciais, P., Luyssaert, S., Van Den Hurk, B., Ammann, C., Bernhofer, C., Dellwik, E. (2010) Contrasting response of European forest and grassland energy exchange to heatwaves. Nature Geoscience, 3(10), 722-727.
[https://doi.org/10.1038/ngeo950]

-
Teuling, A.J., Taylor, C.M., Meirink, J.F., Melsen, L.A., Miralles, D.G., Van Heerwaarden, C.C., Vautard, R., Stegehuis, A.I., Nabuurs, G.J., de Arellano, J.V.G. (2017) Observational evidence for cloud cover enhancement over western European forests. Nature Communications, 8, 1-7.
[https://doi.org/10.1038/ncomms14065]

-
Tucker, C.J. (1979) Red and photographic infrared linear combinations for monitoring vegetation. Remote sensing of Environment, 8(2), 127-150.
[https://doi.org/10.1016/0034-4257(79)90013-0]

-
Van der Ent, R.J., Savenije, H.H., Schaefli, B., Steele-Dunne, S.C. (2010) Origin and fate of atmospheric moisture over continents. Water Resources Research, 46(9), 1-12.
[https://doi.org/10.1029/2010WR009127]

-
Zaitchik, B.F., Macalady, A.K., Bonneau, L.R., Smith, R.B. (2006) Europe’s 2003 heat wave: a satellite view of impacts and land-atmosphere feedbacks. International Journal of Climatology: A Journal of the Royal Meteorological Society, 26(6), 743-769.
[https://doi.org/10.1002/joc.1280]

-
Zhou, D., Fan, G., Huang, R., Fang, Z., Liu, Y., Li, H. (2007) Interannual variability of the normalized difference vegetation index on the Tibetan Plateau and its relationship with climate change. Advances in Atmospheric Sciences, 24(3), 474-484.
[https://doi.org/10.1007/s00376-007-0474-2]

-
Zomer, R.J., Neufeldt, H., Xu, J., Ahrends, A., Bossio, D., Trabucco, A., Van Noordwijk, M. Wang, M. (2016) Global Tree Cover and Biomass Carbon on Agricultural Land: The contribution of agroforestry to global and national carbon budgets. Scientific reports, 6, 1-12.
[https://doi.org/10.1038/srep29987]

