The Comparisons of Real-time Ammonia Adsorption Measurement in Varying Inlet Tubes and the Different Ammonia Measurement Methods in the Atmosphere
 ; Gyutae Park1)
 ; Seokwon Kang
 ; Rahul Singh
 ; Jeongin Song
 ; Siyoung Choi
 ; Inseon Park
 ; Dong-Gil Yu ; Myeong-Bok Kim ; Min-Suk Bae2)
 ; Suna Jung1) ; YuWoon Chang1) ; Jonghun Park3)
 ; Hae-Jin Jung1) ; Yong-jae Lim1), * ; Taehyoung Lee*
Copyright © 2021 by Asian Association for Atmospheric Environment
This is an open-access article distributed under the terms of the Creative Commons Attribution Non-Commercial License (http://creativecommons.org/licenses/by-nc/4.0/), which permits unrestricted non-commercial use, distribution, and reproduction in any medium, provided the original work is properly cited.
Abstract
Ammonia (NH3) is an important, albeit sticky, precursor for producing secondary inorganic aerosols (SIA), especially in the form of ammonium nitrate (NH4NO3) and ammonium sulfate ((NH4)2SO4). To reduce SIAs, many researchers have attempted to measure the concentration of ambient NH3 using real-time or passive methods. However, NH3 is a highly sticky gas and is therefore difficult to measure using real-time methods without incurring losses during measurement. In this study, four different tubing materials, semi seamless tubes, perfluoroalkoxy (PFA), polytetrafluoroethylene (PTFE), and polyvinylidene fluoride (PVDF), were used to ascertain the adsorption of NH3 in inlets using real-time instruments. Without heating sample tubes and at 0% relative humidity (RH), this study shows that PTFE had the least adsorption (i.e., 0% at 1 and 2 m of sample tube), and semi-seamless tubes had the highest adsorption (i.e., 27.5% at 1 m of sample tube). To calculate the adsorption of NH3 under ambient conditions, at various inlet lengths, the RH of NH3 was varied from 20% to 80%, which showed that shorter inlets and higher RH lower NH3 adsorption at inlets (i.e., 1.74 ppb m-1 at 80% RH and 7.48 ppb m-1 at 20% RH). Additionally, inlet heating was effective in reducing the adsorption of NH3 as the RH decreased. Applying the inlet system (i.e., 2 m of PTFE tube with heating) showed excellent correlation (slope: 0.995 and coefficient: 0.992) between two different real-time measurements while measuring ambient air.
Keywords:
Ammonia, Inlet adsorption, Polytetrafluoroethylene, Protocol, Ammonia measurement1. INTRODUCTION
Ammonia (NH3) is a gaseous substance with very high adsorption properties (Bobrutzki et al., 2010). It is emitted into the atmosphere via various activities such as excreta management, agriculture, and substances such as mobile pollutants (Paulot et al., 2014). NH3 emissions in South Korea have gradually increased from 292 Gg in 2014 to 301 Gg in 2016 (Park et al., 2019). When NH3 reacts with nitric acid (HNO3), sulfuric acid (H2SO4), or hydrochloric acid (HCl), which are all gaseous substances, they transform into ammonium nitrate (NH4NO3), ammonium sulfate ( (NH4)2SO4), or ammonium chloride (NH4Cl), respectively. These are important components for producing secondary inorganic aerosols (SIAs) (Park et al., 2019; Hsieh and Chen, 2010; Sharma et al., 2009). Such reactions result in reduced visibility and adverse effects on the human body (Kang et al., 2020). Among the particulate matter currently found in South Korea, SIAs account for more than 50% of secondary particulate matter (Kim et al., 2020; Park et al., 2018), whereas NH4NO3 and (NH4)2SO4 account for 35-62% of all secondary particulate matter ( Jordan et al., 2020).
Since NH3 was identified as a major component of SIA formation, studies on the distribution of NH3 in the atmosphere have been conducted worldwide. In the United States of America, NH3 concentrations in various regions of the country have been measured since 2007 using passive samplers that capture NH3 over a long time through the Ammonia Monitoring Network (AMoN) project of the National Atmospheric Deposition Program (NADP) (Zhou et al., 2015). China has also studied the concentration of NH3 in its atmosphere using passive samplers (Pan et al., 2018). Although the passive sampler method has the advantage of being capable of simultaneously measuring NH3 concentrations at various locations, it has the disadvantage of being unable to identify changes in concentration over time. Research on changes in NH3 concentration over time, using real-time NH3 measurement equipment, is being actively conducted (Zhou et al., 2019). This real-time measurement is disadvantageous as it makes it difficult to accurately measure NH3 concentrations due to underestimation resulting from a loss in the inflow tube, attributed to a high NH3 adsorption force (Yi et al., 2021; Bobrutzki et al., 2010). The real-time measurement of black carbon also has disadvantages at low concentration in some cases (Lee, 2019). Research is being actively conducted on these real-time measurements to resolve the underestimation (Pollak et al., 2019; Ellis et al., 2010). However, there is a lack of research on the degree of NH3 adsorption onto the inflow tube and the resultant reduced NH3 concentration when measuring atmospheric NH3 levels.
Therefore, this study aimed to investigate the degree to which NH3 is adsorbed onto inlet tubes using real-time NH3 analysis equipment. Additionally, the degree to which NH3 is adsorbed onto the tube was studied according to moisture, tube length, and heating status after tubes made of different materials were selected, with the ultimate objective of identifying a material that is most suitable for use in actual measurements. Furthermore, the “most suitable” experimental tube identified here is defined as an inlet tube for real-time analysis equipment, to compare the actual atmospheric NH3 concentrations and the NH3 concentrations measured at one-week intervals using NH3 adsorption and collection methods.
2. EXPERIMENT
2. 1 Measurement Site
In this study, a comparison of the properties of NH3 adsorption according to moisture, inlet tube length, inlet tube material, and heating status was carried out at the Natural Science College on the Global Campus at the Hankuk University of Foreign Studies, Cheoin-gu, Yongin-si, Gyeonggi-do, South Korea (37.34°N, 127.27°E). To further identify the differences in NH3 concentrations between real-time analysis equipment and the method of analyzing NH3 after long-term data collection, atmospheric NH3 concentrations were measured from May 19, 2020, to July 12, 2020, and from December 4, 2020, to January 3, 2021, at the Honam Air and Environment Research Institute located in Gwangju, South Korea (35.23°N, 126.85°E). The Honam Air and Environment Research Institute is located northwest of the Gwangju Metropolitan City, with agricultural land near the measuring station and residential complexes concentrated to the south side of the measuring station.
2. 2 Method for Measuring NH3 Adsorption Depending on Moisture and Inlet Sampling Conditions
Real-time NH3 measurements, according to humidity and heating of inlet tubes, were analyzed at intervals of 1 s using the G2103 (Picarro, California, USA), based on the principle of cavity ring-down spectroscopy (CRDS). Standard NH3 gas at a concentration of 1.001 ppm (Rigas, Daejeon, Korea) and purified zero air (Union Gas, Gyeonggi-do, Korea) were diluted to 100 ppb using a mass flow controller (MKP, Gyeonggi-do, Korea) to measure atmospheric NH3 concentrations. Moreover, by installing an additional needle valve and a bubbler in the tube that connects to zero air, the moisture content in the sample can be adjusted, as zero air can contain moisture. All background tubes through which the gases were diluted and passed through were made of PTFE, with an outer diameter of 6.35 mm and valves divided from the background tube to the sample tube (made of Teflon) to minimize NH3 adsorption. To measure the amount of moisture produced through the bubbler, HYGROLOG NT (Rotronic AG, Switzerland), a temperature and moisture meter, were additionally installed in a discharge tube without entering the equipment (see Fig. 1).
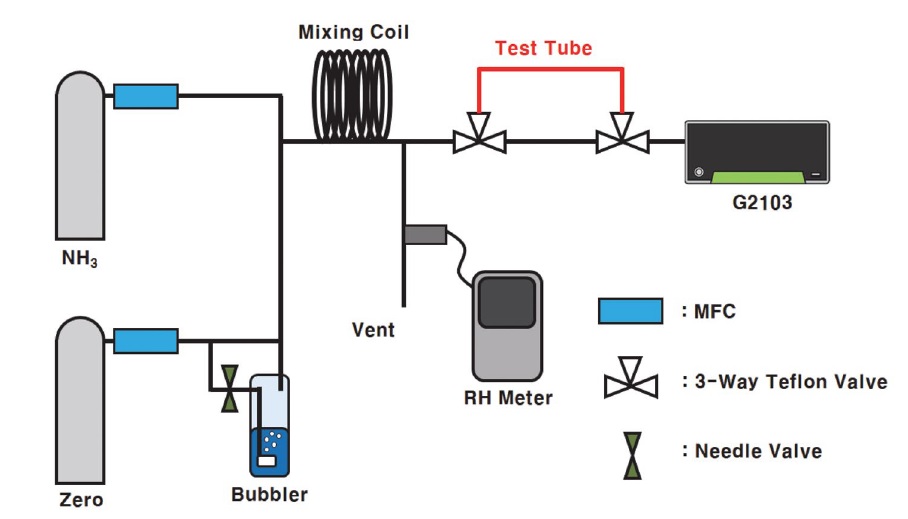
Schematic diagram of NH3 adsorption test. The bubbler flow and composition of the test tube (red line) were changed after each measurement.
The various tube materials used to investigate the degree of NH3 adsorption, according to the material of the inlet tube, were semi-seamless tubes (SUS316L) made out of perfluoroalkoxy (PFA), polytetrafluoroethylene (PTFE), and polyvinylidene fluoride (PVDF) (see Table 1) with an outer diameter of 6.35 mm to minimize the difference due to the tube diameter. Furthermore, a tube made of PTFE (outer diameter: 6.35 mm) was divided into 1, 2, 3, and 4 m lengths to study the degree of NH3 adsorption according to tube length. The relative humidity (i.e., 20, 40, 60, and 80%) of the injected sample was altered to determine the effect of moisture on adsorption (see Table 2). In all experiments conducted in this study, a waiting time of 60 min was spent both before and after the experiment for each tube to stabilize the background tube at a specific injection concentration, temperature, and humidity. Moreover, to keep the experimental tubes as clean as possible, they were cleaned from inside using N2 (Air Korea) for 2 h both before and after use.
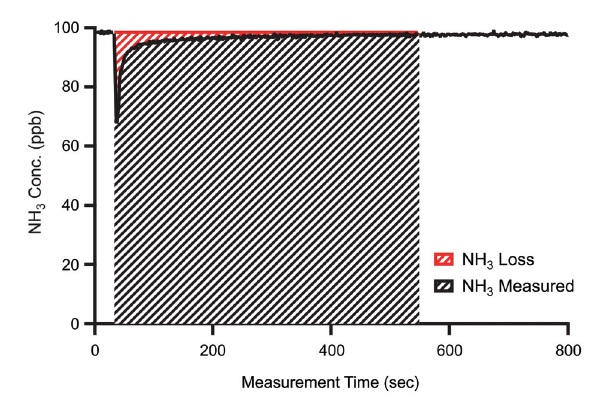
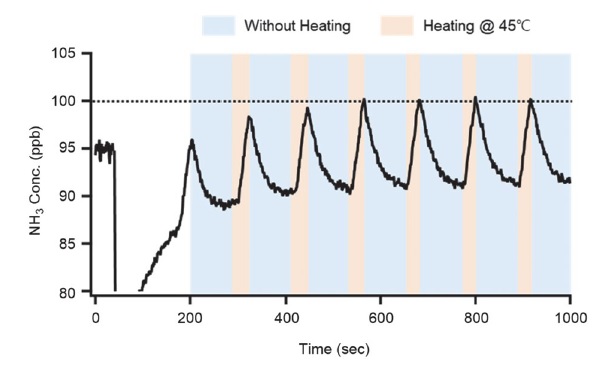
To investigate the adsorptive properties of NH3, the area of adsorption was reduced until NH3 concentrations were reduced after changing NH3 concentrations using the experimental tube, which then returned to its original concentration before the induced change. These data were then used to calculate the ratio of lost NH3, as shown in Fig. 2 (Vaittinen et al., 2014).
2. 3 Measurement of Atmospheric NH3 Using Real-time and Non-real-time Measurement Methods
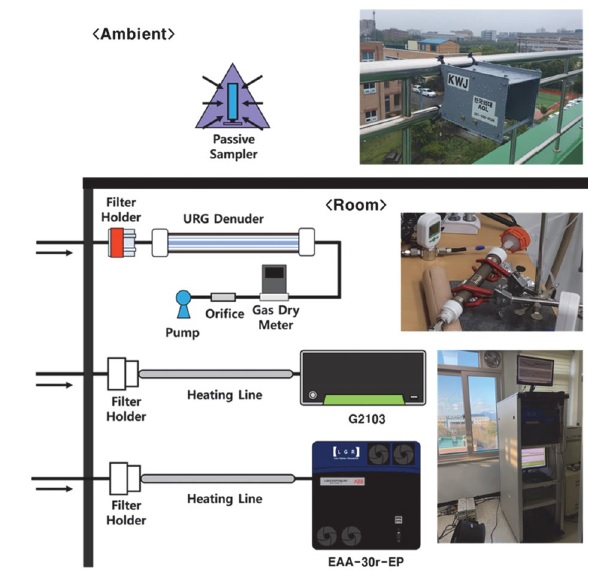
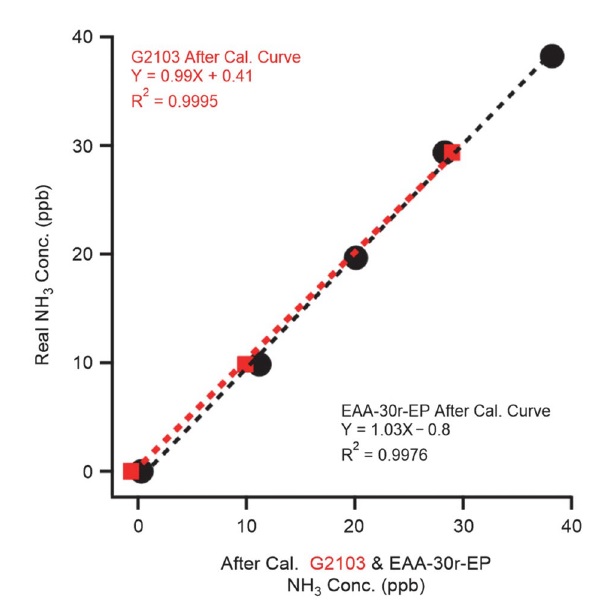
For the measurement of atmospheric NH3 concentrations, real-time analysis was carried out using the EAA-30r-EP (Los Gatos Research, California, USA) from May 2020 to July 2020 and from December 2020 to January 2021; used alongside G2103 in December 2020, the samples from this equipment were collected using annular denuders (URG Corporation, USA) and passive samplers (Radiello, Pavia, Italy) every week during the study period (see Fig. 3). Before measurement, the EAA-30r-EP equipment designed to measure real-time NH3 and the G2103 measurements from December 2020 to January 2021 were calibrated by diluting 1 ppm of standard gas. Because of the characteristics of EAA-30r-EP, it can be calibrated using only one concentration; it was calibrated by injecting 38.23 ppb, followed by sequential injections of 29.36, 19.66, 9.85, and 0 ppb after calibration to ensure the reliability of the measured values at low concentrations, as shown in Fig. 4 (slope: 1.03, intercept: -0.8). Unlike EAA-30r-EP, G2103 can be calibrated using various concentrations; G2103 was calibrated using 38.23, 29.36, 19.66, 9.85, and 0 ppb injections into the EAA-30r-EP, followed by 29.36, 9.85, and 0 ppb reinjections after calibration, to ensure reliability even at low concentrations (slope: 0.99, intercept: 0.41).
The passive sampler collected samples every week, using 10 mL of ultrapure water (DI water) for elution, after which the NH4+ concentration was measured using Dionex Aquion (Thermo Fisher Scientific, USA) equipment. Dionex Aquion utilizes ion chromatography through a 20 mM mobile phase of CH3SO3H, a CS12A column, and a guard column of CG12A. The concentration of atmospheric NH3 was calculated using Eq. 1.
| (1) |
where DNH3 is the diffusivity of NH3 in the atmosphere, calculated using the D0.1=0.1978 cm2 s-1 when the temperature (T) and pressure (P) at the time of measurement are 0°C and 1 atm, respectively (Massman et al., 1998). The adsorption flow rate (QNH3) in the passive sampler was calculated using Eq. 2.
| (2) |
where A is the cross-sectional adsorption area available to the passive sample, and ΔX is the diffusion distance of the sampler. According to a previous study (Puchalski et al., 2011), A/ΔX values of the NH3 passive sampler of Radiello used in this study were reported to be 14.2 cm. QNH3 was used to calculate the concentration of atmospheric NH3 (CNH3, passive), and the mass of NH3 (mNH3) calculated by ion chromatography (IC) using Eq. 3 is as follows:
| (3) |
Samples were collected every alternate week using an annual denuder and phosphorous acid; a capture material, such as a passive sampler was dissolved in methanol to coat the denuder. They were extracted using 10 mL of ultrapure liquid and analyzed using the same method as that of a passive sampler, and the concentration of NH4+ in the atmosphere (CNH3, denuder) was calculated using Eq. 4:
| (4) |
where 0.945 is the ratio of the weights of NH3 and NH4+, cNH4+ is the concentration of NH4+ measured by ion chromatography (in μg m-3), Vext is the amount of ultrapure liquid used for the denuder extraction (in L), and Vact. air is the amount of sample collected from the atmosphere (L).
3. RESULTS
3. 1 NH3 Adsorption Depending on Moisture and Inlet Conditions
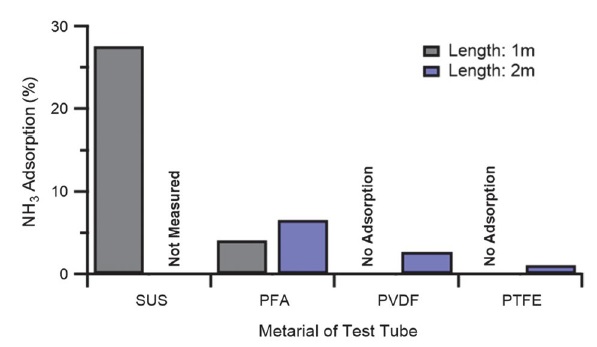
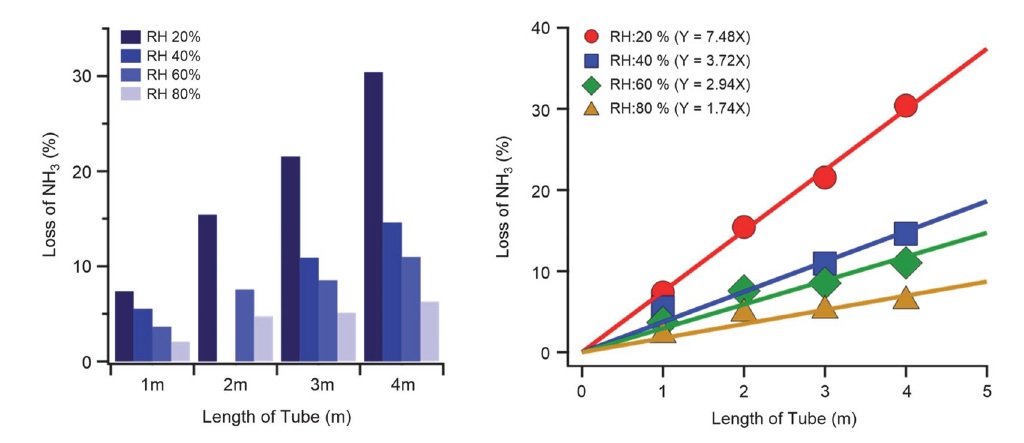
Upon comparing the degree of adsorption according to the different tube materials, the concentration of NH3 absorbed by SUS was the highest (27.53%) when a 1 m tube was used without moisture, followed by PFA at approximately 4.08% (see Fig. 5); PVDF and PTFE did not show NH3 adsorption. In the 2 m experimental tube, the SUS tube was excluded because it showed the highest adsorption; the adsorption onto other materials was in the descending order of PFA (approximately 6.56%), PVDF (approximately 2.67%), and PTFE (approximately 1.03%). Based on these results, the PTFE tube was found to have the lowest degree of NH3 adsorption; thus, further experiments in this study on humidity, length, and inlet tube heating using a PTFE tube need to be conducted.
The concentration of NH3, according to the humidity divided by the length of the PTFE tube, was stabilized at 100 ppb for a similar time. The adsorption ratio of all the tubes measured was very low, that is, 1%. The differences in concentration reduction were due to the moisture influencing the NH3 concentration, which momentarily dropped immediately after NH3 was injected (see Fig. 6). It was judged that regardless of the length, the degree of instantaneous adsorption of NH3 decreased with increasing moisture. It was found that moisture reduces the adsorption of NH3 at an appropriate humidity level (Vaittinen et al., 2018). It was confirmed that NH3 adsorption at high moisture could be measured more accurately through real-time measurements of the general air quality. However, as the length of the tube increased, the degree of NH3 adsorption increased. The decrease in NH3 concentration according to the length was found to be 1.74% m-1 at 80% moisture, 2.94% m-1 at 60% moisture, 3.72% m-1 at 40% moisture, and 7.48% m-1 at 20% moisture. Thus, it was concluded that the length of the inlet tube affected the real-time NH3 concentration measurements, especially in areas with low moisture.
Fig. 7 shows the change in the concentration measured when the heating was repeatedly turned off and on in the experimental tube to investigate whether there is a difference in NH3 adsorption and if the inlet tube is heated or not. Neuman (1999) reported that the adsorption of HNO3 in the sampling tube, which is similar to the chemical properties of NH3 (sticky molecules), was not observed when the tube temperature was higher than 30°C. In this test, 45°C was chosen because the box and cavity temperatures of G2103 are usually 45°C. When 100 ppb NH3 was injected into the experimental tube, it was measured to be 90.96 ppb without heating. However, it rapidly increased to 100.31 ppb during heating. Thus, the concentration of NH3 adsorbed to the experimental tube increased as the degree of adsorption in the tube was reduced by heating compared to that without heating.
3. 2 Measurement of Atmospheric NH3 Using Real-time and Non-real-time Measurement Methods
Real-time NH3, measured using EAA-30r-EP and G2103 from May 19, 2020, to July 12, 2020, at the Honam Air and Environment Research Institute, was prepared by manufacturing a PVDF tube, conventionally announcing it to have the lowest adsorption of NH3 (Vaittinen et al., 2018). The length of the inlet tube was 2 m, and the tube was heated to 45°C. At that time, EAA-30r-EP and G2103 were calibrated using different calibration devices and gases. Before June 5, measurements were performed with the heater of the inlet tube of EAA-30r-EP turned off to confirm the difference in ammonia concentration measured when the inlet tube was not heated and when it was heated. For EAA-30r-EP and G2103, NH3 measurements were performed between December 5, 2020, and January 3, 2021, and these were manufactured using PTFE inlet tubes, that is, those measured to have the lowest degree of adsorption in section “3.1 NH3 adsorptions depending on moisture and inlet tube conditions” Furthermore, measurements were performed after simultaneous calibration using the same calibration device and calibration gas.
From May 19, 2020, to July 12, 2020, the average concentration of NH3 measured using the EAA-30r-EP real-time measuring equipment was 10.09 ppb (±6.74 ppb) and that by using the G2103 equipment was 16.11 ppb (±6.82 ppb). The passive sampler measured data every week during the same period. The average value was 10.74 ppb (±3.84 ppb); the annual denuder averaged 11.41 ppb (±4.06 ppb). The average concentration of NH3, measured from December 5, 2020, to January 3, 2021, was 9.54 ppb (±6.98 ppb) for the EAA-30r-EP, 9.46 ppb (±7.16 ppb) for the G2103, 8.4 ppb (±2.95 ppb) for the passive sampler, and 5.74 ppb (±0.29 ppb) for annual denuder (see Fig. 8). The standard deviation of the passive sampler and annual denuder was lower than that of real-time analysis equipment because the concentrations calculated from the sample collected for one week cannot be reflected in the change in NH3 concentration, which changes in real-time within a certain range. For the annual denuder, samples were collected every alternate week. Hence, the concentration was lower than that measured by the passive sampler every week and other real-time measurement equipment.
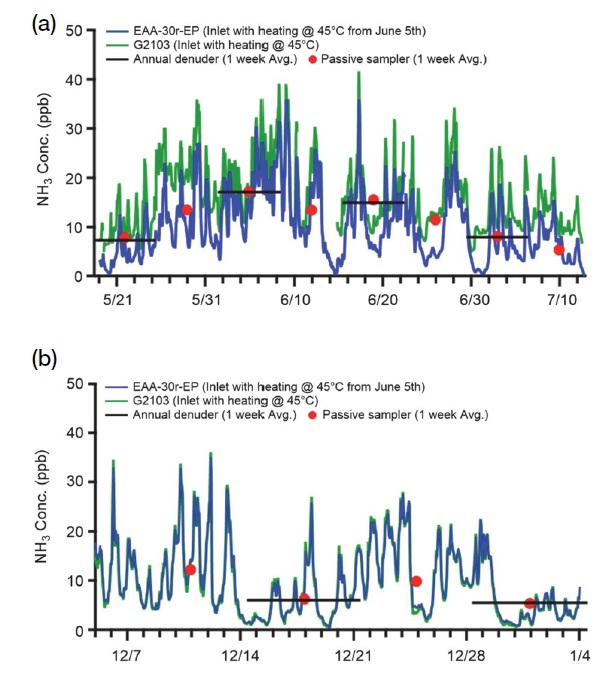
Timeline of NH3 measurement of ambient in Gwang-ju from (a) May 2020 to July 2020. The EAA-30r-EP inlet was not heated from May 5 to June 5, and the two instruments were calibrated separately. (b) Measurement between December 2020 and January 2021 after completing calibration by the same system.
Fig. 9 shows the correlation between the analysis methods both in real-time and non-real-time during the same period. To minimize the change in concentration due to temperature differences over time, the results of real-time NH3 concentration were averaged to 1 h data and then converted from ppb into μg m-3 using atmospheric temperature and pressure measurements by the Honam Air and Environment Research Institute. Fig. 9 a is based on comparisons between the two types of real-time measuring equipment used between May and July 2020; the EAA-30r-EP, without heating the inlet tube, was approximately 39% lower than G2103 with a heated inlet tube. When EAA-30r-EP is heated, it measures approximately 29% lower than G2103; a 10% reduction in the difference was observed based on whether the inlet tube was heated or not, indicating that heating the inlet tube during the real-time measurement is necessary. Moreover, based on comparisons of NH3 concentrations measured in real-time using different calibration devices and gases, the coefficient of determination was found to be 0.94, indicating dispersed correlation when inlet tubes were used under similar conditions. To investigate whether the dispersed correlation resulted from using other equipment for measurements between December 2020 and January 2021, the aforementioned real-time measurement devices were calibrated using the same calibration device and gas (Fig. 9, b). EAA-30r-EP was found to be 0.5% lower than that of G2103, and the coefficient of determination was 0.99, that is, a very high correlation. It has been confirmed that the calibration method and the heating of the inlet tube are very important for real-time NH3 measurements. Fig. 9, c shows that the annual denuder collecting data biweekly for one week was 2% higher than the passive sampler collecting NH3 during the same period. The coefficient of determination was calculated to be 0.996, showing a very high correlation between the two non-real-time NH3 measurements. Based on the comparisons and analysis of the NH3 concentration measured by the passive sampler collected every week during the measurement period and real-time equipment with a heated inlet tube ( June 5, 2020, to July 12, 2020, and December 5, 2020, to January 3, 2021) (see Fig. 9, d), the concentration of NH3 measured using real-time equipment and non-real-time measurement methods was correlated at 0.98, with a difference of 7%.
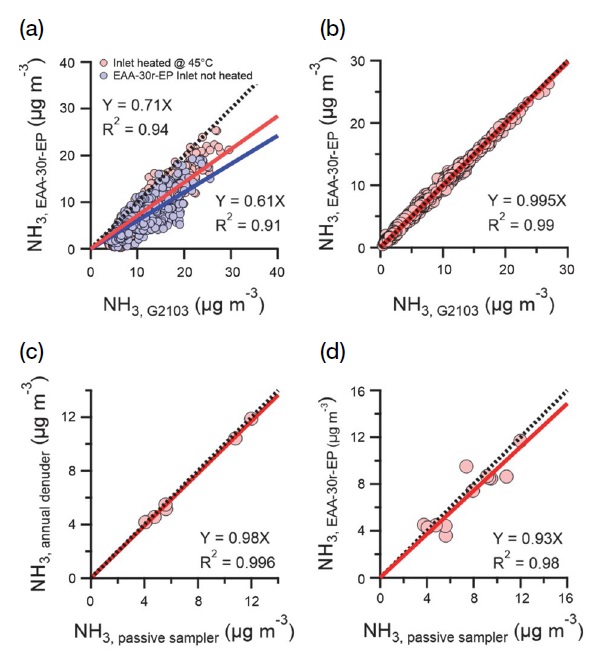
Comparison of various types of NH3 measurement. (a) Comparison of real-time NH3 measurement by heating or not heating the inlet (May 2020-July 2020). (b) Comparison of two types of real-time NH3 measuring instruments (December 2020-January 2021). (c) Comparison of annual denuder with a passive sampler (May 2020-July 2020 and December 2020-January 2021), and (d) Comparison of real-time measurements with the passive sampler ( June 2020-July 2020 and December 2020-January 2021).
4. CONCLUSIONS
This study evaluated NH3 adsorption in inlet tubes used in real-time NH3 measurements according to the material, length, humidity, and heating of the inlet tube. Furthermore, atmospheric NH3 was measured using the inlet tube with the lowest adsorption. It was compared and analyzed with the concentration measured in the passive sampler and annual denuder, non-real-time measurement methods. The materials used to make tubes for the inlet tube experiment were SUS316L, PFA, PTFE, and PVDF; the injection concentration of NH3 was stabilized at 100 ppb. The absorption rate of NH3 in the PTFE tube was measured to be the lowest (i.e., 1.03%) at 2 m when using the PTFE tube. Based on these results, the NH3 adsorption, according to length and moisture, measured using the PTFE tube was the lowest, the relative humidity increased from 20% to 80%, and the degree of instantaneous adsorption decreased from 7.48 ppb m-1 to 1.74 ppb m-1; indicating that the moisture reduces NH3 adsorption to the inlet tube. Furthermore, the degree of adsorption to the tube was reduced when the experimental tube was heated. It was proven to be more effective at low humidity.
From May 2020 to July 2020 and December 2021 to January 2021, atmospheric NH3 was measured using real-time techniques and non-real-time measurement methods at the Honam Air and Environment Research Institute. The results indicated that the average concentrations of NH3 measured with real-time equipment EAA-30r-EP were 10.09 ppb and 9.54 ppb for both study periods, respectively. The concentrations measured with G2103 were 16.11 ppb and 9.46 ppb, respectively. The average concentration from the passive sampler, a non-real-time measuring instrument, was 10.74 ppb and 8.4 ppb, respectively. When comparing the two methods, the real-time methods, EAA-30r-EP, and G2103 showed a concentration difference of 0.5%. The non-real-time measurement method using the annual denuder passive sampler, showed a difference of 2%.
Moreover, the NH3 concentration was approximately 10% lower when the inlet tube of the real-time equipment was not heated. It was also confirmed that there is a difference in concentration according to the calibration device and gas. Overall, real-time NH3 measurement can minimize the lack of NH3 measurement using an inlet tube made of PTFE, a material that can be heated. It is important to provide uniformity to the calibration method, and the calibration gas used when measuring the NH3 concentration in real-time at various places or times.
Acknowledgments
This study was funded by the National Institute of Environmental Research (NIER-2020-04-02-041), and additional data processing was supported by the Hankuk University of Foreign Studies Research Fund (20211172001) and the Ministry of Education of the Republic of Korea and the National Research Foundation of Korea (NRF-2019S1A6A3A02058027).
DISCLAIMER
All the results in this study were obtained by setting the parameters for the passive sampler and denuder, according to the referenced literature.
References
-
Ellis, R., Murphy, J., Pattey, E., Haarlem, R.V., O’Brien, J., Herndon, S. (2010) Characterizing a quantum cascade tunable infrared laser differential absorption spectrometer (QC-TILDAS) for measurements of atmospheric ammonia. Atmospheric Measurement Techniques, 3(2), 397-406.
[https://doi.org/10.5194/amt-3-397-2010]

-
Hsieh, L.-T., Chen, T.-C. (2010) Characteristics of ambient ammonia levels measured in three different industrial parks in southern Taiwan. Aerosol and Air Quality Research, 10(6), 596-608.
[https://doi.org/10.4209/aaqr.2010.06.0044]

-
Jordan, C.E., Crawford, J.H., Beyersdorf, A.J., Eck, T.F., Halliday, H.S., Nault, B.A., Chang, L.-S., Park, J., Park, R., Lee, G. (2020) Investigation of factors controlling PM2.5 variability across the South Korean Peninsula during KORUS-AQ. Elementa: Science of the Anthropocene, 8.
[https://doi.org/10.1525/elementa.424]

-
Junsu, P., Jaeyoun, R., Joonbum, J., Song, M. (2020) Origins and Distributions of Atmospheric Ammonia in Jeonju during 2019~2020. Journal of Korean Society for Atmospheric Environment, 36(2), 262-274, (in Korean with English abstract).
[https://doi.org/10.5572/KOSAE.2020.36.2.262.]

-
Kang, S., Park, G., Park, T., Ban, J., Kim, K., Seo, Y., Choi, J., Seo, S., Choi, J., Bae, M.-S. (2020) Semi-continuous Measurements of Water-soluble Organic Carbon and Ionic Composition of PM2.5 in Baengnyeong Island during the 2016 KORUS-AQ (Korea-United States Air Quality Study). Asian Journal of Atmospheric Environment, 14(3).
[https://doi.org/10.5572/ajae.2020.14.3.307]

-
Kim, N., Yum, S.S., Park, M., Park, J.S., Shin, H.J., Ahn, J.Y. (2020) Hygroscopicity of urban aerosols and its link to size-resolved chemical composition during spring and summer in Seoul, Korea. Atmospheric Chemistry and Physics, 20(19), 11245-11262.
[https://doi.org/10.5194/acp-20-11245-2020]

-
Lee, J. (2019) Performance test of microaeth® AE51 at concentrations lower than 2 μg/m3 in indoor laboratory. Applied Sciences, 9(13), 2766.
[https://doi.org/10.3390/app9132766]

-
Li, Y., Thompson, T.M., Damme, M.V., Chen, X., Benedict, K.B., Shao, Y., Day, D., Boris, A., Sullivan, A.P., Ham, J. (2017) Temporal and spatial variability of ammonia in urban and agricultural regions of northern Colorado, United States. Atmospheric Chemistry and Physics, 17(10), 6197-6213.
[https://doi.org/10.5194/acp-17-6197-2017]

-
Massman, W. (1998) A review of the molecular diffusivities of H2O, CO2, CH4, CO, O3, SO2, NH3, N2O, NO, and NO2 in air, O2 and N2 near STP. Atmospheric Environment, 32(6), 1111-1127.
[https://doi.org/10.1016/S1352-2310(97)00391-9]

-
Neuman, J.A., Huey, L.G., Ryerson, T.B., Fahey, D.W. (1999) Study of Inlet Materials for Sampling Atmospheric Nitric Acid. Environmental Science & Technology, 33, 1133-1136.
[https://doi.org/10.1021/es980767f]

-
Pan, Y., Tian, S., Zhao, Y., Zhang, L., Zhu, X., Gao, J., Huang, W., Zhou, Y., Song, Y., Zhang, Q. (2018) Identifying ammonia hotspots in China using a national observation network. Environmental Science & Technology, 52(7), 3926-3934.
[https://doi.org/10.1021/acs.est.7b05235]

-
Park, G., Kim, K., Kang, S., Park, T., Ban, J., Lee, T. (2019) The Chemical Characteristics and Formation of Potential Secondary Aerosol (PSA) using an Oxidation Flow Reactor (OFR) in the Summer: Focus on the Residential Area, Suwon. Journal of Korean Society for Atmospheric Environment, 35(6), 786-801, (in Korean with English abstract).
[https://doi.org/10.5572/KOSAE.2019.35.6.786]

-
Park, T., Ban, J., Kang, S., Ghim, Y.S., Shin, H.-J., Park, J.S., Park, S.M., Moon, K.J., Lim, Y.-J., Lee, M.-D., Lee, S.-B., Kim, J., Kim, S.T., Bae, C.H., Lee, Y., Lee, T. (2018) Chemical Characteristics of PM1 using Aerosol Mass Spectrometer at Baengnyeong Island and Seoul Metropolitan Area. Journal of Korean Society for Atmospheric Environment, 34(3), 430-446, (in Korean with English abstract).
[https://doi.org/10.5572/KOSAE.2018.34.3.430]

-
Paulot, F., Jacob, D.J., Pinder, R., Bash, J., Travis, K., Henze, D. (2014) Ammonia emissions in the United States, European Union, and China derived by high-resolution inversion of ammonium wet deposition data: Interpretation with a new agricultural emissions inventory (MASAGE_NH3). Journal of Geophysical Research: Atmospheres, 119(7), 4343-4364.
[https://doi.org/10.1002/2013JD021130]

-
Pollack, I.B., Lindaas, J., Roscioli, J.R., Agnese, M., Permar, W., Hu, L., Fischer, E.V. (2019) Evaluation of ambient ammonia measurements from a research aircraft using a closed-path QC-TILDAS operated with active continuous passivation. Atmospheric Measurement Techniques, 12(7), 3717-3742.
[https://doi.org/10.5194/amt-12-3717-2019]

-
Sharma, S.K., Datta, A., Saud, T., Saxena, M., Mandal, T., Ahammed, Y., Arya, B. (2010) Seasonal variability of ambient NH3, NO, NO2 and SO2 over Delhi. Journal of Environmental Sciences, 22(7), 1023-1028.
[https://doi.org/10.1016/S1001-0742(09)60213-8]

-
Bobrutzki, K., Braban, C., Famulari, D., Jones, S., Blackall, T., Smith, T., Blom, M., Coe, H., Gallagher, M., Ghalaieny, M. (2010) Field inter-comparison of eleven atmospheric ammonia measurement techniques. Atmospheric Measurement Techniques, 3, 91-112.
[https://doi.org/10.5194/amt-3-91-2010]

-
Yi, X., Zhang, Z., Smith, P. (2021) Real-time measurements of landfill atmospheric ammonia using mobile white cell differential optical absorption spectroscopy system and engineering applications. Journal of the Air & Waste Management Association, 71(1), 34-45.
[https://doi.org/10.1080/10962247.2020.1820405]

-
Zhou, C., Zhou, H., Holsen, T.M., Hopke, P.K., Edgerton, E.S., Schwab, J.J. (2019) Ambient ammonia concentrations across New York state. Journal of Geophysical Research: Atmospheres, 124(14), 8287-8302.
[https://doi.org/10.1029/2019JD030380]

-
Zhu, L., Henze, D.K., Bash, J.O., Cady-Pereira, K.E., Shephard, M.W., Luo, M., Capps, S.L. (2015) Sources and impacts of atmospheric NH 3: current understanding and frontiers for modeling, measurements, and remote sensing in North America. Current Pollution Reports, 1(2), 95-116.
[https://doi.org/10.1007/s40726-015-0010-4]


