Wind and Gust Forecasts Assessment of Weather Research and Forecast (WRF) Model in Córdoba, Argentina
 ; Denis Poffo2), 3), 4)
 ; Edgardo Pierobon3), 4) ; Agustín Martina3), 4)
 ; Jorge Saffe3), 4) ; Andrés Rodríguez1), 3), 4)
Copyright © 2022 by Asian Association for Atmospheric Environment
This is an open-access article distributed under the terms of the Creative Commons Attribution Non-Commercial License (http://creativecommons.org/licenses/by-nc/4.0/), which permits unrestricted non-commercial use, distribution, and reproduction in any medium, provided the original work is properly cited.
Abstract
WRF wind forecasts from four operative schemes used by OHMC (Observatorio HidroMeteorológico de Córdoba), a test scheme (WRF-E) and two daily runs with 4 km horizontal resolution were analyzed. Wind simulations were compared with measurements from eight ground stations with anemometers at 10 m high during the period from June, 2019 to June, 2020. WRF-E incorporates more vertical levels, and an activated topo_wind option. The wind speed results show that WRF overestimates wind speed at most stations and the WRF-E model reduces the BIAS and the RMSE when compared with the operational models. The wind direction analysis shows that the higher the wind speed is, the more accurate the models are. In addition, a wind gust forecasting has been implemented and evaluated in this work. Wind gust correlation coefficient values are between 0.3 and 0.6, RMSE is between 3 and 5 m/s, and a positive BIAS (<2 m/s) at most stations.
Keywords:
WRF model, Wind speed, Wind gust, Wind direction, Topo wind, Weather forecast1. INTRODUCTION
Extreme hydrometeorological phenomena which take place on our planet result in great human loss and important damage in infrastructure and personal properties, which implies economic setbacks that may last for a long time (Bronstert et al., 2018; Manuel-Navarrete, 2007). To lessen this impact, international institutions use global climatic models such as GFS (Global Forecast System), ECMWF (European Centre for Medium-Range Weather Forecasts), ICON (Icosahedral Non-Hydrostatic), and JMA (Global weather forecast model from the “Japan Meteorological Agency”) as input for models of limited area (LAM). These high-resolution models, which are used for short term forecasting, have the advantage of being more precise in the reproduction of small-scale phenomena. In fact, LAM description of the passage of cold fronts, convective cells, and the orographic influence are better than the description provided by the global models (Politi et al., 2018).
Since Argentina extends from latitude 21°46′52″S to 55°03′21″S, it is affected by a wide variety of weather phenomena (Le Favi, 2020). In particular the province of Córdoba is an inland province with a complex orographic system which causes extreme weather conditions. It is important to stress that these meteorological phenomena, which have a variety of space-time scales, are frequent hazards in the province. The study of these events gave rise to several research works including project RELAMPAGO campaign carried out recently in Córdoba (Casanovas et al., 2021; Schumacher et al., 2021; Singh et al., 2019). This context led to the creation of the Hydrometeorologial Observatory of the Province of Córdoba (OHMC) in March, 2017. OHMC is an institution which provides early warning services by means of several products obtained through satellite information, automatic weather stations, and weather radar data. The latter are provided by SINARAME (National System of Weather Radars). Additionally, OHMC runs a numerical model called WRF-OHMC (Weather Research and Forecast). The products mentioned before are published and updated daily at a specific website (https://ohmc.ar/, last accessed on October 14th, 2021). The information is provided by graphs, maps, weather charts and tables. The WRF-OHMC model renders meteorological information at regional level, which is used by different governmental and private organizations. This model has two daily runs (06 and 18 UTC) that provide four forecasts labeled WRF-A, WRF-B, WRF-C and WRF-D. The meteorological information includes hourly precipitation, accumulated precipitation, temperature, atmospheric pressure, wind speed, and wind direction.
Information obtained from LAMs models such as WRF is useful to study the energetic behavior of wind farms (Jacondino et al., 2021; Prosper et al., 2019; Wang et al., 2019), their optimal placement (Feroz et al., 2021; Dhunny et al., 2020), and as a tool for wind resource assessment. Additionally, the information allows collaboration with local or regional institutions for emergency management such as forest fires, flooding, and strong winds (Patel et al., 2019; Rodriguez et al., 2018).
This work presents a statistical analysis of the wind variable from the four operative forecasts of the WRF-OHMC model using data from eight automatic weather stations (AWS) distributed throughout the province of Córdoba. Results of this analysis will be of vital importance for wind risk management in Córdoba.
The used database includes information about wind speed and direction from June 1, 2019 to June 1, 2020. In this work, WRF assessment will be carried out for measured wind speed and wind gust greater than 2.77 m/s or 10 km/h since slower winds are not considered relevant by the civil defense authorities and wind risk management of Córdoba.
This paper also analyses the performance of a new forecast scheme, WRF-E, which includes more vertical levels than previous ones, and a better representation of the roughness of the terrain and it analyses a new product used to determine wind gusts.
2. STUDY REGION AND WRF-OHMC MODEL
2. 1 Study Region
In this work the study region is the province of Córdoba, located in the center of Argentina, with a surface area of 165,321 km2, is a large territory with plains, mountain ranges and valleys, which gives the province a unique landscape identity. The East of the province consists of an extensive plain with a gently slope down towards the East. Over the West, there are three mountain ranges known as Sierras de Córdoba. The easternmost range (Sierras Chicas) starts at about 20 km west of the city of Córdoba with altitudes ranging from around 1,000 m in the south end to 1,950 m at Cerro Uritorco. To the west of this chain, there are two important valleys: the Calamuchita valley to the south, and the Punilla Valley to the north. Both valleys are economically important because of the tourist industry. The next mountain range to the west includes the Champaqui Hill (2,880 m), which is the highest mountain in the province.
The climate of Córdoba is temperate and subtropical with a marked dry season. Temperatures, as well as rainfall, decrease from North to South and from East to West, except in the eastern slopes of the mountains, where the humid winds from the East deposit more rain. In this area, the regime is 1,100-1,300 mm per year. Precipitation has a seasonal character, mainly between October and April, and the provincial average is close to 800 mm per year.
Temperatures usually oscillate between 8°C and 30°C. Summer in Córdoba is generally warm. Average maximums are around 30°C, although there are peaks that can reach 40°C. In January, the warmest month, the average maximum is 31°C and the minimum is 17°C. Winter is mild and quite dry. The average temperature is around 10-12°C with maximum temperatures around 18°C, and minimum temperatures between 4 and 5°C. Another characteristic of winter is the occurrence of snowfalls in the highest locations of the province.
Electrical storms frequently occur throughout the province in the spring and summer months, especially in the area of highest mountains of the Sierras de Córdoba. The east province area has a higher frequency of storms, some of which can be severe. Hail is also a fairly common phenomenon in the province.
In this region, the prevailing winds, which come from the North and Northeast, are associated with advection of warm and humid air in spring and summer. Winds from the South and South West are associated with the passage of cold fronts, and the entry of cold and dry air masses to the province. Winds from the east and west are infrequent, short and relatively weak.
2. 2 Description of the WRF Model and Domain
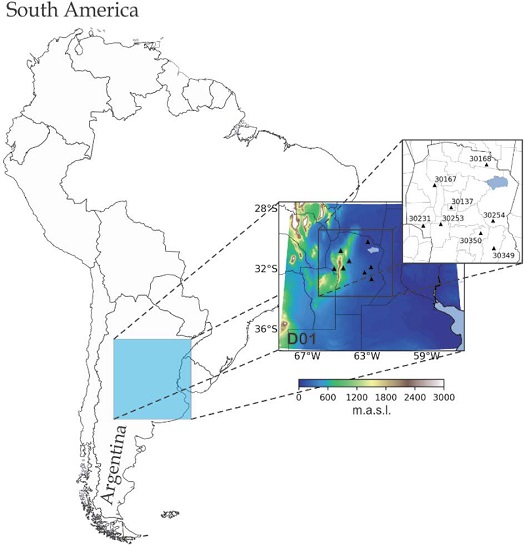
Numerical simulations were performed using WRF model (Skamarock et al., 2019), version 4.1.1. Initial and boundary conditions are supplied by data from the Global Forecast System (GFS) with a horizontal resolution of 0.25°. Several numerical experiments were conducted using different parameterization schemes (WRF-A, WRF-B, WRF-C, WRF-D, WRF-E). WRF model domain consists of 270×270 grid points with a 4 km horizontal resolution. Table 1 shows the physical configurations of WRF-OHMC used in this work. Fig. 1 shows WRF domain D01 (physical map at middle), Córdoba topography and AWS locations used in this paper (upper right square). This figure shows a plain on the east, and a region with a complex topography on the west with mountains along the south-north direction.
2. 3 Database
Wind speed forecasts at 10 m height from five models were used. The dataset used span the period between June 1, 2019 and June 1, 2020. Simulations were performed during 33 hours beginning at 06 and 18 UTC every day. The first 9 hours were discarded because of the model spin up time, and then the subsequent 24 hours were considered. WRF-E simulations were performed only for 06 UTC run due to limited storage resources.
In this work, eight automatic weather stations (AWS) were used:
- • 30253 - Los Reartes
- • 30350 - Arroyo Algodon
- • 30349 - Bell Ville
- • 30167 - Cruz del Eje
- • 30168 - La Rinconada
- • 30137 - Laboratorio de Hidraulica
- • 30254 - Las Varillas
- • 30231 - Villa Dolores
These AWS are capable of measuring wind speed, wind gusts and wind direction at 10 m above ground level with a frequency of one measurement each 10 minutes. Wind direction is measured with a resolution of 22.5°.
It is important to remark that stations 30350 and 30349 (Arroyo Algodon and Bell Ville) have data from March 5, 2020 to June 1, 2020.
2. 4 Filters Applied to Database
Since low wind intensity are not considered relevant by the wind risk management of Córdoba, winds below 2.77 m/s (10 km/h) were removed and were not included in the analysis.
In order to detect and remove repeated wind direction measurements during long intervals, a filter was applied to the dataset. Through this filter we were able to detect unusual measurements in some stations. The affected AWS were Laboratorio de Hidraulica (30137) and Las Varillas (30254) where the reported wind direction remained constant (90°) for a couple of months, probably as a result of wind vanes malfunctioning. On the other hand, since the stations measure wind direction with a resolution of 22.5°, it is necessary to adapt the WRF wind direction forecast to this coarse resolution, which was carried out by considering intervals of ±11.25° around the values that the stations can measure. Then, each of the WRF wind direction forecasted value within one of the intervals is associated to the value that the station measures within that interval.
3. STATISTICAL METRICS FOR WIND FORECASTS VALIDATION AND WIND GUST PARAMETERIZATION
A particular value of wind velocity depends on two variables: wind intensity and wind direction. WRF model calculates wind velocity forecast in each grid point. Each point has an associated area of 16 km2, and a variable h that changes with elevation.
Components U and V are used to specify the wind velocity at any given location of latitude (i), longitude (j) and height (k). U and V are associated with directions x (west-east direction), and y (south-north direction) respectively. To determine wind direction for each time step t, from the velocity components U and V, the fourquadrant inverse tangent function is used. In turn, wind speed Wijk in a grid point (i, j, k) is given by Eq. (1) (Dzebre et al., 2019).
| (1) |
In this work, WRF forecasts at 10 m above ground were used. At present, the WRF-OHMC uses a set of levels that covers most of the weather active atmosphere (see Table 2).
3. 1 Statistical Metrics for Wind Speed and Wind Gust Validation
Hourly forecasted wind speeds at 10 m above ground (U10, V10) were compared with hourly AWS data measured at 10 m above ground. The forecasts from different parameterization schemes and measured data were analyzed by using several statistical metrics. This procedure allows the assessment of the WRF model for the forecast of both wind speed and wind direction. The statistical coefficients are the following:
- • Root Mean Square Error (RMSE),
- • BIAS,
- • Pearson Correlation Coefficient (CC)
RMSE represents the difference between forecasted and measured data, and is given by:
| (2) |
where Δwi=Wsim,i-Wobs,i are the difference between simulated and observed wind speed and N is the number of data. BIAS is another measure of error, which allows one to determine if the model overestimates or underestimates measured wind speed. BIAS is defined by the following equation:
| (3) |
The linear dependency between forecasted and measured data was assessed using Pearson Correlation Coefficient (CC). It is defined as:
| (4) |
where variables with over bar indicate average value.
3. 2 Statistical Metrics for Wind Direction Validation
Hourly forecasted wind direction at 10 m above ground were compared with the measured wind direction at 10 m above ground level. In order to make these comparisons, the already defined RMSE and BIAS through Eq. (2) and (3) respectively were used, although in this case, the variable Δθ must be used instead. Δθ is defined by (Dzebre et al., 2019):
| (5) |
where θsim , θobs are the simulated and observed wind direction respectively. Eq. (5) assigns a positive/negative difference if the wind direction given by WRF is rotated clockwise/anticlockwise with respect to the direction measured by the AWS. Δθ ranges from -180° to 180°.
3. 3 WRF-E Forecast Model
This work proposes a new scheme oriented to improve wind speed forecasting (See Table 3). This scheme is based on a sensitivity study carried out in Andalusia, Spain (Santos-Alamillos et al., 2013). In that study, 32 parameterization schemes were analyzed with different choices of microphysics, cumulus, planetary boundary layer, shortwave, and longwave radiation. Their conclusion was used to determine the physical configuration of the WRF-E model. Furthermore, the number of vertical levels of WRF-E was increased from 34 to 50. The new levels were distributed in order to increase the model resolution near ground. Ten levels were added to the first 100 meters of height, and three levels were added between 100 and 200 meters (See Table 4). In addition, to reduce the high wind BIAS seen in WRF, the option topo_wind=1 was enabled. This option is based on the concept of a momentum sink term, which makes use of the standard deviation of the subgrid scale orography as well as the Laplacian of the topographic field (Jiménez, 2012).
3. 4 Wind Gust Parameterization
An important objective of this paper is the implementation and evaluation of a wind gust forecast WG. Eq. (6) will be used to perform this calculation. This equation was utilized in the former NOAA RUC20 (Rapid Update Cycle) of Post-Processing Diagnosed Variables (Benjamin et al., 2002).
| (6) |
where v10 is the simulated wind speed at 10 m above ground level, vPBL is the simulated wind speed at the top of the planetary boundary layer, and hPBL is the height of this layer in meters. According to RUC20 documentation (Benjamin et al., 2020), hPBL in Eq. (6) is equal to 1,000 m for any height greater than 1,000 m.
4. RESULTS AND DISCUSSION
4. 1 Wind Speed WRF-OHMC Operative and WRF-E
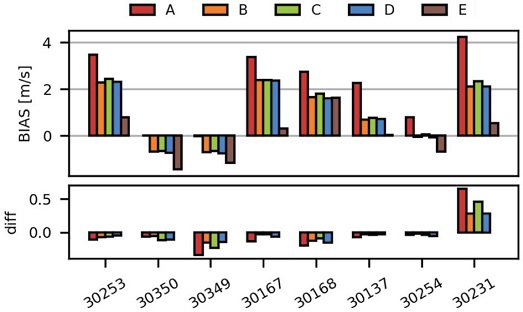
Preliminary statistical performance analysis of the operational forecasts of WRF-OHMC and the new model WRF-E can be seen in Figs. 2, 3, and 4. These figures show the statistical measures CC, RMSE and BIAS calculated at 06 UTC from section 3 for each AWS represented by their numerical code in the abscissa. The color coded bars A to E correspond to the five WRF models (WRF-A, WRF-B, WRF-C, WRF-D and WRF-E). The lower panel in these figures represents the difference between runs at 06 UTC and at 18 UTC. The top panel in Fig. 2 shows that the operative forecasting WRF models have a similar behavior for each AWS. Likewise, the bottom panel shows slight differences between runs delayed by twelve hours. In Fig. 2 the CC highest bars with values above 0.7 correspond to Arroyo Algodón (30350) AWS, which is located in a plain region. On the other hand, the correlation coefficient has the lowest values for the stations Los Reartes (30253), Villa Dolores (30231), and La Rinconada (30168) while the rest of the stations have CC above 0.5. It should be noticed that stations 30253 and 30231 are both in mountainous terrain. Interestingly, the new model (WRF-E, brown bars) does not present significant differences in CC with the other operative WRF models, except for Cruz del Eje (30167) station where the difference is close to 50%.
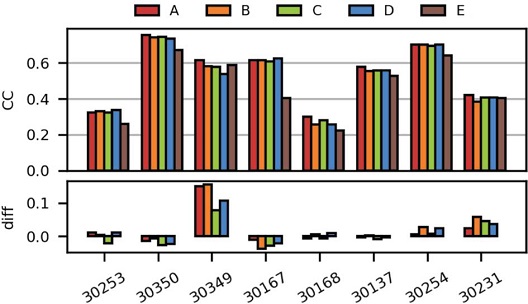
Pearson correlation coefficient calculated at 06 UTC (upper panel) and difference CC 06 UTC-CC 18 UTC (lower panel).
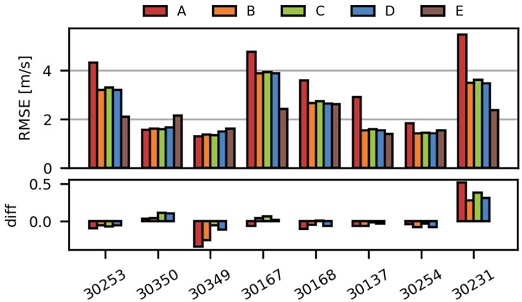
Root mean square error (RMSE) calculated at 06 UTC (upper panel) and difference RMSE 06 UTC-RMSE 18 UTC (lower panel).
Fig. 3 shows the RMSE in the top panel, and the difference between runs 12 hours apart in the bottom panel. Clearly, the WRF-A model gives the worst performance for the majority of stations while the WRF-E shows an improvement with respect to the other models in at least half of the stations (30253, 30167, 30137 and 30231). For the rest of them, WRF-E has a similar performance to that of the other models.
The BIAS given by Eq. (3) is positive, which indicates that the wind speed is overestimated except when the equation is applied to stations 30350 and 30349. As seen in Fig. 4, the WRF-A model has the worst performance except for stations 30350 and 30349. In general, the WRF-E model reduces the positive BIAS when compared with the operational models, as seen for stations 30253, 30167, 30137 and 30231. However, when operative model BIAS is negative, WRF-E model tends to increase the negative BIAS, as seen for stations 30350, 30349 and 30254. This behavior could be due to topo_wind option in WRF-E. In Figs. 2, 3 and 4, the lower panel shows negligible changes in the statistical parameters of wind speed forecasted by the operational models between runs at 06 UTC and 18 UTC.
It is interesting to note that the forecasted wind speed statistical performance is related to the kind of terrain where the AWS stations are. In fact, the best performance seen in Figs. 2, 3 and 4 correspond to stations 30350, 30349, 30137, and 30254 which are on a plain. Conversely, the worst statistical performance is for stations 30253, 30167, and 30231 with BIAS larger than 2 m/s (models WRF-B, WRF-C, WRF-D), and above 3 m/s for model WRF-A. The latter stations are located in the mountainous region.
4. 2 Wind Direction Forecasted by Operative WRF-OHMC and WRF-E
The hourly wind direction predictions were compared with the ground data measured hourly at a height of 10 m above ground level. The statistical measures used in this analysis are RMSE and BIAS for Δθ, which represents the angular difference between forecasts and measurements. Fig. 5 shows wind direction variation as a function of measured wind speed for each AWS. The red dots correspond to the 06 UTC run and blue dots to the 18 UTC run. There is a clear indication that the angular variation decreases with wind speed. This is not observed for station 30231, where Δθ has a tendency to ~-90° for high wind speed. This fact suggests that there is a negative BIAS in the model forecast i.e. WRF shows an anticlockwise rotation with respect to the wind measured in Villa Dolores. This could be due to the difficulty to simulate wind direction in complex terrain or perhaps an incorrect operation of the station wind vane. Moreover, Fig. 2 shows a low correlation for this particular station.
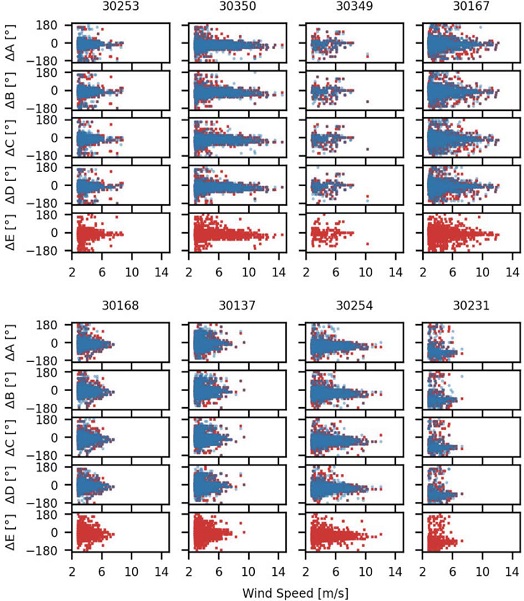
Difference between forecasted and measured wind direction vs measured wind speed. Each column of four scatter plots correspond to stations and rows correspond to models WRF-A, WRF-B, WRF-C, WRF-D and WRF-E. Red dots correspond to 06 UTC run and blue dots to 18 UTC run.
There are not noticeable differences between forecasts run in the morning versus forecasts run in the evening for all the operative schemes (WRF-A, WRF-B, WRF-C and WRF-D).
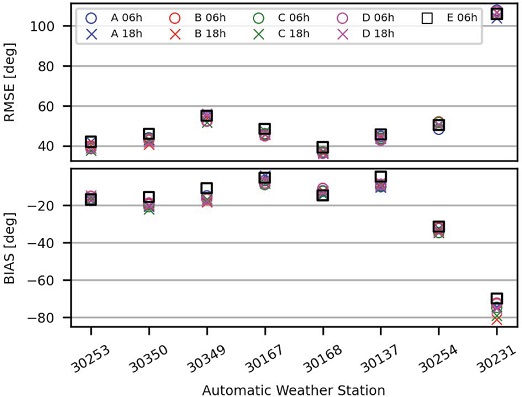
Fig. 6 shows RMSE in the top panel, and BIAS in the bottom panel, for the AWS used. Values are presented in color circles (06 UTC) and crosses (18 UTC) for the four operative forecasts. The values of the new WRF-E model are represented by black squares, but only for 06 UTC. RMSE has a dispersion below 60° for all the stations except for 30231 station. Moreover, for all stations there are negligible differences for runs twelve hours apart. The BIAS in the wind direction is lower than 20° anticlockwise for six stations. Station 30254 presents a positive BIAS of about 35°, and station 30231 a BIAS between 70° and 80°. The latter is consistent with the column labeled 30231 in Fig. 5. The new WRF-E shows only a slight BIAS improvement for all cases.
4. 3 Wind Gust Forecasted by Operative WRF-OHMC and WRF-E
In this section, wind gusts measured by the stations were compared with those wind gusts forecasted by models WRF- A, WRF-B, WRF-C, WRF-D and WRF-E. To evaluate the wind gust estimation proposed in Eq. (6), it is better to consider only forecasted wind speeds that have a good correlation with measured wind speeds. This is the reason why a filter was applied to the wind speed to keep only the data that meet the condition CC≥0.5 for 6 hs time intervals. The results of the comparisons with the filtered data are presented in Fig. 7.
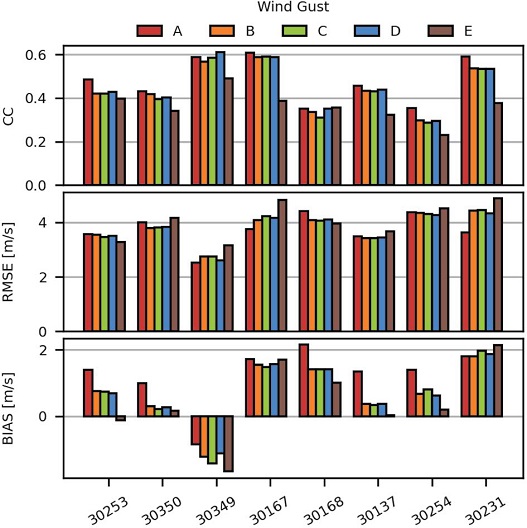
Wind gust Pearson correlation coefficient (upper panel), RMSE (middle panel) and BIAS (lower panel) for OHMC operative models WRF- A, WRF-B, WRF-C, WRF-D and test model WRF-E.
The top panel of Fig. 7 shows that the range of CC of wind gust forecasted by operative models WRF-A, WRF-B, WRF-C and WRF-D is between ~0.3 for station 30254 (Las Varillas) and ~0.6 for stations 30349 and 30167 (Bell Ville and Cruz del Eje). WRF-A model has a slightly greater CC than the other operative models. Regarding model WRF-E, it has lower CC values than operative models in most stations except for station 30168 (La Rinconada) where CC is approximately equal.
RMSE is shown in the middle panel of Fig. 7. RMSE values are between ~3 m/s for station 30349 (Bell Ville) and ~5 m/s for stations 30167 (Cruz del Eje), 30168 (La Rinconada), 30254 (Las Varillas) and 30231 (Villa Dolores). There are no significant differences of RMSE among operative models WRF-A, WRF-B, WRF-C and WRF-D. However, model WRF-E has slightly greater RMSE than operative models in most stations.
The lower panel of Fig. 7 shows BIAS for all stations. From this panel it is possible to notice that all stations have a positive BIAS except for station 30349 (Bell Ville). In addition, models WRF-B, WRF-C and WRF-D have a similar BIAS in most stations. Instead, model WRF-A has a greater BIAS in stations 30253 (Los Reartes), 30350 (Arroyo Algodón), 30168 (La Rinconada), 30137 (Laboratorio de Hidraulica), and 30254 (Las Varillas) than models WRF-B, WRF-C, WRF-D, and WRF-E. In contrast, WRF-A has a lower BIAS in station 30349 (Bell Ville) than the same models.
On the other hand, model WRF-E has a significantly lower BIAS than operative models in all stations except 30349 (Bell Ville), 30167 (Cruz del Eje), and 30231 (Villa Dolores). It is important to note that models WRF-B, WRF-C and WRF-D have a similar performance in most stations possibly because these models have a common planetary boundary layer, and land surface parameterization schemes (YSU PBL and Unified Noah LSM, respectively). Despite the use of the same planetary boundary layer and land surface parameterization schemes, model WRF-E has a different performance in most stations, probably as a result of both, more vertical levels in this scheme (50 vs. 34 levels), and the use of the topo_wind option.
5. CONCLUSION
In this paper, an evaluation of WRF 10 m wind speed, wind gust and wind direction forecasts were performed by comparing them with data from eight automatic weather stations widely spread across the province of Córdoba (Argentina). The stations dataset used span a whole year from June 1, 2019 to June 1, 2020. The WRF forecasts used in this work correspond to four operative models (WRF-A, WRF-B, WRF-C and WRF-D), and a test model named WRF-E that aims to correct the high wind speed BIAS seen in WRF. This new model implements more vertical levels than the operative models (50 vs. 34 levels), and activates the topo_wind option.
The correlation coefficient showed a similar behavior among operative models. The RMSE shows that model WRF-A has a higher value than the other models (Fig. 3) in almost all stations. The analysis of BIAS shows that the simulated wind speeds have positive BIAS with respect to the wind measured in most stations. Model WRF-A presents a greater positive BIAS than the other models used in this work including WRF-E. It is important to note that the new model WRF-E produces less biased wind speeds, which is an objective of this work, however when the BIAS of operative models is negative, WRF-E tends to increase the negative BIAS. The similarities in RMSE and BIAS observed in models WRF-B, WRF-C and WRF-D are probably a consequence of the physical configuration used in these models. In fact, they use Yonsei University PBL scheme while model WRF-A uses MYJ PBL scheme. Results suggest that there is no significant difference in wind speed statistical parameters between 06 and 18 UTC runs.
The analysis performed in wind direction shows that WRF has a higher forecast accuracy when wind speed is high (≥ 5 m/s). In contrast, the forecast quality is worse for low wind speeds (Fig. 5). The values of wind direction RMSE range from 40° to 60° for most stations. The BIAS analysis indicates that WRF has a counterclockwise BIAS in wind direction forecast (~-20°). There are no significant differences in RMSE and BIAS between operative models and test model WRF-E. This fact could indicate that wind direction forecast is insensitive to the different parameterization schemes. Possibly, the wind direction forecast may be more dependent on model representation of topography rather than on model physical configuration. The WRF-E model improves the wind speed forecast compared to the operative models because there is a significant reduction of positive BIAS and RMSE in wind speed forecast in most stations. Unfortunately, the correlation results of WRF-E are generally worse than those presented by the operational model forecasts.
In this work, a gust wind forecast algorithm was implemented and subsequently evaluated. In order to perform a statistical analysis of wind gust forecast, Eq. (6) was applied to the 1-year dataset of WRF operative models and WRF-E test model. Results show that the correlation coefficient values associated with the wind gust forecasts are between 0.3 and 0.6. RMSE values associated with WRF-E model are between 3 and 5 m/s and does not show significant variations with respect to the operational models. Model WRF-E shows a significant improvement of BIAS with respect to the operational models for most stations possibly due to the use of topo_wind option.
According to results, WRF-E model reduces BIAS of wind speed and wind gust forecasts compared to operative models. Therefore, its use is recommended to achieve wind speed and wind gust simulations less biased. However, it is necessary to study whether the computing time demanded on the WRF-E simulation justifies the less biased results achieved. On the other hand, it is advisable to explore finer horizontal resolutions and better terrain representation in order to reduce wind speed, wind gust and wind direction RMSE in the province of Córdoba.
DECLARATION OF COMPETING INTEREST
The authors declare that they have no known competing financial interests or personal relationships that could have appeared to influence the work reported in this paper.
Acknowledgments
The authors would like to thank OHMC (Observatorio Hidrometeorológico de la Provincia de Córdoba) for providing the necessary resources to carry out this research.
References
- Benjamin, S.G., Brown, J.M., Brundage, K.J., Dévényi, D., Grell, G.A., Kim, D., Schwartz, B.E., Smirnova, T.G., Smith, T.L., Weygandt, S.S., Manikin, G.S. (2002) Nws technical procedures bulletin no. 490 ruc20-the 20-km version of the rapid update cycle, NOAA/OAR Forecast Systems Laboratory, Boulder, CO 1.
- Benjamin, S.G., James, E.P., Brown, J.M., Szoke, E.J., Kenyon, J.S., Ahmadov, R. (2020) Diagnostic fields developed for hourly updated NOAA weather models.
-
Bronstert, A., Agarwal, A., Boessenkool, B., Crisologo, I., Fischer, M., Heistermann, M., Köhn-Reich, L., López-Tarazón, J.A., Moran, T., Ozturk, U., Reinhardt-Imjela, C. (2018) Forensic hydro-meteorological analysis of an extreme flash flood: The 2016-05-29 event in braunsbach, sw germany. Science of the Total Environment, 630, 977-991.
[https://doi.org/10.1016/j.scitotenv.2018.02.241]

-
Casanovas, C., Salio, P., Galligani, V., Dolan, B., Nesbitt, S.W. (2021) Drop size distribution variability in Central Argentina during RELAMPAGO-CACTI. Remote Sensing, 13(11), 2026.
[https://doi.org/10.3390/rs13112026]

-
Dhunny, A., Timmons, D., Allam, Z., Lollchund, M., Cunden, T. (2020) An economic assessment of near-shore wind farm development using a weather research forecast-based genetic algorithm model. Energy, 201, 117541.
[https://doi.org/10.1016/j.energy.2020.117541]

-
Dzebre, D.E., Acheampong, A.A., Ampofo, J., Adaramola, M.S. (2019) A sensitivity study of surface wind simulations over Coastal Ghana to selected time control and nudging options in the weather research and forecasting model. Heliyon, 5(3), e01385.
[https://doi.org/10.1016/j.heliyon.2019.e01385]

-
Feroz, R.M.A., Javed, A. (2021) Forecasting of wind resources using the weather research and forecasting software. 2021 International Bhurban Conference on Applied Sciences and Technologies (IBCAST), IEEE, pp. 726-729.
[https://doi.org/10.1109/IBCAST51254.2021.9393212]

-
Jacondino, W.D., da Silva Nascimento, A.L., Calvetti, L., Fisch, G., Beneti, C.A.A., da Paz, S.R. (2021) Hourly day-ahead wind power forecasting at two wind farms in northeast brazil using WRF model. Energy, 230, 120841.
[https://doi.org/10.1016/j.energy.2021.120841]

-
Jiménez, P.A., Dudhia, J. (2012) Improving the representation of resolved and unresolved topographic effects on surface wind in the WRF model. Journal of Applied Meteorology and Climatology, 51(2), 300-316.
[https://doi.org/10.1175/JAMC-D-11-084.1]

- Le Favi, D.N. (2020) Atlas climatico digital de la República Argentina. Temas de Biologia y Geologia del NOA, 9(3), 64-67.
-
Manuel-Navarrete, D., Gomez, J.J., Gallopín, G. (2007) Syndromes of sustainability of development for assessing the vulnerability of coupled human-environmental systems. the case of hydrometeorological disasters in Central America and the Caribbean. Global Environmental Change, 17(2), 207-217.
[https://doi.org/10.1016/j.gloenvcha.2006.07.002]

-
Patel, P., Ghosh, S., Kaginalkar, A., Islam, S., Karmakar, S. (2019) Performance evaluation of WRF for extreme flood forecasts in a coastal urban environment. Atmospheric Research, 223, 39-48.
[https://doi.org/10.1016/j.atmosres.2019.03.005]

-
Politi, N., Nastos, P., Sfetsos, A., Vlachogiannis, D., Dalezios, N. (2018) Evaluation of the AWR-WRF model configuration at high resolution over the domain of Greece. Atmospheric Research, 208, 229-245.
[https://doi.org/10.1016/j.atmosres.2017.10.019]

-
Prósper, M.A., Otero-Casal, C., Fernández, F.C., Miguez-Macho, G. (2019) Wind power forecasting for a real onshore wind farm on complex terrain using WRF high resolution simulations. Renewable Energy, 135, 674-686.
[https://doi.org/10.1016/j.renene.2018.12.047]

-
Rodriguez, H., Lighezzolo, A., Martina, A., Zigarán, G., Viscardi, D.A.V., Rodriguez, A., Baudo, F., Scavuzzo, C.M., Bellis, L.M., Arganaraz, J.P. (2018) Towards the operational implementation of the fire weather index FWI based on the highresolution WRF model. 2018 IEEE Biennial Congress of Argentina (ARGENCON), IEEE, pp. 1-6.
[https://doi.org/10.1109/ARGENCON.2018.8645974]

-
Santos-Alamillos, F., Pozo-Vázquez, D., Ruiz-Arias, J., Lara-Fanego, V., Tovar-Pescador, J. (2013) Analysis of WRF model wind estimate sensitivity to physics parameterization choice and terrain representation in Andalusia (southern Spain). Journal of Applied Meteorology and Climatology, 52(7), 1592-1609.
[https://doi.org/10.1175/JAMC-D-12-0204.1]

-
Schumacher, R.S., Hence, D.A., Nesbitt, S.W., Trapp, R.J., Kosiba, K.A., Wurman, J., Salio, P., Rugna, M., Varble, A.C., Kelly, N.R. (2021) Convective-storm environments in subtropical South America from high-frequency soundings during RELAMPAGO-CACTI. Monthly Weather Review, 149(5), 1439-1458.
[https://doi.org/10.1175/MWR-D-20-0293.1]

- Singh, I., Nesbitt, S.W., Davis, C.A. (2019) Initiation of deep moist convection over the sierras de Córdoba mountains in Argentina. AGU Fall Meeting Abstracts, 2019, A53U-3043.
- Skamarock, W.C., Klemp, J.B., Dudhia, J., Gill, D.O., Liu, Z., Berner, J., Wang, W., Powers, J.G., Duda, M.G., Barker, D.M., Huang, X.Y. (2019) A description of the advanced research WRF model version 4. National Center for Atmospheric Research: Boulder, CO, USA 145.
-
Wang, Q., Luo, K., Yuan, R., Zhang, S., Fan, J. (2019) Wake and performance interference between adjacent wind farms: Case study of Xinjiang in China by means of mesoscale simulations. Energy, 166, 1168-1180.
[https://doi.org/10.1016/j.energy.2018.10.111]


