Modelling of Aerosol Vertical Distribution during a Spring Season at Gwangju, Korea
Abstract
The vertical distributions of aerosol extinction coefficient were estimated using the scaling height retrieved at Gwangju, Korea (35.23°N, 126.84°E) during a spring season (March to May) of 2009. The aerosol scaling heights were calculated on a basis of the aerosol optical depth (AOD) and the surface visibilities. During the observation period, the scaling heights varied between 3.55 km and 0.39 km. The retrieved vertical profiles of extinction coefficient from these scaling heights were compared with extinction profile derived from the Light Detection and Ranging (LIDAR) observation. The retrieve vertical profiles of aerosol extinction coefficient were categorized into three classes according to the values of AODs and the surface visibilities: (Case I) the AODs and the surface visibilities are measured as both high, (Case II) the AODs and the surface visibilities are both lower, and (Others) the others. The averaged scaling heights for the three cases were 3.09±0.46 km, 0.82±0.27 km, and 1.46±0.57 km, respectively. For Case I, differences between the vertical profile retrieved from the scaling height and the LIDAR observation was highest. Because aerosols in Case I are considered as dust-dominant, uplifted dust above planetary boundary layer (PBL) was influenced this discrepancy. However, for the Case II and other cases, the modelled vertical aerosol extinction profiles from the scaling heights are in good agreement with the results from the LIDAR observation. Although limitation in the current modelling of vertical structure of aerosols exists for aerosol layers above PBL, the results are promising to assess aerosol profile without high-cost instruments.
Keywords:
Scaling height, Aerosol optical depth, Visibility, Extinction coefficient, Vertical distribution1. INTRODUCTION
Definition of atmospheric aerosols is small solid/liquid particles suspended in the atmosphere. It has been well known that aerosols can scatter or absorb solar radiation, so called the aerosol direct effect. Their impacts on cloud particle size, cloud water/ice contents, the albedo, and lifetime of clouds has been known as the aerosol indirect effect (Bellouin et al., 2013; Yang et al., 2009; Griggs and Noguer, 2002). Although a large number of previous researches have been conducted around the world in order to increase our understanding with regard to the direct and the indirect effects of atmospheric aerosol on climate, aerosol radiative effects still have uncertainties (Bellouin et al., 2013; Huebert et al., 2003; Haywood et al., 1998). Estimating the impact of the atmospheric aerosols on the climate change accurately is still challengeable due to the spatial/temporal variability of the atmospheric aerosols such as number of concentration, size, composition, and geographical or vertical distribution in the atmosphere (Noh et al., 2012; Solomon, 2007). The vertical distribution of atmospheric aerosol is particularly important for understanding the radiative effect of atmospheric aerosols (Wong et al., 2009). Quijano et al. (2000) found that variations of radiative effect (e.g., heating rate) due to inhomogeneous aerosol loading and their vertical distribution could be varied during the long-range transportations. Also, the radiative transfer models require the appropriate vertical distribution of atmospheric aerosol at each individual given location as input parameters for more reliable results.
East Asia is important source region of global air pollution. The air pollution in East Asia consists of anthropogenic aerosols from industry and traffic emission and natural aerosols such as dust, smoke from forest fire, and agricultural burning (Shin et al., 2015; Lee et al., 2006; Murayama et al., 2004). Since the Korea peninsula is located in the downwind area of the Asian continent, westerly winds frequently carry the severe air pollution from the East Asian mainland to Korea. Spring season is typical with the severe Asian dust outbreaks occurred from desert region such as Taklimakan or Gobi desert. During the dust storm period, vertical distributions of the Asia dust are varied in their travel over East Asia. Recently, there were many efforts to provide information on the vertical distribution of atmospheric aerosol over East Asia. The Light Detection and Ranging (LIDAR) research groups have been conducted to measure the vertical resolved profiles of optical properties/microphysical properties such as the extinction coefficient, the backscatter coefficient, the effective radius, and the single scattering albedo (i.e. Lee et al., 2015; Shin et al., 2015, 2014 and 2013; Noh et al., 2012, 2009, and 2008; Kim et al., 2010). Aircraft measurement campaigns also have been carried out to measure distributions of the properties of atmospheric aerosol for different atmospheric layer (Kim et al., 2014). Although LIDAR observations and air-borne aerosol observations can provide useful data to describe the vertical structures of atmospheric aerosols, the high instrument cost, its complicated installation and stabilization, and difficulties to maintenance as well as meteorological condition for observation still exists as limitations to be used widely. The vertical distribution of aerosols has been retrieved by aerosol optical properties from the ground based observation in several studies (Lee et al., 2014, 2013; Wong et al., 2009; Qiu et al., 2005). These studies presented a method to determine the vertical profiles of aerosol extinction coefficient numerically. They described that the vertical profiles of aerosol extinction coefficients can be estimated based on the computation of aerosol scaling height from surface visibility data with the columnar aerosol properties such as aerosol optical depth (AOD).
In this study, we estimated the vertical aerosol profiles and scaling height calculated with the AODs and the surface visibilities measured at Gwangju, Korea (35.23°N, 126.84°E) during spring season (March to May) of 2009. The main objective of this study is to estimate the variation of the scaling height during spring season. We also investigated the influence factor which can worsen the reliable estimation with regard to the vertical aerosol profiles modelled with the scaling height. The modelled aerosol vertical distributions are compared with the vertical profiles derived from LIDAR observation. We used AOD data from the re-analysis data provided by the Monitoring Atmospheric Composition and Climate (MACC) global air quality service of the European Centre for Medium-Range Weather Forecast (ECMWF) and the surface visibility data obtained from the Korea Meteorological Administration (KMA). Section 2 presents the method and the data set that are used in this study. Section 3 includes our results. We discuss our results and summarize our finding in Section 4.
2. Methodology
2. 1 Data Collection
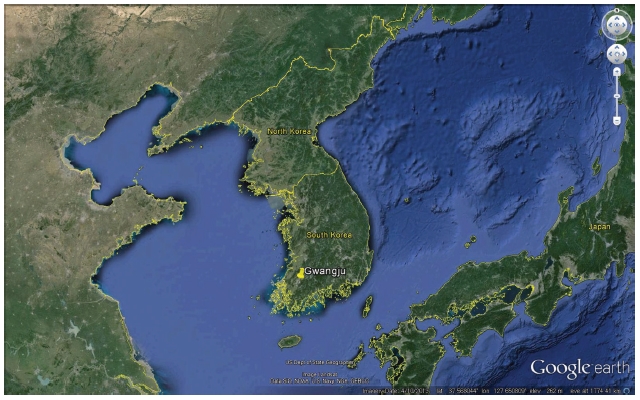
AODs and the surface visibilities data at Gwangju (35.23°N, 126.84°E), the south-western part of the Korean peninsula (see Fig. 1), were used in this study. The MACC global air quality service of the ECMWF provides a re-analysis data of global composition. The re-analysis data assimilate satellite data for instance total AOD which is provided the Moderate Resolution Imaging Spectroradiometer (MODIS), into a global model and data assimilation system to reduce the departure between the model results and observation data (Bellouin et al., 2013; Inness et al., 2013). The re-analysis also provides AOD of certain aerosol classified as mineral dust, black carbon, organic matter, and sulphate as well as the columnar contents of gas species. The re-analysis provides 8 times per a day. The reliability of inferring AOD from the MACC re-analysis is validated by comparisons with the results from AErosol Robotic NETwork (AERONET) sunphotometer measurement (Cesnulyte et al., 2014). The surface visibility data were obtained from the visibility data which are reported by the Gwangju Regional Meteorological Administration.
The LIDAR system used in this study measures an elastic-backscattered signal at 532 nm. A pulsed Nd : YAG laser, transited from the original wavelength of 1064 nm, is a light source of this LIDAR. The backscattered signals are collected with an 8-inch Schmidt-Cassegrain type telescope with 60 MHz sampling rate. Received signals are collected as 2 minute time resolution and a vertical resolution of 2.5 m. A detailed systematic description is given in Shin et al. (2014). The vertical profiles of the αa are derived on the basis of the numerical inversion scheme suggested by Klett (1985). This method requires the initial value of extinction to backscatter ratio (so-called lidar ratio). Consequently, the retrieval of the aerosol extinction is significantly depends on the correct choice of the lidar ratio. The extinction derived by LIDAR observations are assessed up to 50% due to the statistical or systematic errors (Wandinger and Ansmann, 2002; Ansmann et al., 1992).
2. 2 Estimation of the Vertical Profiles of Aerosol Extinction Coefficient
In order to estimate the vertical profiles of the aerosol extinction coefficient, αa(z,λ), the aerosol scaling height (za) was determined. Aerosol scaling height was defined by the height of an exponential profile at which the values of the aerosol extinction coefficient is decreased exponentially of the extinction coefficient at the surface level (αa(0,λ)).
| (1) |
The AOD (τa) is the integral form of the αa(z,λ) in equation (2). This can be written as equation (3) with equation (1),
| (2) |
| (3) |
where zTOA is the height of the top of atmosphere. za is also wavelength-dependent as the αa(z,λ). In this study, we retrieved the za with αa(0,λ) at 550 nm wavelength.
The extinction which is might be produced by the background stratospheric aerosol and gases at 550 nm are comparably negligible than the extinction by tropospheric aerosol. The smaller za (larger decreasing rate) is considered as larger contribution to AOD from the lower troposphere or surface and the larger za (smaller decreasing rate) implies that the aerosols are mainly contributed in the upper troposphere for the condition that the αa at the surface is same (Wong et al., 2009; Qiu et al., 2004). The αa(0,550 nm) can be estimated from the surface visibility (Vis) by the Koschmieder equation (Koschmieder, 1924) as:
| (4) |
where αm(0,550 nm) is the molecular extinction coefficient at 550 nm wavelength and the surface level. The za eventually can be calculated by combining equation (3) and (4) as follow:
| (5) |
We used the AOD data at 550 nm from the re-analysis of ECMWF and the surface visibility data which are provided by the Korea Meteorological Administration (KMA) to calculate the za and the vertical profiles of the αa.
3. Results
The temporal variation of AOD at 550 nm and the surface visibility at Gwangju are shown Fig. 2. The αa at the surface derived from the surface visibility are also presented. The average values of AOD at 550 nm were 0.34±0.15. The average values of the surface visibility and αa at the surface are 16.95±1.95 km and 0.27±0.11 km-1, respectively for the 39 cases of observation during spring season of 2009. The values of AODs, the visibility, and the extinction coefficient at the surface are varied over a wide range of values. We find values of 0.11 to 0.68 for AODs at 550 nm and 7 km to 30 km for the surface visibilities. On average, the surface visibility decreases when the AODs at 550 nm increases. In general, the AODs are associated with the aerosol loading in the atmosphere. Higher AODs represent the higher aerosol loading and thus lower visibility (Hoff and Christopher, 2009). The negative correlation of the surface visibility with the αa at the surface also related to high aerosol loading at the surface.
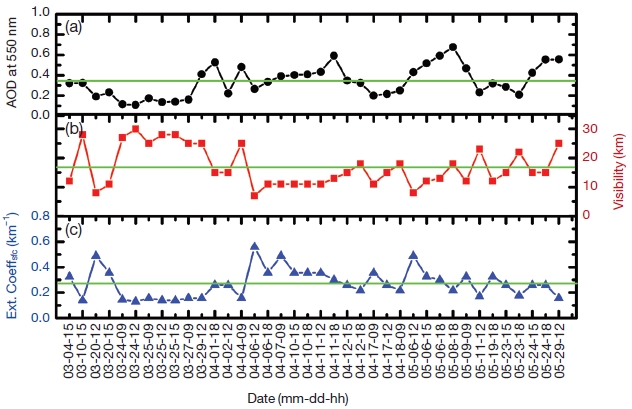
Time series plots of (a) aerosol optical depth at 550 nm retrieved from ECMWF (black), (b) surface visibility from KMA (red), and (c) extinction coefficient at the surface calculated with the surface visibility (blue) at Gwangju, Korea during spring season (March to May) of 2009. Green colored lined indicates mean value of each parameter.
Fig. 3 shows the temporal variation of za at Gwangju, Korea during spring season of 2009. The za are derived from the AODs at 550 nm and the ground-level visibility. The average value of the za is 1.39±0.75 km. The values of the za retrieved in this study is mostly similar to the values of the za which were presented in previous studies over East Asia (Lee et al., 2013; Wong et al., 2009; Qiu et al., 2005). However, high values of the za (more than 3 km) are calculated for a few cases. The maximum and minimum value of the za is found as 3.55 km and 0.39 km, respectively.
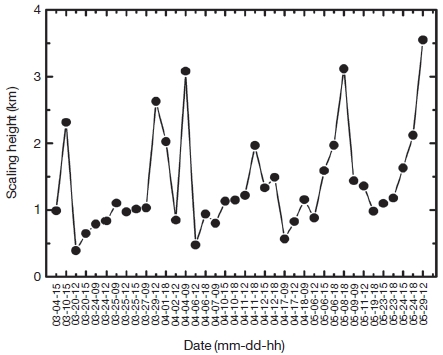
Variation of aerosol scaling height retrieved with the AODs from ECMWF and the visibilities from KMA at Gwangju, Korea during spring season of 2009.
The averaged vertical profiles of αa for 39 profiles which are derived with the za at each individual vertical point and the αa at the surface. The mean vertical profile of αa are presented in Fig. 4. The corresponding averaged values of AOD, visibility, αa at the surface, and za are summarized in Table 1. The mean vertical profile of αa which are derived from the elastic-backscattered signal observed by the LIDAR system is also shown in Fig. 4. The horizontal error bars of the averaged vertical profiles of αa indicates the standard deviation in terms of the variation of individual retrieved profiles during observation period. The value of αa inferred from the modelling at each vertical point is considered to be differed to the αa from the LIDAR observation. This difference is considered as a result from the uncertainty of the αa inferred from the LIDAR observation. The uncertainty of the profiles of the αa derived with the elastic LIDAR is large (20-30%) (Ansmann et al., 1992). Another possible reason for the differences is the different retrieval wavelength for αa. The αa at 550 nm at each vertical point are estimated with the za but the LIDAR derived αa uses 532 nm. Nevertheless, the averaged vertical profile of αa from LIDAR observation is within the standard deviation of αa retrieved from the modelling with data set. It is considered that the αa from the modelling is relatively in good agreement with the results from the LIDAR observation.
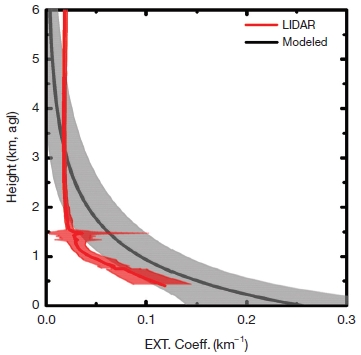
Mean vertical profiles of aerosol extinction coefficients estimated with the aerosol scaling height (black) and the LIDAR observation (red) at Gwangju, Korea during spring season of 2009. Standard deviation is shown as the horizontal error bars, respectively.

Mean AODs, visibility, extinction coefficient at the surface, scaling height, and the differences between vertical aerosol profile estimated with the scaling height and LIDAR observation at Gwangju, Korea during spring season of 2009.
The za is most essential parameter to estimate the reliable vertical profiles of αa. The za is determined by αa at the surface derived from the surface visibility and the AODs. The relation between the za and the αa at surface is illustrated in Fig. 5a. The Fig. 5a shows a negative correlation of the za with the αa at the surface. Increasing the αa at the surface is considered that the aerosol is mainly distributed at the surface or lower troposphere. Consequently, the za, which determined the vertical distribution of aerosol, decreases as the αa at the surface increases. In contrast, a positive correlation of the AODs with the za was found as shown in Fig. 5b. The za is determined as high when the AODs increase. High AOD is considered to increase the chance to be distributed in not only lower troposphere or the surface but also upper troposphere. The za is determined in consideration of both the αa at the surface and the AOD. A comparably better correlation between the za and the AOD (r2=0.51) is believed that the AOD influence more on determination of the za than the visibility at the surface during the observation period in this study.
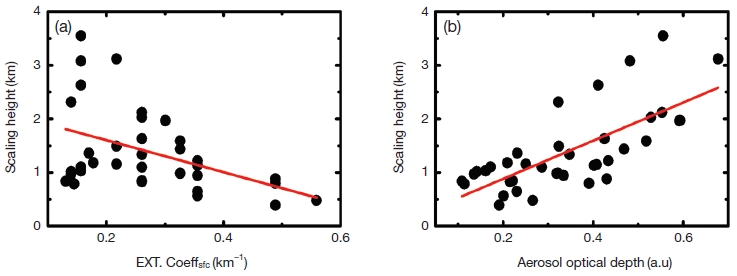
Scatterplot of (a) the extinction coefficients at the surface and the aerosol optical depths versus the aerosol scaling heights.
The AOD is an integral form of the αa with height from the surface to the top of the atmosphere. Since the majority of aerosol abundance exists at the near surface within the planetary boundary layer (PBL), with regard to increment of AOD we expected that the visibility at the surface decrease (i.e., the αa at the surface increases). The visibilities at the surface however are not linked to the variation of AODs for few cases as we expected during the observation period. For instance, the higher visibilities are observed at the surface although the AODs are significantly high for some cases (see Fig. 2). We believe that the aerosol plumes are mostly transported to our study area through the upper troposphere (e.g., above PBL) for these cases. Thus, the visibility at the surface are observed as higher even though the AOD is high. The higher AOD are assessed from the aerosols existed above PBL in these cases.
We classified the estimated vertical profiles into 3 categories with regard to the AODs and the visibility. Fig. 6 shows the modelled vertical profiles and the LIDAR observation for each classified case. Case I includes the observation days when the higher AODs (> averaged AOD) and the high visibilities (> averaged visibility) were measured. Case II includes the days for the lower AODs and visibilities and the other days were classified as Case III. Therefore, the differences between the estimated vertical profiles of αa from modelling and the LIDAR observation were varied according the classification. A comparably larger difference between the vertical profile of αa from modelling and LIDAR observation were found in Case I as 59±16%. The estimated vertical profiles of αa were relatively well matched with the aerosol vertical profiles derived from LIDAR observation in case of Case II (39±14%).
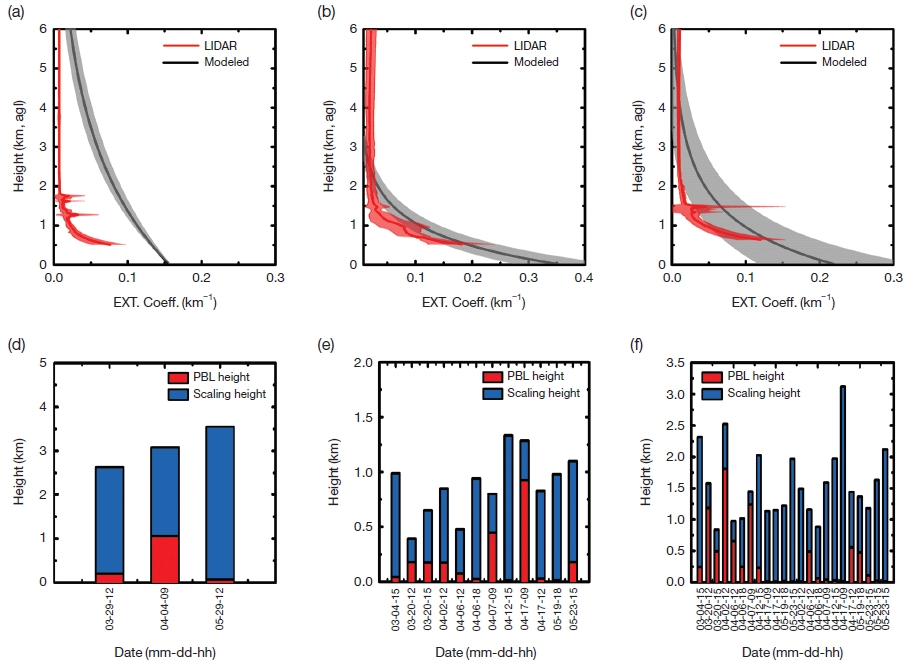
(top panel) mean vertical profiles of aerosol extinction coefficients estimated with the aerosol scaling height (black) and the LIDAR observation (red) at Gwangju, Korea during spring season of 2009 for (a) Case I, (b) Case II, and (c) others. Standard deviation is shown as the horizontal error bars for each individual cases, respectively (bottom panel). The aerosol scaling height and the planetary boundary layer for (d) Case I, (e) Case II, and (f) others. The mean values of scaling height and the PBL height and the differences between the scaling height and the PBL height are presented in the graph for each case, respectively.
The za and the PBL height obtained from re-analysis data are shown in Fig. 6. The averaged za, the PBL height, and the difference between the za and the PBL height are presented for each individual case. The higher za was estimated for the Case I and the averaged za was 3.09±0.46 km. In contrast, the lower za are estimated for Case II. The averaged za is 0.82±0.27 km for Case II. The PBL heights are 0.45±0.54 km and 0.19±0.26 km for the Case I and Case II, respectively. The aerosols are mainly transported to our observation site through the upper troposphere for Case I. The aerosols in this case are thus considered to be mostly distributed in the upper troposphere compared to the surface. As An interesting result, the visibilities could be measured at the surface as high even though the high AOD were observed. Also, the high za are calculated with high values of AODs and high visibility for this reason in case of Case I. Because the aerosol are distributed in upper troposphere for Case I from the high za, it is considered that there is a limitation to determine the vertical distribution by description of exponential decreasing when the aerosol are distributed and transported in various altitude above PBL height. In contrast, Case II showed that the lower visibility at the surface and lower AODs are measured. Under the wet atmosphere conditions (i.e. relative humidity (RH)>70%), visibility can be reduced by the growth of hygroscopic particles (e.g., sulphate) (Charlson et al., 1978). A spring season in Korea is typically dry and the averaged RH during the observation period was 49%. Therefore, we can consider that dry aerosols are mostly responsible to visibility within PBL. For Case II, the za are calculated as lower than Case I. The vertical distribution of aerosols could be retrieved accurately. We summarized the corresponding values for each classification in Table 2.

Mean AODs, visibility, extinction coefficient at the surface, scaling height, and the differences between vertical aerosol profile estimated with the scaling height and LIDAR observation at Gwangju, Korea during spring season of 2009 for Case I, Case II, and others.
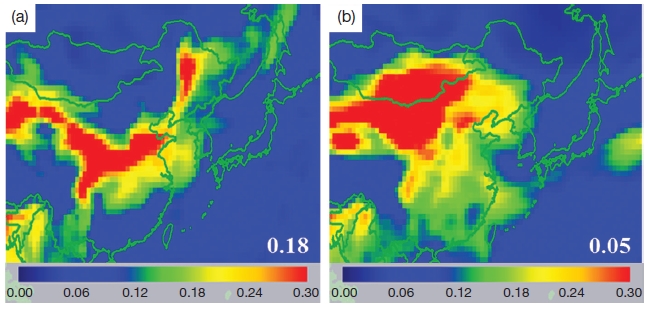
We used model results from the MACC for the interpretation of the type of aerosols for each classified case. The mean dust AOD for Case I and Case II are shown in Fig. 7a and Fig. 7b, respectively. The mean dust AODs are 0.18 and 0.05 for the Case I and Case II, respectively. The dust AODs for Case I are significantly higher than the dust AODs for Case II. Most Asian dust events over East Asia can be described by the emission of dust in desert areas and subsequent transport through the high altitude levels (Shin et al., 2015). The types of aerosol for Case I are considered to be mainly consist of dust particle according the model result. The dust particles which are frequently transported through the upper troposphere above PBL are believed to responsibility of high AOD and low visibility at the surface for Case I. Moreover, the za are hard to be estimated accurately to describe the vertical distribution for this type of aerosols (e.g., dust particles that are mostly transported through the upper troposphere above PBL). Asian dust outbreaks occur in spring time of each year as well as sometimes in winter season of each year in Korea (Tatarov et al., 2012). We need to be aware of this type of aerosols which are transported through upper troposphere when we describe the vertical distribution of aerosols with the za. Nevertheless, the za is still good manner to retrieve the vertical profiles of aerosol with a few exception.
4. Summary and Conclusion
In this study we presented the difference of the za in dependence of the different AODs and the surface visibilities. The aerosol vertical profiles were estimated with the za. The retrieved aerosol vertical profiles from the modelling were compared with the results from the LIDAR observation. The data cover the time frame the spring season (March to May) in 2009. The observation days are divided into three categories classified by different AOD values and the surface visibility.
The difference between the vertical aerosol profiles derived from model and LIDAR observation was significant in dependence of aerosol types. The types of aerosol could be inferred by the correlation of AODs and the visibilities. The AODs are associated with aerosol loading in the atmosphere. Higher AODs represent the higher aerosol loading and thus lower visibility. However, the positive correlations of AODs with the visibility (e.g., high AODs and high visibility) are found for a few cases. The averaged za is 3.09±0.46 km and the differences between vertical aerosol profiles derived from modelling and the LIDAR observation was 59±16%. We believed that the aerosols are mainly distributed in upper troposphere in this case. The visibility was measured at the surface as high even though the high AOD were measured simultaneously because of high aerosol loading in the upper troposphere. The za has a limitation to accurately describe the vertical structure when the aerosols are distributed in various altitudes above PBL. The aerosols, which mostly influences on these cases, were considered as dust particles that are usually transported and distributed in the upper troposphere. In contrast, the vertical profiles of αa retrieved from modelling are relatively good in agreement with the vertical profiles of αa measured by LIDAR observation as 39±14%. We consider that the aerosols are mostly distributed at lower troposphere/surface. The za thus is calculated as lower (0.82 km). The vertical distribution of aerosol could be retrieved accurately than the cases that the aerosols are distributed at the upper sphere as well as the surface.
Our results suggests that the za must be determined carefully when the aerosol particles are transported or distributed in upper troposphere above PBL. For instance, description of vertical profiles of αa by using the za in the spring season in Korea, when the Asian dust particle that frequently occurs, is still challenging. Nevertheless, the za could provide the continuous and near-real time information on the vertical distribution of aerosols which can be used as valuable input parameters for the radiative transfer model. In future work, we will aim to develop the method for retrieval of the vertical distribution of aerosols including the aerosol that exists in upper troposphere with za and the variation of the za according to the season with long-term measurement data set.
Acknowledgments
This work was funded by the Korea Meteorological Administration Research and Development Program under Grant KMIPA2015-2012.
REFERENCES
-
Ansmann, A., Riebesell, M., Wandinger, U., Weitkamp, C., Voss, E., Lahmann, W., Michaelis, W., (1992), Combined Raman elastic-backscatter LIDAR for vertical profiling of moisture, aerosol extinction, backscatter, and LIDAR ratio, Applied Physics B, 55(1), p18-28.
[https://doi.org/10.1007/bf00348608]

-
Bellouin, N., Quaas, J., Morcrette, J.-J., Boucher, O., (2013), Estimates of aerosol radiative forcing from the MACC re-analysis, Atmospheric Chemistry and Physics, 13(4), p2045-2062.
[https://doi.org/10.5194/acp-13-2045-2013]

-
Cesnulyte, V., Lindfors, A., Pitkänen, M., Lehtinen, K., Morcrette, J.-J., Arola, A., (2014), Comparing ECMWF AOD with AERONET observations at visible and UV wavelengths, Atmospheric Chemistry and Physics, 14(2), p593-608.
[https://doi.org/10.5194/acp-14-593-2014]

- Charlson, R.J., Waggoner, A.P., Thielke, J.F., (1978), Visibility Protection for Class I Areas: The Technical Basis, Final Report (No. PB-288842), Council of Environmental Quality, Washington, D.C (USA).
- Griggs, D.J., Noguer, M., (2002), Climate change 2001: the scientific basis. Contribution of working group I to the third assessment report of the intergovernmental panel on climate change, Weather, 57(8), p267-269.
-
Haywood, J., Ramaswamy, V., Soden, B., (1999), Tropospheric aerosol climate forcing in clear-sky satellite observations over the oceans, Science, 283(5406), p1299-1303.
[https://doi.org/10.1126/science.283.5406.1299]

-
Hoff, R.M., Christopher, S.A., (2009), Remote sensing of particulate pollution from space: have we reached the promised land, Journal of the Air & Waste Management Association, 59(6), p645-675.
[https://doi.org/10.3155/1047-3289.59.6.645]

-
Huebert, B.J., Bates, T., Russell, P.B., Shi, G., Kim, Y.J., Kawamura, K., Carmichael, G., Nakajima, T., (2003), An overview of ACE-Asia: Strategies for quantifying the relationships between Asian aerosols and their climatic impacts, Journal of Geophysical Research: Atmospheres (1984-2012), 108(D23).
[https://doi.org/10.1029/2003jd003550]

-
Inness, A., Baier, F., Benedetti, A., Bouarar, I., Chabrillat, S., Clark, H., Clerbaux, C., Coheur, P., Engelen, R., Errera, Q., (2013), The MACC reanalysis: an 8 yr data set of atmospheric composition, Atmospheric Chemistry and Physics, 13, p4073-4109.
[https://doi.org/10.5194/acp-13-4073-2013]

-
Kim, J., Yum, S., Shim, S., Kim, W., Park, M., Kim, J.-H., Kim, M.-H., Yoon, S.-C., (2014), On the submicron aerosol distributions and CCN number concentrations in and around the Korean Peninsula, Atmospheric Chemistry and Physics, 14(16), p8763-8779.
[https://doi.org/10.5194/acp-14-8763-2014]

-
Kim, S.-W., Yoon, S.-C., Kim, J., Kang, J.-Y., Sugimoto, N., (2010), Asian dust event observed in Seoul, Korea, during 29-31 May 2008: analysis of transport and vertical distribution of dust particles from LIDAR and surface measurements, Science of the Total Environment, 408(7), p1707-1718.
[https://doi.org/10.1016/j.scitotenv.2009.12.018]

- Koschmieder, H., (1925), Theorie der horizontalen Sichtweite: Kontrast und Sichtweite, Keim & Nemnich.
-
Lee, K.H., Kim, Y.J., Kim, M.J., (2006), Characteristics of aerosol observed during two severe haze events over Korea in June and October 2004, Atmospheric Environment, 40(27), p5146-5155.
[https://doi.org/10.1016/j.atmosenv.2006.03.050]

-
Lee, K.-H., Kim, K.-W., Kim, G., Jung, K., Lee, S.-H., (2013), Visibility Estimated from the Multi-wavelength Sunphotometer during the Winter 2011 Intensive Observation Period at Seoul, Korea, Journal of Korean Society for Atmospheric Environment, 29(5), p682-691.
[https://doi.org/10.5572/kosae.2013.29.5.682]

-
Lee, K.H., Wong, M.S., Kim, K.W., Park, S.S., (2014), Analytical approach to estimating aerosol extinction and visibility from satellite observations, Atmospheric Environment, 91, p127-136.
[https://doi.org/10.1016/j.atmosenv.2014.03.050]

- Lee, K.H., Noh, Y.M., (2015), Multi-wavelength Raman Lidar for determining the Microphysical, Optical, and Radiative Properties of Mixed Aerosols, Asian Journal of Atmospheric Environment, 9(1), p91-99.
-
Murayama, T., Müller, D., Wada, K., Shimizu, A., Sekiguchi, M., Tsukamoto, T., (2004), Characterization of Asian dust and Siberian smoke with multi-wavelength Raman LIDAR over Tokyo, Japan in spring 2003, Geophysical Research Letters, 31(23), L23103.
[https://doi.org/10.1029/2004GL021105]

-
Noh, Y.M., Kim, Y.J., Müller, D., (2008), Seasonal characteristics of LIDAR ratios measured with a Raman LIDAR at Gwangju, Korea in spring and autumn, Atmospheric Environment, 42(9), p2208-2224.
[https://doi.org/10.1016/j.atmosenv.2007.11.045]

-
Noh, Y.M., Müller, D., Shin, D.H., Lee, H., Jung, J.S., Lee, K.H., Cribb, M., Li, Z., Kim, Y.J., (2009), Optical and microphysical properties of severe haze and smoke aerosol measured by integrated remote sensing techniques in Gwangju, Korea, Atmospheric Environment, 43(4), p879-888.
[https://doi.org/10.1016/j.atmosenv.2008.10.058]

-
Noh, Y.M., Müller, D., Lee, H., Lee, K., Kim, K., Shin, S., Kim, Y.J., (2012), Estimation of radiative forcing by the dust and non-dust content in mixed East Asian pollution plumes on the basis of depolarization ratios measured with LIDAR, Atmospheric Environment, 61, p221-231.
[https://doi.org/10.1016/j.atmosenv.2012.07.034]

-
Qiu, J., Zong, X., Zhang, X., (2005), A study of the scaling height of the tropospheric aerosol and its extinction coefficient profile, Journal of Aerosol Science, 36(3), p361-371.
[https://doi.org/10.1016/j.jaerosci.2004.10.005]

-
Quijano, A.L., Sokolik, I.N., Toon, O.B., (2000), Radiative heating rates and direct radiative forcing by mineral dust in cloudy atmospheric conditions, Journal of Geophysical Research, 105(D10), p12207-12219.
[https://doi.org/10.1029/2000jd900047]

-
Shin, D.H., Müller, D., Choi, T., Noh, Y.M., Yoon, Y.J., Lee, K.H., Shin, S.K., Chae, N., Kim, K., Kim, Y.J., (2014), Influence of wind speed on optical properties of aerosols in the marine boundary layer measured by ship-borne DePolarization Lidar in the coastal area of Korea, Atmospheric Environment, 83, p282-290.
[https://doi.org/10.1016/j.atmosenv.2013.10.027]

-
Shin, S.-K., Müller, D., Lee, K., Shin, D., Kim, Y., Noh, Y., (2015), Vertical variation of optical properties of mixed Asian dust/pollution plumes according to pathway of airmass transport over East Asia, Atmospheric Chemistry and Physics Discussions, 15, p6707-6720.
[https://doi.org/10.5194/acp-15-6707-2015]

-
Shin, S., Müller, D., Kim, Y., Tatarov, B., Shin, D., Seifert, P., Noh, Y.M., (2013), The retrieval of the Asian dust depolarization ratio in Korea with the correction of the polarization-dependent transmission, Asia-Pacific Journal of Atmospheric Sciences, 49(1), p19-25.
[https://doi.org/10.1007/s13143-013-0003-4]

-
Shin, S., Noh, Y.M., Lee, K., Lee, H., Müller, D., Kim, Y., Kim, K., Shin, D., (2014), Retrieval of the single scattering albedo of Asian dust mixed with pollutants using LIDAR observations, Advances in Atmospheric Sciences, 31(6), p1417-1426.
[https://doi.org/10.1007/s00376-014-3244-y]

- Solomon, S., (2007), Climate change 2007-the physical science basis: Working group I contribution to the fourth assessment report of the IPCC, Cambridge University Press.
-
Tatarov, B., Müller, D., Shin, D.H., Shin, S.K., Mattis, I., Seifert, P., Noh, Y.M., Kim, Y., Sugimoto, N., (2011), LIDAR measurements of Raman scattering at ultraviolet wavelength from mineral dust over East Asia, Optics express, 19(2), p1569-1581.
[https://doi.org/10.1364/oe.19.001569]

-
Wong, M.S., Nichol, J.E., Lee, K.H., (2009), Modeling of aerosol vertical profiles using GIS and remote sensing, Sensors, 9(6), p4380-4389.
[https://doi.org/10.3390/s90604380]

-
Wandinger, U., Ansmann, A., (2002), Experimental determination of the lidar overlap profile with Raman lidar, Applied Optics, 41(3), p511-514.
[https://doi.org/10.1364/ao.41.000511]

-
Yang, M., Howell, S., Zhuang, J., Huebert, B., (2009), Attribution of aerosol light absorption to black carbon, brown carbon, and dust in China-interpretations of atmospheric measurements during EAST-AIRE, Atmospheric Chemistry and Physics, 9(6), p2035-2050.
[https://doi.org/10.5194/acp-9-2035-2009]

