Comparison of Chemical Composition of Particulate Matter Emitted from a Gasoline Direct Injected (GDI) Vehicle and a Port Fuel Injected (PFI) Vehicle using High Resolution Time of Flight Aerosol Mass Spectrometer (HR-ToF-AMS)
Abstract
Particulate matter (PM) in the atmosphere has wideranging health, environmental, and climate effects, many of which are attributed to fine-mode secondary organic aerosols. PM concentrations are significantly enhanced by primary particle emissions from traffic sources. Recently, in order to reduce CO2 and increase fuel economy, gasoline direct injected (GDI) engine technology is increasingly used in vehicle manufactures. The popularization of GDI technique has resulted in increasing of concerns on environmental protection. In order to better understand variations in chemical composition of particulate matter from emissions of GDI vehicle versus a port fuel injected (PFI) vehicle, a high time resolution chemical composition of PM emissions from GDI and PFI vehicles was measured at facility of Transport Pollution Research Center (TPRC), National Institute of Environmental Research (NIER), Korea. Continuous measurements of inorganic and organic species in PM were conducted using an Aerodyne high-resolution time-of-flight aerosol mass spectrometer (HR-ToF-AMS). The HR-ToF-AMS provides insight into nonrefractory PM composition, including concentrations of nitrate, sulfate, hydrocarbon-like and oxygenated organic aerosol, and organic mass with 20 sec time resolution. Many cases of PM emissions during the study were dominated by organic and nitrate aerosol. An overview of observed PM characteristics will be provided along with an analysis of comparison of GDI vehicle versus PFI vehicle in PM emission rates and oxidation states.
Keywords:
PM chemical compositions, Vehicle emission, Gasoline direct injected, Port fuel injected, HR-ToF-AMS1. INTRODUCTION
Particulate matter (PM), which is influenced by vehicle source emissions, is well known for effect of cardiac and respiratory morbidity and mortality (Pope and Dockery, 2006; Samet et al., 2000; Dockery et al., 1993) due to particle size, surface area, and chemical composition (Nel, 2005). Moreover, these PM including natural and anthropogenic contributed to radiative forcing to the solar energy budget, with an estimated global mean radiative forcing as - 0.35 W/m2 (- 0.85 to +0.15 W/m2 with 90% confidence interval) (Myhre et al., 2013). The study from source apportionment of PM2.5 in Seoul indicated that major contributors of PM2.5 mass concentration was gasoline-fueled vehicles as 17% except secondary ions (Heo et al., 2009). It should be noted that the vehicle emission is more important than source from industry, soil, and biomass burning. Moreover the contribution of gasoline-fueled vehicles was 2 times higher than diesel emission (8%), which indicated the emission information of gasoline is more important rather than diesel.
Recently, gasoline direct injected (GDI) engine technology, which directly sprays into the cylinder with higher injection pressures than port fuel injected (PFI) engine, is widely spread in vehicle manufactures to reduce the emissions of cold start unburned hydrocarbons and CO2 (Zhao et al., 1999) and to increase fuel efficiency with increasing of concerns of environmental protection (Liang et al., 2013). However, some studies pointed out GDI engine may emit more PM, because the time for preparing even combustible mixture is short and fuel impingement on surfaces of piston and cylinder happens unexpectedly (Maricq et al., 2012; Myung et al., 2012; Zhao et al., 1999). However, the many studies focused on not a chemical composition, but physical properties such as number concentration, particle size distribution and total mass of PM (Quiros et al., 2015; Choi et al., 2013; Liang et al., 2013; Maricq et al., 2012). However, the enhancing of information about the PM chemical composition emitted from gasoline vehicle is crucial to assess the PM2.5 control strategy.
Therefore, this study make efforts to improve the understanding level of variations in PM chemical composition emitted from GDI vehicle versus PFI vehicle, including organic and inorganic species. To acquire the information of PM which has highly temporal variation, a high time resolution chemical composition measurement of PM emissions from GDI and PFI vehicles using High-Resolution Time-of-Flight Aerosol Mass Spectrometer (Hereafter HR-ToF-AMS). We investigated (1) emission rate of inorganic and organic mass concentrations, (2) variation of PM emission rate depending on the different vehicle speeds, and (3) difference of PM oxidation states between GDI and PFI vehicles.
2. METHODOLOGY
2. 1 TPRC Facility
The study of PM chemical composition from two types (GDI and PFI) were conducted at Transportation Pollution Research Center (TPRC) of the National Institute of Environmental Research (NIER), which is a certifying institute for vehicle exhaust emissions in Korea. All tests were performed in accordance with the World Forum for Harmonization of Vehicle Regulations, an international standard method used by the United Nations Economic Commission for Europe (UNECE).
2. 2 High Resolution Time of Flight Aerosol Mass Spectrometer
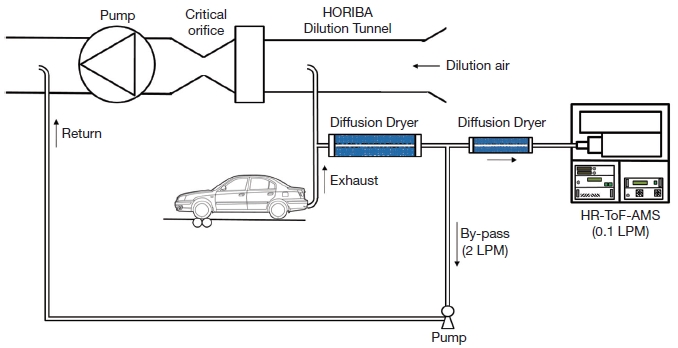
The High Resolution Time of Flight Aerosol Mass Spectrometer (Hereafter, HR-ToF-AMS) contains a high-resolution time-of-flight mass spectrometer that can characterize the elemental composition of the organic carbon content of the PM1. The specific chemical breakdown of the exhaust products provides more insight on the health and environmental effects due to the combustion of different fuels. The exhaust sample passed through diffusion drier and a critical orifice, restricting the flow to 0.1 LPM, before entering the HR-ToF-AMS. Diffusion dryers were used to control sample humidity (<40% RH) (Fig. 1), reducing uncertainties due to bounce-related changes in collection efficiency and reduced particle transmission through the aerodynamic lens. The sample air enters the HR-ToF-AMS through a critical orifice (100 μm pin hole) into an aerodynamic lens, creating a narrow particle beam. The particles are accelerated in the supersonic expansion of gas molecules into vacuum at the end of the aerodynamic lens. Particle packets are selected by chopper for separation as a function of size in the PToF region. Non-refractory particles are vaporized, and the fragments are then ionized and sent through the ToFMS region. The ion flight time to the detector corresponds to a specific mass-to-charge ratio, m/z. The operation of the Aerodyne HR-ToF-AMS has been described in detail elsewhere (DeCarlo et al., 2006; Drewnick et al., 2005; Jimenez et al., 2003; Jayne et al., 2000).
The HR-ToF-AMS was calibrated for nitrate ionization efficiency (IE) through introduction of 350 nm ammonium nitrate particles (typical value IENO3 ~1.53e-07 ions/molecule). Relative ionization efficiencies (RIEs) for other aerosol types were taken from published values (note that RIE of NH4 of 4.5 was measured during nitrate ionization efficiency). The timeline of Composition-Dependent Collection Efficiency (CDCE) was calculated based on HR-ToF-AMS chemical composition and experiments under low humidity conditions and was used for the AMS quantitative analysis (Middlebrook, 2011). The measured CO2 concentration of gas-phase from dilution tunnel in HORIBA was used to correct CO2 concentration every HR-ToF-AMS data point.
Primary data processing will be started with integrating the results of all calibrations, logged events, and background data (air beam, etc.) with raw data to produce the initial unit mass resolution (UMR) data; m/z calibrations, baseline signal, and single ion signal areas are also verified. Primary data processing uses the SQUIRREL program (v1.56) in Igor Pro 6 (WaveMetrics, Lake Oswego, OR), and products include species timelines, average diurnal variations, and the spectra that comprise the PMF input. The secondary data processing addresses error in high-resolution peak shape and assigns fragments to species families using the IGOR-based PIKA program (v1.15). High-resolution mass spectrometry allows discernment between fragments that share the same UMR bin as described earlier.
2. 3 Sampling Methods
We tested direct emission from two types of gasoline vehicles (PFI and GDI) using HR-ToF-AMS. The HR-ToF-AMS was operated under V-mode only. In this study, 20 sec time resolution was used for determining particle composition, including concentrations of nitrate, sulfate, ammonium, and organic matter for the different speeds of GDI and PFI vehicles (10, 3, 80, and 110 km/h). Fig. 1 showed the schematic diagram of experiment setup using HR-ToF-AMS.
3. RESULTS AND DISCUSSION
3. 1 Emission Rates of Organic and Inorganic between GDI and PFI
Fig. 2 showed the emission rates of organic and inorganic compounds for two types of vehicles. The emission rates were calculated from eq. (1).
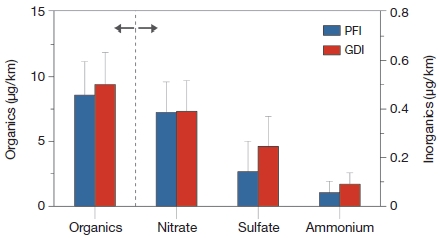
Mean emission rates for organics and inorganics components (nitrate, sulfate and ammonium) from PFI and GDI vehicles.
| (1) |
Where, C and Q denoted mass concentrations of chemical species (μg/m3) for PM measured by HR-ToF-AMS and flow rate (20 m3/min) of dilution tunnel (HORIBA), respectively. S and DF indicated the speed of vehicles (km/h) and dilution factor (unitless quantity). Dilution factor (DF) was obtained from dilution tunnel in HORIBA to calculate the total concentations of organic and inorganic aerosol emitted from vehicles.
The overall mean of emission rate during for GDI was slightly higher than that of PFI as 10.1 μg/km and 9.1 μg/km, respectively. In General, GDI engine emits more PM than PFI engine because of stratified-charge operation (Zhao et al., 1999). Liang et al. (2013) reported that the PFI vehicle’s PM mass and total particle number declined about 76% and 77% from those from the GDI vehicle. However, this study did not show significant decrease in PM emission rate. The portion of organic species for PFI and GDI were similar as ~94% and ~93%, respectively. Though portion of inorganic aerosol was too low compared to organic aerosol, the emission rate of inorganics were different between PFI and GDI. Sulfate and ammonium for GDI were relatively higher than that for PFI, but nitrate did not show any significant difference between PFI and GDI. It is indicated that the GDI engine emitted more ammonium sulfate than PFI, even the emission rate was too small. It should be noted that emission rate of nitrate was higher than sulfate and ammonium in both engine types, because on-road vehicles (including gasoline and diesel engines) mainly emitted NOx that can be converted to particulate nitrate.
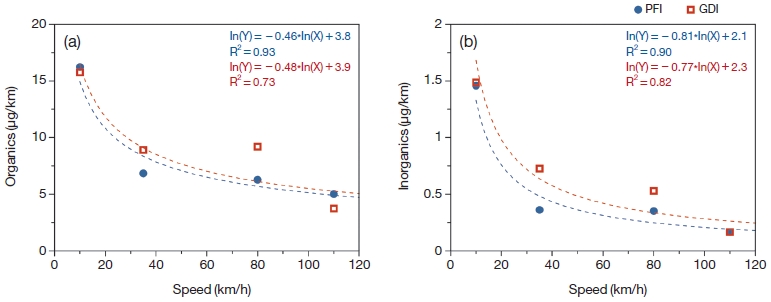
Fig. 3 showed the variation of emission rate for organics and inorganics depending on vehicle speeds. It is interesting that the emission rates of both PFI and GDI were significantly decreased with increasing the speed. The emission rate drastically decreased at low speed of vehicle, especially 10 to 35 km/h, whereas the emission rate for organic and inorganics were slightly decreased as vehicle speed was increased. The equations of power law fitting between emission rate and speed can be helpful to estimate PM emission for the different speeds between PFI and GDI vehicles.
3. 2 Oxidation State of Aerosol from GDI and PFI
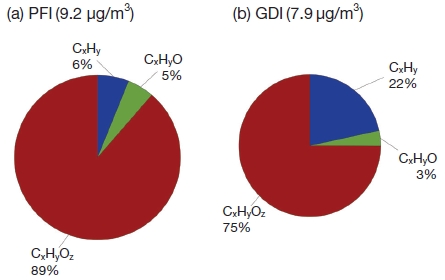
The aerosol oxidation state is important for potential increase of organic mass and of hygroscopic property. HR-ToF-AMS can separate quantification of different ions with the same nominal mass with precise characterization of the elemental composition of each ion (e.g. CxHy+, CxHyO1+, and CxHyOz+). This more intensive information can help for enhancing of understanding about organic compounds in the atmosphere. The mean concentrations of organics were 9.7 μg/m3 and 7.9 μg/m3 for PFI and GDI, respectively. The portion of the oxidized fragment families (CxHyO1+, and CxHyOz+) accounts for ~94% in PFI and ~78% in GDI, while ~6 % and ~22% come from the CxHy+ family in PFI and GDI, respectively (Fig. 4). The relatively high fractions of CxHy in organic aerosol (OA) was emitted from GDI comparing it from PFI. It means that the organic species from GDI are potentially increased with oxidation of PM in atmosphere resulting in the increase of mass concentration.
3. 3 Van Krevelen-triangle Diagram from GDI and PFI
To identify the reasonable factors, the organic components in the triangle plot are transformed into the Van Krevelen diagram that can indicate bulk changes in oxygenation in ambient datasets and may be used to explore reaction mechanisms in isolated air masses (Fig. 5). Ng et al. (2011) reported that Van Krevelen space which divided ΔH : C/ΔO : C slope suggests that ambient oxidized organic components aging results in net changes in chemical composition that are equivalent to the addition of both acid and alcohol/peroxide functional groups without fragmentation (i.e. C-C bond breakage), and/or the addition of acid groups with fragmentation.
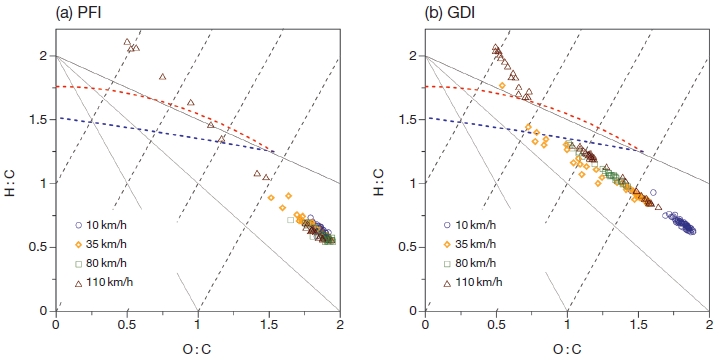
Van Krevelen-triangle diagram for the organic components from organics with HR-AMS data for (a) PFI and (b) GDI. Each symbol indicated emitted organic components at specific speed.
On the Van Krevelen-triangle diagram, the data position in the apex of the triangle space (higher O : C and lower H : C) indicates highly oxidized particles consistent with other ambient datasets (Ng et al., 2011). Hydrocarbon-like organic components locates 1.5-2 for H : C and 0-0.4 for O : C. Semi-volatile oxidized organic components occupy 1.3-1.6 for H : C and 0.1-0.6 for O : C, while less-volatile oxidized organic components are more oxidized with lower H : C than semi-volatile oxidized organic components as 1.2-1.5 (Aiken et al., 2008; Aiken et al., 2007). In van Krevelen-triangle diagram, distribution of organic components from PFI and GDI showed distinct pattern. Organic components from PFI were mainly distributed in high O : C and low H : C, however, that from GDI were spread over the van Krevelen-triangle diagram, reflecting organic component from PFI was more oxidized that than from GDI as described in section 3.2. It should be noted that the organic components from PFI at less than 80 km/h were mainly more oxidized organics, and the less oxidized organics were emitted at high speed, 110 km/h. For GDI, organic components at low speed (10 km/h) were composed of more oxidized organics, however, the less oxidized organic were gradually increased with increasing the speed. The organic mass emitted from PFI vehicles are hardly increased in ambient due to fully oxidized organic components at the most of speeds, while organic mass emitted from GDI can be potentially increased in ambient by further oxidation process of relatively less oxidized organic aerosol at the most of speeds (Fig. 5).
4. SUMMARY AND CONCLUSION
This study focused on investigation in difference of emission rates for organic and inorganic components and oxidation states of PM between port fuel injected (PFI) and gasoline direct injected (GDI) vehicles using HR-ToF-AMS. The mean emission rates for GDI (10.1 μg/km) was slightly higher than that for PFI (9.1 μg/km) because of stratified-charge operation. The organic components took a high portion in both PFI and GDI, as ~94 and ~93%, respectively. Among the inorganic components, nitrate concentration showed highest in both PFI and GDI because on-road vehicles mainly emitted NOx which can be converted to nitrate by photochemical reaction. The variation of emission rate depending on vehicle speed indicated that emission rates for organics and inorganics components were significantly decreased from 10 to 35 km/h in both PFI and GDI vehicles. As increasing the vehicle speed, the magnitude of decline trend for organic and inorganic components were slow down. The power law fitting for PFI and GDI in both organic and inorganics showed high coefficients of determination (R2) as up to 0.93. The oxidation state of organic components showed distinct pattern between PFI and GDI, indicating more oxidized organic components (CxHyO1+, and CxHyOz+) were mainly emitted from PFI. From van Krevelen-triangle diagram, organic components from PFI at less than 80 km/h were mainly more oxidized organics and the less oxidized organics components were emitted at high speed (110 km/h). Whereas organic components from GDI at low speed (10 km/h) were composed of more oxidized organics, however, the less oxidized organic were gradually increased with increasing the speed. These findings provide important implications for better evaluating impacts of transportation sources on nearroadway pollution and designing better strategies for the control of particulate matter derived from vehicles.
Acknowledgments
The authors thank the research scientists at Transportation Pollution Research Center, National Institute of Environmental Research (Korea) for their contributions to the success of the study. Data analysis and additional data processing were supported by a Grant from the Hankuk University of Foreign Studies Research Fund of 20151084001.
REFERENCES
-
Aiken, A.C., DeCarlo, P.F., Jimenez, J.L., (2007), Elemental Analysis of Organic Species with Electron Ionization High-Resolution Mass Spectrometry, Analytical Chemistry, 79, p8350-8358.
[https://doi.org/10.1021/ac071150w]

-
Aiken, A.C., Decarlo, P.F., Kroll, J.H., Worsnop, D.R., Huffman, J.A., Docherty, K.S., Ulbrich, I.M., Mohr, C., Kimmel, J.R., Sueper, D., (2008), O/C and OM/OC ratios of primary, secondary, and ambient organic aerosols with high-resolution time-of-flight aerosol mass spectrometry, Environmental Science & Technology, 42, p4478-4485.
[https://doi.org/10.1021/es703009q]

-
Choi, K., Kim, J., Ko, A., Myung, C.-L., Park, S., Lee, J., (2013), Size-resolved engine exhaust aerosol characteristics in a metal foam particulate filter for GDI lightduty vehicle, Journal of Aerosol Science, 57, p1-13.
[https://doi.org/10.1016/j.jaerosci.2012.11.002]

-
DeCarlo, P.F., Kimmel, J.R., Trimborn, A., Northway, M.J., Jayne, J.T., Aiken, A.C., Gonin, M., Fuhrer, K., Horvath, T., Docherty, K.S., (2006), Field-deployable, high-resolution, time-of-flight aerosol mass spectrometer, Analytical Chemistry, 78, p8281-8289.
[https://doi.org/10.1021/ac061249n]

-
Dockery, D.W., Pope, C.A., Xu, X., Spengler, J.D., Ware, J.H., Fay, M.E., Ferris, B.G., Speizer, F.E., (1993), An Association between Air Pollution and Mortality in Six U.S. Cities, New England Journal of Medicine, 329, p1753-1759.
[https://doi.org/10.1056/nejm199312093292401]

-
Drewnick, F., Hings, S.S., DeCarlo, P., Jayne, J.T., Gonin, M., Fuhrer, K., Weimer, S., Jimenez, J.L., Demerjian, K.L., Borrmann, S., (2005), A new time-of-flight aerosol mass spectrometer (TOF-AMS)-Instrument description and first field deployment, Aerosol Science and Technology, 39, p637-658.
[https://doi.org/10.1080/02786820500182040]

- Heo, J.B., Hopke, P.K., Yi, S.M., (2009), Source apportionment of PM2.5 in Seoul, Korea, Atmospheric Chemistry and Physics, 9, p4957-4971.
-
Jayne, J.T., Leard, D.C., Zhang, X., Davidovits, P., Smith, K.A., Kolb, C.E., Worsnop, D.R., (2000), Development of an aerosol mass spectrometer for size and composition analysis of submicron particles, Aerosol Science & Technology, 33, p49-70.
[https://doi.org/10.1080/027868200410840]

-
Jimenez, J.L., Jayne, J.T., Shi, Q., Kolb, C.E., Worsnop, D.R., Yourshaw, I., Seinfeld, J.H., Flagan, R.C., Zhang, X., Smith, K.A., (2003), Ambient aerosol sampling using the aerodyne aerosol mass spectrometer, Journal of Geophysical Research: Atmospheres (1984-2012), 108.
[https://doi.org/10.1029/2001JD001213]

-
Liang, B., Ge, Y., Tan, J., Han, X., Gao, L., Hao, L., Ye, W., Dai, P., (2013), Comparison of PM emissions from a gasoline direct injected (GDI) vehicle and a port fuel injected (MPI) vehicle measured by electrical low pressure impactor (ELPI) with two fuels: Gasoline and M15 methanol gasoline, Journal of Aerosol Science, 57, p22-31.
[https://doi.org/10.1016/j.jaerosci.2012.11.008]

-
Maricq, M.M., Szente, J.J., Jahr, K., (2012), The Impact of Ethanol Fuel Blends on PM Emissions from a Light-Duty GDI Vehicle, Aerosol Science and Technology, 46, p576-583.
[https://doi.org/10.1080/02786826.2011.648780]

- Middlebrook, A.M., Bahreini, R., Jimenez, J.L., Canagaratna, M.R., (2011), Evaluation of composition-dependent collection efficiencies for the Aerodyne aerosol mass spectrometer using field data, Aerosol Science and Technology, 46, p258-271.
- Myhre, G., Shindell, D., Bréon, F.-M., Collins, W., Fuglestvedt, J., Huang, J., Koch, D., Lamarque, J.-F., Lee, D., Mendoza, B., Nakajima, T., Robock, A., Stephens, G., Takemura, T., Zhang, H., (2013), Anthropogenic and natural radiative forcing, in Climate Change 2013: The Physical Science Basis. Contribution Of Working Group I To The Fifth Assessment Report of the Intergovernmental Panel On Climate Change, Stocker, T.F., Qin, D., Plattner, G.-K., Tignor, M., Allen, S.K., Boschung, J., Nauels, A., Xia, Y., Bex, V., and Midgley, P.M. Eds), Cambridge University Press, Cambridge, United Kingdom and New York, NY, USA.
-
Myung, C.-L., Kim, J., Choi, K., Hwang, I.G., Park, S., (2012), Comparative study of engine control strategies for particulate emissions from direct injection lightduty vehicle fueled with gasoline and liquid phase liquefied petroleum gas (LPG), Fuel, 94, p348-355.
[https://doi.org/10.1016/j.fuel.2011.10.041]

- Nel, A., (2005), Air Pollution-Related Illness: Effects of Particles, Science, 308, p804-806.
-
Ng, N.L., Canagaratna, M.R., Jimenez, J.L., Chhabra, P.S., Seinfeld, J.H., Worsnop, D.R., (2011), Changes in organic aerosol composition with aging inferred from aerosol mass spectra, Atmospheric Chemistry and Physics, 11, p6465-6474.
[https://doi.org/10.5194/acpd-11-7095-2011]

-
Pope, C.A., Dockery, D.W., (2006), Health Effects of Fine Particulate Air Pollution: Lines that Connect, Journal of the Air & Waste Management Association, 56, p709-742.
[https://doi.org/10.1080/10473289.2006.10464485]

-
Quiros, D.C., Hu, S., Hu, S., Lee, E.S., Sardar, S., Wang, X., Olfert, J.S., Jung, H.S., Zhu, Y., Huai, T., (2015), Particle effective density and mass during steady-state operation of GDI, MPI, and diesel passenger cars, Journal of Aerosol Science, 83, p39-54.
[https://doi.org/10.1016/j.jaerosci.2014.12.004]

-
Samet, J.M., Dominici, F., Curriero, F.C., Coursac, I., Zeger, S.L., (2000), Fine Particulate Air Pollution and Mortality in 20 U.S. Cities, 1987-1994, New England Journal of Medicine, 343, p1742-1749.
[https://doi.org/10.1056/nejm200012143432401]

-
Zhao, F., Lai, M.C., Harrington, D.L., (1999), Automotive spark-ignited direct-injection gasoline engines, Progress in Energy and Combustion Science, 25, p437-562.
[https://doi.org/10.1016/s0360-1285(99)00004-0]

