Atmospheric Polycyclic and Nitropolycyclic Aromatic Hydrocarbons in an Iron-manufacturing City
Abstract
Total suspended particulates (TSP) in the atmosphere were collected for 2 weeks during winter in Muroran, Hokkaido, Japan, a typical iron-manufacturing city. The concentrations of polycyclic aromatic hydrocarbons (PAHs) and nitropolycyclic aromatic hydrocarbons (NPAHs) in TSP were determined by high-performance liquid chromatography (HPLC) using fluorescence and chemiluminescence detectors, respectively. No relationship was observed between the atmospheric PAH and NPAH concentration, or the atmospheric PAH and TSP concentration. However, there was a tendency that the atmospheric PAH concentration was higher when the wind blew from the coke-oven plant. Furthermore, the concentration ratios of 1-nitropyrene to pyrene, which is a suitable indicator of the contribution made by automobiles and coal combustion systems to urban air particulates, were smaller in Muroran and the values were close to those observed in particulates from coal combustion systems. Therefore, these results show that the PAH and NPAH compositions for Muroran are characteristic of an iron-manufacturing city.
Keywords:
Polycyclic aromatic hydrocarbon, Nitropolycyclic aromatic hydrocarbon, Airborne particulates, Coke-oven plant, Iron manufacture1. INTRODUCTION
Polycyclic aromatic hydrocarbons (PAHs) and nitropolycyclic aromatic hydrocarbons (NPAHs), which are mainly formed during the incomplete combustion of organic matter such as coal, oil and wood, are ubiquitous environmental pollutants. Several PAHs and NPAHs such as benzo[a]pyrene and 1-nitropyrene are carcinogenic or probably carcinogenic to humans (IARC, 2014). Moreover, some of these pollutants cause endocrine disruption or produce reactive oxygen species (Motoyama et al., 2009; Hayakawa et al., 2007; Kizu et al., 2004, 2000; Hirose et al., 2001).
We have previously predicted an increase in NPAH-to-PAH concentration ratios ([NPAH]/[PAH]) in combustion particulates based on the theory that both the formation of nitrogen oxides and the nitration of PAHs are dependent on the combustion temperature (Tang et al., 2005). The temperatures of coal stoves and automobile engines are respectively 1,100-1,200°C and 2,700-3,000°C, and the 1-nitropyrene to pyrene ([1-NP]/[Pyr]) ratio for particulates from coal-burning stoves/boilers (8×10⁻⁴ to 6×10⁻³) is smaller than that for particulates from automobile engines (0.36) by two orders of magnitude or more. Total suspended particulates (TSP) have been collected in Japan, China, Korea and Russia since the 1990s and coal heating systems were identified as the main contributor in Shenyang, Tieling and Fushun during winter because of their smaller [1-NP]/[Pyr] ratios (1-6×10⁻² in winter 2002-2003) (Hattori et al., 2007). In contrast, automobiles were the main contributor in Kanazawa because of the larger [1-NP]/[Pyr] ratio (from 0.19 in winter 1997 to 0.11 in winter 2005) (Hama et al., 2012).
Ironworks, which have coke-oven plants and blast furnaces, consume a large amount of coal and emit PAHs (Yang et al., 2002). There are several iron manufacturing cities in Japan, such as Muroran and Kitakyushu. However, the NPAHs in TSP have not yet been determined and the [NPAH]/[PAH] ratios are not known for these cities. The purpose of this study is to clarify the atmospheric characteristics of Muroran as a typical iron-manufacturing city with respect to PAHs and NPAHs.
2. EXPERIMENTAL
2. 1 Muroran City and Sampling
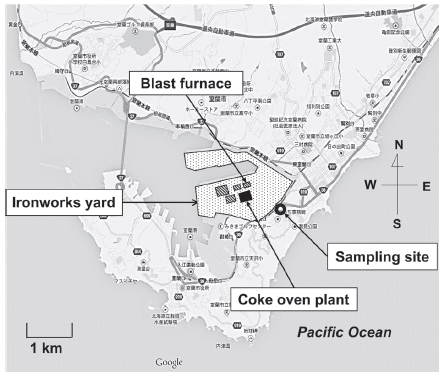
Muroran City (latitude 42°18′55″, longitude 140°58′ 27″) is located in the central part of Hokkaido, Japan. The population and registered number of automobiles in Muroran in 2008 were 96,552 and 42,492, respectively. There is an ironworks yard (lot area 8,200,000 m2 iron production 1,370,000 ton in 2007) in the central part of the city that has a coke-oven plant and a blast furnace. The TSP sampling station was situated in a residential area, 0.1 km south-west of the border of the yard (Fig. 1). This station was on the leeward side of the winter prevailing wind (northwest) from the yard. TSP were collected using a high-volume air sampler (Kimoto Electric Company Limited, Osaka, Japan) equipped with a quartz fiber filter (2500QAT-UP, Pallflex Products, Putnam, CT, U.S.A.) with an air flow rate of 1.0 m3 min-1. The filter was replaced every day and 14 samples were obtained in the period from January 30 to February 12, 2009. Meteorological conditions such as temperature, sunlight, precipitation, wind speed and direction during the sampling period are described in Table 1. The filters were dried overnight in the dark at room temperature. After weighing, the filters were kept in sealed plastic bags and stored at - 20°C until use.
2. 2 Chemicals
EPA 610 Polycyclic Aromatic Hydrocarbon mix includes fluoranthene (FR), Pyr, benz[a]anthracene (BaA), chrysene (Chr), benzo[b]fluoranthrene (BbF), benzo[k] fluoranthrene (BkF), benzo[a]pyrene (BaP), benzo[ghi] perylene (BghiPe) and indeno[1,2,3-cd]pyrene (IDP) was purchased from Supelco Park (Bellefonte, PA, U.S.A). Deuterated Pyr (Pyr-d10) and BaP (BaP-d12), internal standards for PAHs were purchased from Supelco Park and Wako Pure Chemicals (Osaka, Japan), respectively. 1,3-, 1,6-, 1,8-Dinitropyrens (DNPs), 1-, 3-nitrofluoranthenes (NFRs), 1-, 2-, 4-NPs, 6-nitrochrysene (NC) and 6-nitrobenzo[a]pyrene (6-NBaP) were purchased from Chiron AS (Trondheim, Norway). Deuterated 1-nitropyrene (1-NP-d9) and 2-fluoro-7-nitrofluorene (FNF) internal standards for NPAHs were obtained from Sigma-Aldrich Japan (Osaka, Japan). All organic solvents used here were special reagent grade. Milli-Q purified water was also used in this experiment. All other chemicals used were of analytical reagent grade.
2. 3 Sample Pretreatments
An area (2×4 cm2) of each filter containing TSP was cut into small pieces (ca. 5×5 mm2). The pieces were placed in a flask and mixed with an aliquot of an ethanol solution containing internal standards (Pyr-d10, BaP-d10, 1-NP-d9 and FNF) and benzene/ethanol (3 : 1 v/v). The flask was shaken and treated with ultrasonic waves to extract PAHs and NPAHs. The extracts were washed successively with diluted sodium hydroxide solution, diluted sulfuric acid solution, and water. After the benzene/ethanol solution was evaporated to dryness, the residue was dissolved in acetonitrile.
2. 4 HPLC
Aliquots of the solution were then injected into a high-performance liquid chromatography (HPLC) system for the quantification of PAHs and NPAHs. Other conditions were the same as in our previous reports (Hayakawa et al., 1995; Hayakawa et al., 1991). PAHs and NPAHs were determined using HPLC with fluorescence and chemiluminescence detectors, respectively, according to our reports (Pham et al., 2013; Hayakawa et al., 2011, 2001; Tang et al., 2005).
2. 5 Quality Assurance and Quality Control
All 9 PAHs were quantified in the 14 TSP samples collected in Muroran. However, 7-NBaA was not detected in 5 samples. 6-NC was detected but at less than the limit of quantification (LOQ) (4.8 fmol m-3) in 3 samples. 1,6-DNP was detected but at less than the LOQ (0.2 fmol m-3) in 3 samples. When NPAH was not detected, zero fmol m-3 was used for the calculation of the mean concentration. When NPAH was detected but its concentration was less than the LOQ, 1/2 of the LOQ was used for the calculation of the mean concentration.
The analytical data for atmospheric PAHs and NPAHs obtained from Kanazawa during winter, 2010, are cited from our previous report (Hama et al., 2012) for comparison. Kanazawa is a typical commercial city where the main contributor of PAHs and NPAHs is automobiles.
3. RESULTS AND DISCUSSION
3. 1 TSP, PAH and NPAH Concentrations and Effects of Meteorological Conditions
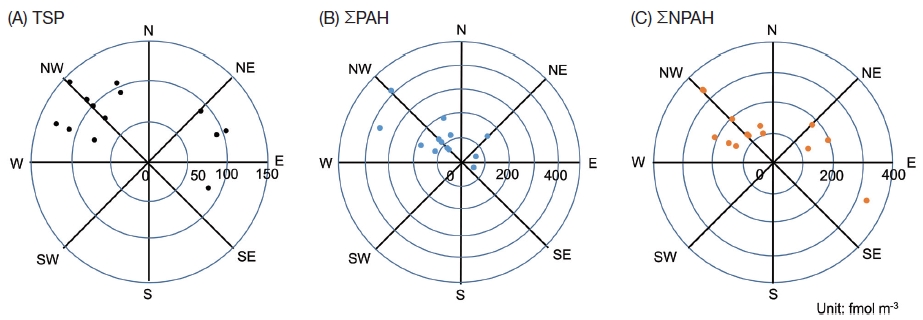
The climatological mean prevailing wind in winter is from the northwest in Muroran, and the wind was from the west-northwest to north-northwest for 10 of the 14 sampling days (Table 1). When this prevailing wind blew, the station was located on the leeward of the ironworks yard. Concentrations of 9 PAHs, 7 NPAHs and TSP for 14 sampling days are listed in Table 2. The TSP concentration was not dependent on the wind direction (Fig. 2(A)). The 4 highest total PAH (ΣPAH) concentration days (Feb. 1, 3, 7 and 8 in Table 2) were when the prevailing wind blew. ΣPAH concentrations in days with winds from west-northwest to north-northwest were different statistically from ΣPAH concentrations in the other days (p=0.03 by the Wilcoxon rank sum test) (Fig. 2(B)). However, the 2 highest total NPAH (ΣNPAH) concentration days (Feb. 8 and 11 in Table 2) were not only when the northwest wind blew, but also when the east-southeast wind blew (Fig. 2(C)). These results suggest that Muroran had several sources of PAHs and/or NPAHs.

Relationship between concentrations of (A) TSP, (B) ΣPAH and (C) ΣPAH and wind direction. ΣPAH=FR+Pyr+BaA +Chr+BbF+BkF+BaP+BghiPe+IDP. ΣNPAH=1,3-DNP+1,6-DNP+1,8-DNP+1-NP+6-NC+6-NBaP. E: east, W: west, S: south, N: north.
Table 3 shows correlation between the TSP, PAH and NPAH concentrations and meteorological variables presented in Table 1 and 2, except for wind direction. Significant correlations were observed between sunlight and TSP concentration (r=0.78, p<0.05), and between wind speed and ΣPAH concentration (r=0.75, p<0.05). Among the correlations between temperature (daily maximum, minimum and mean), humidity (daily maximum, minimum and mean) and daily TSP, ΣPAH, ΣNPAH concentrations (ranging from - 0.57 to 0.46), a weak negative correlation was observed only between humidity and TSP. No significant correlations were observed between TSP and ΣPAH (r=0.36, p=0.20), TSP and ΣNPAH (r=0.34, p=0.27), or ΣPAH and ΣNPAH (r=0.25, p=0.37).

Correlation coefficients between TSP, ΣPAH and ΣNPAH concentrations and meteorological parameters in Table 1.
There are several possible reasons for the correlations between wind speed and ΣPAH, and between sunlight and TSP (Table 3). The highest 4 wind speed days (Feb. 1, 3, 7 and 8 in Table 1) were when the prevailing wind blew (Fig. 2) and these days showed high ΣPAH concentrations. A large emission source at a windward side might explain the correlation between wind speed and ΣPAH when a strong wind blew. The TSP concentration is known to increase near the ground due to the formation of an inversion layer during winter nights with fine weather.
3. 2 Characteristics of Atmospheric PAH and NPAH Concentrations in Muroran
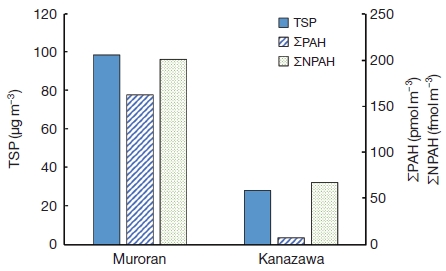
Table 4 shows the maximum, minimum and mean concentrations of TSP, PAHs and NPAHs calculated from Table 1. The mean concentrations of ΣPAH (=FR+Pyr+BaA+Chr+BbF+BkF+BaP+BghiPe+IDP) and ΣNPAH (=1,3-DNP+1,6-DNP+1,8-DNP+1-NP+6-NC+6-NBaP) for Muroran were calculated and compared to those for Kanazawa. Fig. 3 shows that the mean concentrations of TSP, ΣPAH and ΣNPAH for Muroran were all higher than those for Kanazawa. Among PAHs and NPAHs, atmospheric standards or guidelines for the the annual average of BaP (from 0.25 to 1 nmol m-3) have been set in England, other European countries, New Zealand, and China; however, they have not yet been set in Japan (Ministry of Environment, 2010). The concentrations of BaP (Max. 34.8 pmol m-3, Min. 2.1 pmol m-3, and mean 11.3±10.7 pmol m-3) for Muroran (Table 4) were much lower than those specified as hazardous for human health in the atmospheric standards or guidelines.

Atmospheric concentrations of TSP, PAHs and NPAHs in Muroran and Kanazawa. ΣPAH=FR+Pyr+BaA+Chr+BbF+BkF+BaP+BghiPe+IDP. ΣNPAH=1,3-DNP+1,6-DNP+1,8-DNP+1-NP+6-NC+6-NBaP.
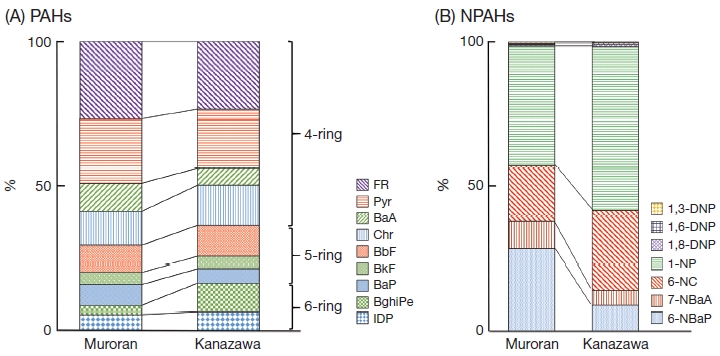
Fig. 4 shows that the most highly concentrated PAHs and NPAHs were FR and 1-NP, respectively. The PAH concentrations decreased with increasing ring number (4-rings>5-rings>6-rings). These results are the same as those for Kanazawa. There was a small difference in the order of several PAHs and NPAHs. For example, the decreasing order of PAHs was BaP>BghiPe in Muroran, but BghiPe>BaP for Kanazawa (Fig. 4A), and the decreasing order of NPAHs was 6-NBaP>6-NC in Muroran, but 6-NC>6-NBaP for Kanazawa (Fig. 4B). Considering that these small differences in the PAH and NPAH compositions were often observed in 3 other Japanese commercial cities (Toyama, Tokyo and Sapporo), as reported previously (Tang et al., 2002; Kakimoto et al., 2002, 2000), it seems difficult to elucidate the characteristics of Muroran from the concentration order of PAHs or NPAHs.
We have previously reported that the NPAH-to-PAH concentration ratios ([NPAH]/[PAH]) are useful markers for identifying their sources because the formation of NOx and the nitration of PAHs are dependent on the combustion temperatures for organic materials (Tang et al., 2005). The combustion temperatures of a coal stove and an automobile engine are 1,100-1,200°C and 2,700-3,000°C, respectively. The [1-NP]/[Pyr] ratios of particulates from coal stoves (0.00078-0.0063) and automobiles (0.36) were significantly different by around two orders of magnitude or more (Tang et al., 2005). The [6-NC]/[Chr] and [7-NBaA]/[BaA] ratios in coal-stove particulates were also much smaller than those in automobile exhaust particulates (Hattori et al., 2007). The [1-NP]/[Pyr] and [6-NBaP]/[BaP] ratios were used to identify the major contributors in several cities in China and Japan; coal burning systems were determined as the main source in Shenyang, Tieling and Fushung, while automobiles were the main source in Kanazawa (Tang et al., 2012). These results suggest that the [NPAH]/[PAH] ratios may be a useful marker to clarify the TSP characteristics of Muroran.
Combustion temperatures for coke production from coal in a coke oven plant (ca. 1,200°C) and for iron smelting using coke in a blast furnace (ca. 2,000°C) (Mitsubishi-Kagaku, 2015; Kanoshima, 2010) are much lower than that for automobile engines, which results in smaller [NPAH]/[PAH]) ratios than those for automobiles. In this report, the [1-NP]/[Pyr] ratio for Muroran (3.1×10⁻³) was in the range of that for coal combustion particulates (0.78-6.3×10⁻³) and was much smaller than that for Kanazawa (3.0×10⁻²) (p<0.05) (Table 5). The other [NPAH]/[PAH] ratios, [6-NC]/[Chr] and [7-NBaA]/[BaA], for Muroran were also smaller than those for Kanazawa (p<0.05), except for [6-NBaP]/[BaP]. The [6-NBaP]/[BaP] ratio was no difference statistically between Muroran and Kanazawa because both substances were not stable. Particulates exhausted from a coal stove with a combustion temperature lower than that for an automobile engine contain higher concentrations of PAHs and lower concentrations of NPAHs than particulates exhausted from automobiles; therefore, these results suggest that TSP for Muroran with high concentrations of PAHs and lower concentrations of NPAHs (Fig. 3) are characteristic of iron manufacturing using coal.

Concentration ratios of PAHs and NPAHs in airborne particulates at Muroran and Kanazawa calculated from Table 2 with several kinds of combustion particulates.
The concentration ratios of several PAH pairs have also been reported for the identification of sources, although the theoretical basis of these associations is not completely clear. For example, the [FR]/[Pyr], [BaA]/[BaA+Chr], [BaP]/[BghiPe] and [IDP]/[IDP+BghiPe] ratios were different for particulates exhausted from vehicles, gasoline exhaust, coal, coke oven and wood combustion (Caricchia et al., 1999; Simcik et al., 1999; Khalili et al., 1995; Rogge et al., 1993; Sicre et al., 1987; Harrison et al., 1981; Daisey et al., 1979). Table 5 shows that the [BaA]/[BaA+Chr], [BaP]/[BghiPe] and [IDP]/[IDP+BghiPe] ratios for Muroran were larger than those for Kanazawa by factors of 4.0 ([BaP]/[BghiP]) to 1.5 ([BaA]/[BaA+Chr]) (p<0.05). The [BaP]/[BghiPe] ratio (=1.9) for Muroran was smaller than that for coke combustion particulates (5.1), but in the range of that for coal combustion particulates (0.9-6.6). However, the characteristics of TSP for Muroran could not be obtained from the [FR]/[FR+Py] and [BaP]/ [BaP+Chr] ratios. These results may support the conclusion obtained based on the [NPAH]/[PAH] ratios, that the main source of PAHs in Muroran is not automobiles but iron manufacturing.
4. CONCLUSION
TSP samples were collected during winter in Muroran, a typical iron manufacturing city, and 9 PAHs and 7 NPAHs were determined. Their compositions were compared with those of TSP samples collected in Kanazawa, a local commercial city where the major TSP contributor was automobiles. The following characteristics for an iron-manufacturing city were observed:
- 1. There was a tendency to observe high PAH concentrations on fine days when the wind came from the ironworks.
- 2. The [1-NP]/[Pyr], [6-NC]/[Chr], [7-NBaA]/[BaA] and [6-NBaP]/[BaP] ratios for Muroran were smaller than those for cities where the major TSP contributor was automobiles.
- 3. The [BaA]/[Chr], [BaP]/[BghiPe] and [IDP]/[IDP+BghiPe] ratios for Muroran were larger than those for cities where the major TSP contributor was automobiles.
Acknowledgments
This research was supported in part by a Grant-in-Aid for Scientific Research from the Ministry of Education, Culture, Sports, Science and Technology of Japan (No. 21256001).
REFERENCES
- Caricchia, A.M., Chiavarini, S., Pezza, M., (1999), Polycyclic aromatic hydrocarbons in the urban atmospheric particle matter in the city of Naples (Italy), Atmospheric Environment, 33, p3731-3738.
- Daisey, J.M., Leyko, M.A., Kneip, T.J., (1979), Source identification and allocation of polynuclear aromatic hydrocarbon compounds in the New York City aerosol: methods and applications, In: Jones, P.W., Leber, P. (Eds), Polynuclear aromatic hydrocarbons, Ann Arbor Science, Ann Arbor, p201-215.
- Hama, H., Tokuda, T., Izaki, A., Ohno, T., Watanabe, Y., Kanda, T., Tang, N., Kameda, T., Toriba, A., Hayakawa, K., (2012), Variation in polycyclic aromatic hydrocarbons and nitropolycyclic aromatic hydrocarbons in airborne particulates collected in urban Kanazawa, Japan in last 12 years, Journal of Japan Society of Atmospheric Environment, 47, p1-8.
-
Harrison, R.M., Smith, D.J.T., Luhana, L., (1996), Source apportionment of atmospheric polycyclic aromatic hydrocarbons collected from an urban location in Birmingham, UK, Environmental Science and Technology, 30, p825-832.
[https://doi.org/10.1021/es950252d]

- Hattori, T., Tang, N., Tamura, K., Hokoda, A., Yang, X.-Y., Igarashi, K., Ohno, M., Okada, Y., Toriba, A., Hayakawa, K., (2007), Profiles of particulate-bound polycyclic aromatic hydrocarbons and their nitrated derivatives in three typical cities, Liaoning Province, China, Environmental Forensics, 8, p165-172.
-
Hayakawa, K., Kitamura, R., Butoh, M., Imaizumi, N., Miyazaki, M., (1991), Determination of diamino- and aminopyrenes by high performance liquid chromatography with chemiluminescence detection, Analytical Sciences, 7, p573-577.
[https://doi.org/10.2116/analsci.7.573]

-
Hayakawa, K., Murahashi, T., Butoh, M., Miyazaki, M., (1995), Determination of 1,3-, 1,6-, and 1,8-dinitropyrenes and 1-nitropyrene in urban air by high-performance liquid chromatography using chemiluminescence detection, Environmental Science and Technology, 29, p928-932.
[https://doi.org/10.1021/es00004a012]

-
Hayakawa, K., Onoda, Y., Tachikawa, C., Hosoi, S., Yoshida, M., Chung, S.W., Kizu, R., Toriba, A., Kameda, T., Tang, N., (2007), Estrogenic/antiestrogenic activities of polycyclic aromatic hydrocarbons and their monohydroxylated derivatives by yeast two-hybrid assay, Journal of Health Sciences, 53, p562-570.
[https://doi.org/10.1248/jhs.53.562]

-
Hayakawa, K., Tang, N., Sato, K., Izaki, A., Tatematsu, M., Hama, H., Li, Y., Kameda, T., Toriba, A., (2011), Development of HPLC determination method for trace levels of 1-, 2-nitropyrenes and 2-nitrofluoranthene in airborne particulates and its application to samples collected at Noto Peninsula, Asian Journal of Atmospheric Environment, 5, p146-151.
[https://doi.org/10.5572/ajae.2011.5.3.146]

-
Hirose, T., Morito, K., Kizu, R., Toriba, A., Hayakawa, K., Ogawa, S., Muramatsu, M., Masamune, Y., (2001), Estrogenic/antiestrogenic activities of benzo[a]pyrene monohydroxy derivatives, Journal of Health Science, 47, p552-558.
[https://doi.org/10.1248/jhs.47.552]

- IARC, (2014), IARC monographs on the evaluation of the carcinogenic risks to humans, Last update: 31 March 2014.
-
Kakimoto, H., Kitamura, M., Matsumoto, Y., Sakai, S., Kanoh, F., Murahashi, T., Akutsu, K., Kizu, R., Hayakawa, K., (2000), Comparison of atmospheric polycyclic aromatic hydrocarbons and nitropolycyclic aromatic hydrocarbons in Kanazawa, Sapporo and Tokyo, Journal of Health Sciences, 46, p5-15.
[https://doi.org/10.1248/jhs.46.5]

-
Kakimoto, H., Matsumoto, Y., Sakai, S., Kanoh, F., Arashidani, K., Tang, N., Akutsu, K., Nakajima, A., Awata, Y., Toriba, A., Kizu, R., Hayakawa, K., (2002), Comparison of atmospheric polycyclic aromatic hydrocarbons and nitropolycyclic aromatic hydrocarbons in an industrialized city (Kitakyushu) and two commercial cities (Sapporo and Tokyo), Journal of Health Sciences, 48, p370-375.
[https://doi.org/10.1248/jhs.48.370]

- Kanoshima, H., (2010), Historic development of blast furnace technologies in collection of technical systematization No. 15, published by National Science Museum, p81-159, last access date, Jan. 5, 2016.
-
Khalili, N.R., Scheff, P.A., Holsen, T.M., (1995), PAH source fingerprints for coke ovens, diesel and, gasoline engines, highway tunnels, and wood combustion emissions, Atmospheric Environment, 29, p533-542.
[https://doi.org/10.1016/1352-2310(94)00275-p]

-
Kizu, R., Ishii, K., Kobayashi, J., Hashimoto, T., Koh, E., Namiki, M., Hayakawa, K., (2000), Antiandrogenic effect of crude extract of C-heavy oil, Materials Science and Engineering: C, 12, p97-102.
[https://doi.org/10.1016/s0928-4931(00)00165-x]

-
Kizu, R., Otsuki, N., Kishida, Y., Toriba, A., Mizokami, A., Burnstein, K.L., Klinge, C.B., Hayakawa, K., (2004), A new luciferase reporter gene assay for the detection of androgenic and antiandrogenic effects based on human prostate specific antigen promoter and PC3/AR human prostate cancer cells, Analytical Sciences, 20, p55-59.
[https://doi.org/10.2116/analsci.20.55]

- Ministry of Environment, Japan, (2010), Review of the priority action for environmental pollutants, http://www.env.go.jp/council/former013/07air/y073-10/ref02_2.pdf, last access date, Jan. 5, 2016.
- Mitsubishi-Kagaku, Chemicals/carbon products: Coke, (2015), http://www.m-kagaku.co.jp/grproduct/company/mcc/carbon/product/1194329_4414.html?category=chemical last access date, Jan. 5, 2016.
-
Motoyama, Y., Bekki, K., Chung, S.-W., Tang, N., Kameda, T., Toriba, A., Taguchi, K., Hayakawa, K., (2009), Oxidative stress more strongly induced by ortho- than para-quinoid polycyclic aromatic hydrocarbons in A549 cells, Journal of Health Sciences, 55, p845-850.
[https://doi.org/10.1248/jhs.55.845]

- Pham, C. T., Kameda, T., Toriba, A., Hayakawa, K., (2013), Polycyclic atmospheric polycyclic hydrocarbons and nitropolycyclic aromatic hydrocarnons in particulates emitted by motorcycles, Envionmental. Polluion, 183, p175-183.
-
Rogge, W.F., Hildemann, L.M., Mazurek, M.A., Cass, G.R., Simoneit, B.R.T., (1993), Sources of fine organic aerosol. 2. Noncatalyst and catalyst-equipped automobiles and heavy-duty diesel trucks, Environmental Science and Technology, 27, p636-651.
[https://doi.org/10.1021/es00041a007]

- Sicre, M.A., Marty, J.C., Saliot, A., Aparicio, X., Grimalt, J., Albaiges, J., (1987), Aliphatic and aromatic hydrocarbons in different sized aerosols over the Mediterra98 nean Sea: Occurrence and origin, Atmospheric Environment, 21, p2247-2259.
-
Simcik, M.F., Eisenreich, S.J., Lioy, P.J., (1999), Source apportionment and source/sink relationships of PAHs in the coastal atmosphere of Chicago and Lake Michigan, Atmospheric Environment, 33, p5071-5079.
[https://doi.org/10.1016/s1352-2310(99)00233-2]

-
Tang, N., Tabata, M., Mishukov, V.F., Sergienko, V., Toriba, A., Kizu, R., Hayakawa, K., (2002), Comparison of atmospheric nitropolycyclic aromatic hydrocarbons in Vladivostok, Kanazawa and Toyama, Journal of Health Sciences, 48, p30-37.
[https://doi.org/10.1248/jhs.48.30]

-
Tang, N., Hattori, T., Taga, R., Tamura, K., Kakimoto, H., Mishukov, V., Toriba, A., Kizu, R., Hayakawa, K., (2005), Polycyclic aromatic hydrocarbons and nitropolycyclic aromatic hydrocarbons in urban air particulates and their relationship to emission sources in the Pan-Japan Sea countries, Atmospheric Environment, 39, p5817-5826.
[https://doi.org/10.1016/j.atmosenv.2005.06.018]

- Tang, N., Hama, H., Kameda, T., Toriba, A., Hayakawa, K., (2012), Change of atmospheric concentrations of benzo[a]pyrene and 6-nitrobenzo[a]pyrene in Kanazawa, a typical local city in Japan, during 1999 and 2010, In: Morrison, R., O’Sullivan, G. (Eds), Proceedings of the 2011 INEF conference, Environ, Forensics, Royal Society of Chemistry, Cambridge, UK, p163-170.
- Yang, H.H., Lai, S.O., Hsieh, L.T., Hsueh, H.J., Chi, T.W., (2002), Profiles of PAH emission from iron industries, Chemosphere, 48, p1061-1074.

