
Seasonal Variations in Mercury Deposition over the Yellow Sea, July 2007 through April 2008
Abstract
Spatial and temporal variations of mercury, including dry and wet deposition fluxes, were assessed over Northeast Asia, targeting the Yellow Sea, using meteorology and chemistry models. Four modeling periods, each representative of one of the four seasons, were selected. Modeling results captured general patterns and behaviors, and fell within similar ranges with respect to observations. However, temporal variations of mercury were not closely matched, possibly owing to the effects of localized emissions. Modeling results indicated that dry deposition is correlated with wind speed, while wet deposition is correlated with precipitation amount. Overall, the wet deposition flux of 66 ng/m2-day was about twice as large as the dry deposition flux of 32 ng/m2-day, when averaged over the four modeling periods. Dry deposition occurred predominantly in the form of reactive gaseous mercury (RGM). In contrast, RGM accounted for only about two-thirds of wet deposition, while particulate mercury accounted for the remainder.
Keywords:
CMAQ-Hg/WRF, Wet deposition, Dry deposition, Precipitation amount, Wind speed1. INTRODUCTION
Mercury is a widespread, persistent, and neurotoxic heavy metal with severe adverse effects on human health and the environment; since mercury poisoning was first reported in Minamata, Japan, in 1956, mercury pollution has been of great concern (Jiang et al., 2006; UNEP, 2002; UNECE, 1998). In 2002, the Inter-Organization Programme for the Sound Management of Chemicals, led by the United Nations Environment Programme (UNEP), published a report that assessed global mercury pollution and its effect (UNEP, 2002). Following the UNEP’s 2009 decision to enact a convention and several years of intergovernmental meetings and negotiations, a global treaty, the “Minamata Convention on Mercury,” named for the Japanese city of Minamata, was adopted and opened for signature in October 2013 (UNEP, 2013).
Fossil fuel combustion accounts for about two-thirds of global anthropogenic emissions of mercury (Pacyna et al., 2006). Emissions from coal combustion are about one or two orders of magnitude higher than emissions from oil combustion, depending on the country. About 50% of anthropogenic mercury emissions originate from East Asia; China ranks the highest, contributing about one-third to one-fourth of global anthropogenic mercury emissions (Pirrone et al., 2010; Pacyna et al., 2006). Coal combustion and nonferrous metals smelting accounted for about 80% of total mercury emissions during the 1995-2003 period (Wu et al., 2006). In particular, mercury emissions from coal-fired power plants increased by 5.9% annually along with electricity demand growth during that period.
In Korea, mercury emission inventories for primary industrial facilities, starting with power plants and later extended to incinerators, cement kilns, and steel mills, have been made since 2004 (press release from Environmental Health Policy Division of the Korean Ministry of Environment on July 7, 2006). In 2008, the operating guidelines for monitoring networks were finalized to routinely monitor airborne mercury by species, and mercury emission standards that would apply to power plants starting in 2010 were established (KME, 2008).
The Yellow Sea, which is examined in the current study, is located between mainland China and the Korean Peninsula, as shown in Fig. 1. It is a marginal sea of the Pacific Ocean, with an average depth of about 44 m and limited water exchange with the open ocean; its rim is one of the fastest-developing areas in the world. Since the Yellow Sea is located downwind of the prevailing westerlies in the mid-latitudes and vulnerable to pollution, deposition of air pollutants in and around the Yellow Sea can be used as a gauge for estimating long-range transport of air pollutants from China (Kim et al., 2010). In this study, mercury depositions were estimated by season and their seasonal characteristics were examined to assess mercury pollution in the Yellow Sea, following the comparison of modeling results with measurement data obtained during the 2007-2008 intensive measurement campaigns.
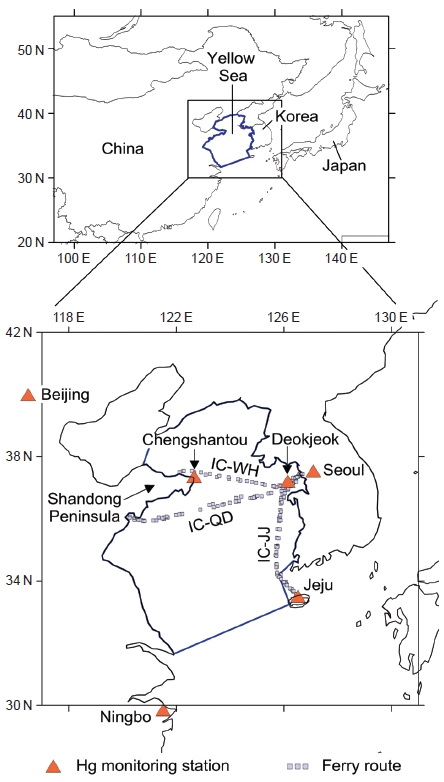
Location of the Yellow Sea, along with coarse and fine modeling grids (top panel) and measurement sites in China and Korea (bottom panel). Sea routes labeled IC-WH, IC-QD, and IC-JJ, along which shipboard measurements of mercury were made, denote Inchon-Weihai, Inchon-Qingdao, and Inchon-Jeju, respectively. Inchon, a port city located just west of Seoul, is not shown on this map.
2. METHODS
2. 1 Description of Models Used
The first full-scale version of the CMAQ (Community Multi-scale Air Quality) mercury model, CMAQ-Hg, was released in 2001 as a special version of CMAQ. Mercury simulation capabilities were formally included in CMAQ starting with version 4.5.1 (Bullock and Brehme, 2006). In the present study, CMAQ version 4.6 was used for mercury modeling. Weather Research and Forecasting (WRF) Model version 2.2 was used to generate the meteorological fields input to the CMAQ model.
2. 2 Mercury Chemistry and Deposition
In general, atmospheric mercury species can exist in one of three forms: elemental mercury (Hg0), oxidized or reactive gaseous mercury (RGM), and particulate mercury (PHg). The impact of mercury emissions is highly dependent on the type of mercury emitted. Because of its slow chemical reactivity and low solubility in water, Hg0 has an atmospheric lifetime of about a year and can be distributed globally. On the other hand, RGM is highly reactive, water soluble, and readily deposited, resulting in a short atmospheric lifetime of hours to days. PHg, which denotes mercury condensed onto aerosols, also has a short atmospheric lifetime of hours to days. In short, Hg0 is largely a global problem, whereas both RGM and PHg are of local and regional concern.
Hg0 accounts for about 95% of the total atmospheric mercury, while RGM and PHg account for the remainder. In the atmosphere, Hg0 is oxidized to RGM or converted to PHg, which in turn deposits on the Earth’s surface. Therefore, chemical reactions of Hg0 play a major role in the fate and transport of mercury in the atmosphere. RGM, once introduced into water, can be converted to highly toxic methylmercury by microorganisms (Stein et al., 1996). Methylmercury can bioaccumulate and bioconcentrate, becoming especially harmful to humans, at the top of the food chain. The Carbon Bond IV mechanism in the CMAQ-Hg model v4.6 includes the following gaseous-phase reactions of mercury (Bullock and Brehme, 2006):
| (R1) |
| (R2) |
| (R3) |
| (R4) |
In the studies of Bullock and Brehme (2002) and Pan et al. (2008), the products of reactions (R1), (R3), and (R4) were PHg. However, in the reaction mechanism described by Bullock and Brehme (2006), which is built into CMAQ-Hg v4.5.1, RGM became more important, as 0.5 RGM was included as a product of reaction (R1) and (R4) and PHg was replaced by RGM as a product of reaction (R3). Pan et al. (2008) pointed out that reaction rates in this chemical mechanism are too fast, and uncertainties in reaction rates far exceed those in emission inventories of controversy in mercury modeling.
Of greater importance is oxidation of Hg0 by OH radicals and O3 in the terrestrial lower troposphere but by halogen elements in the marine boundary layer or upper troposphere (Lin et al., 2006). However, oxidation of Hg0 by chlorine is a negligible pathway in mercury modeling for East Asia (Pan et al., 2008).
Like other air pollutants, wet deposition flux is calculated by considering solubility in water and aqueous-phase reactions, but Hg0 contributes negligibly to wet deposition flux because of its lower solubility in water (Bullock and Brehme, 2006, 2002). For PHg, the dry deposition velocity of elemental carbon, onto which PHg is assumed to attach in the atmosphere, was used, while for RGM that of HgCl2 was used. Dry deposition of Hg0 is negligible compared to that of both RGM and PHg, and the deposition velocity of Hg0 onto water bodies is set to zero (Bullock and Brehme, 2006). Evaporation of mercury from vegetation and water bodies was calculated as a separate emission.
2. 3 Modeling Domain and Modeling Periods
The top panel in Fig. 1 shows the modeling domain, which is East Asia between 97 and 147°E in longitude and 20 and 55°N in latitude, covering most of the primary mercury emission sources in East Asia. Modeling grids were produced at two levels of resolution: a coarse, outer domain at a horizontal resolution of 108 km, and a fine, inner domain at a horizontal resolution of 36 km that covers the Yellow Sea between 117 and 131°E in longitude and 30 and 42°N in latitude. The outer grid for WRF has 59 columns and 39 rows, while that for CMAQ has 47 columns and 27 rows, i.e., 6 grid cells fewer than that for WRF in each direction. This study targets the Yellow Sea, and thus additional calculations were made for the Yellow Sea area within the inner domain, delineated in a blue, bold line in Fig. 1. Vertically, there were 16 layers on a pressure coordinate up to 100 hPa for WRF and 14 layers on a sigma coordinate for CMAQ. At the outer boundaries, mercury concentrations were initially set to zero but were updated at each time step under the assumption that mercury concentrations were determined mostly by emissions within the domain.
To determine the modeling periods, measurements that had been performed from April 2007 to May 2008 were examined for completeness by season (Table 1). The measurements were carried out as part of a joint research project between the Korea Institute of Science and Technology and the Chinese Academy of Sciences (Nguyen et al., 2011). During this period, PHg and Hg0 in air along with mercury in precipitation were measured at Deokjeok Island, Jeju Island, and Seoul in Korea, and at Beijing, Chengshantou, and Ningbo in China (bottom panel in Fig. 1). Hg0 was also measured on shipboard along the Incheon-Jeju, Incheon-Qingdao and Incheon-Weihai ferry routes, as shown in the bottom panel of Fig. 1. Table 1 shows monthly measurements of mercury by species and by site. Considering that the more measurement data at more sites, the more beneficial for model validation, July and October 2007 and April 2008 were first selected as modeling periods, which are representative of summer, fall, and spring, respectively. To cover the variability across all four seasons, January 2008 was subsequently included as being representative of winter, although, unlike the other three seasons, January 2008 did not include measurements of Hg in precipitation at all sites in Korea.
The following are the selected modeling periods by season: July 2-10, 2007, for summer; October 16-21, 2007, for fall; January 19-27, 2008, for winter; and April 22-May 2, 2008, for spring. Because the modeling period was selected on the basis of the availability of measurement data, it varied from 6 days in fall to 11 days in spring.
2. 4 Emissions
Emission data required for mercury modeling are those involved in reactions (R1)-(R4). Hg0 is transformed into RGM and/or PHg via oxidation by primary atmospheric oxidants (ozone, H2O2 and OH) and chlorine (Bullock and Brehme, 2006). Chlorine emissions were not considered because the effects of gas-phase oxidation of Hg0 by chlorine are negligible in East Asia (Pan et al., 2008), as mentioned previously.
Mercury emissions for the year 2001 were estimated by Pan et al. (2007), who adjusted the data for the year 1999 (Streets et al., 2005) by assimilating results from aircraft measurements obtained during the Asian Pacific Regional Aerosol Characterization Experiment intensive field campaign in April 2001. In the present study, we updated the 2001 mercury emission data for the year 2006, on the basis of changes in activity levels by sector; the updated data were given at a 0.5° resolution and speciated into Hg0, RGM, and PHg. For other air pollutants, anthropogenic emission data from the University of Iowa for the year 2006 were used (Zhang et al., 2009). For additional air pollutants, such as ammonia, that were not included in the study by Zhang et al. (2009), a modified version of the 2000 emission inventory data (Streets et al., 2003) was used. Table 2 shows a comparison of year 2000 (2001 for Hg) and year 2006 emissions data by pollutant over the modeling domain.
3. RESULTS AND DISCUSSION
3. 1 Comparison of Predicted and Measured Hg Concentrations
As can be seen in Table 1, there exist a variety of measurement types (in terms of mercury species) by measurement site, even during the same period. However, airborne concentrations were compared because concentrations in precipitation are difficult to extract from model calculations (see Fig. 2).
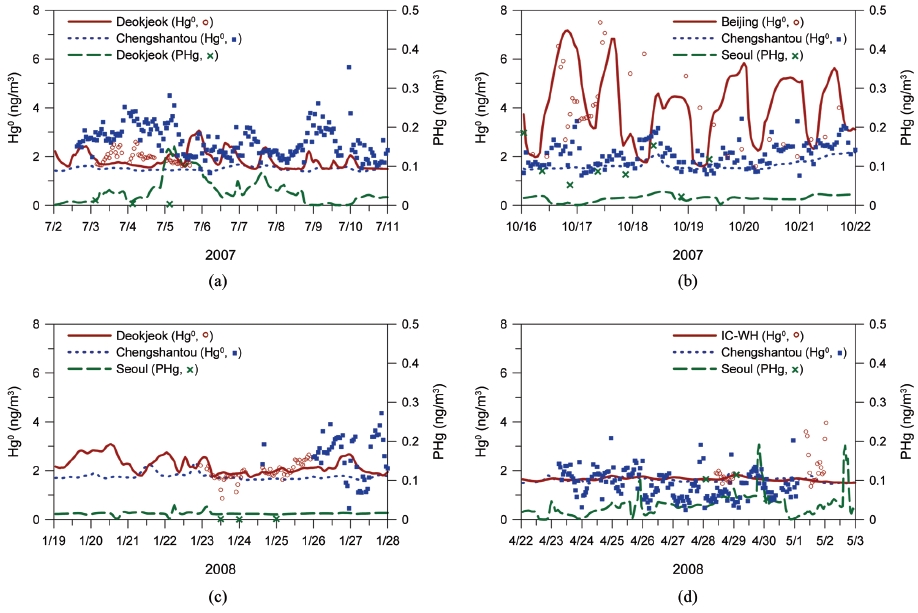
Comparison of predicted concentrations with measured concentrations: (a) July 2007; (b) October 2007; (c) January 2008; and (d) April 2008. Since measurement sites were not identified during the shipboard measurements between Incheon and Qingdao in April 2008, predicted concentrations averaged over the Yellow Sea region were compared with measured ones.
Continuous real-time measurements were made for Hg0. Measurement data are available at Chengshantou for all periods, at Deokjeok Island for July 2007 and January 2008, and at Beijing for October 2007. Shipboard measurement data were available for April 2008 along the ferry route between Inchon and Weihai. However, hour-by-hour comparison of model results with observations is not straightforward, even for Hg0. At Chengshantou, calculated concentrations of Hg0 are almost constant, while measured concentrations show a significant variation. This variation was seemingly caused by the effects of localized emissions that have spatial scales smaller than those of the grid cell and thus cannot be resolved in the modeling. Overall, measured and predicted values are comparable, with the exception of higher measured values vs. predicted values at Chengshantou in July 2007.
Although particulate mercury was measured at Deokjeok Island and Seoul (Nguyen et al., 2011), analysis of trends and behaviors are hampered because 24-h averages were measured and only a few data points were available. Comparison of model prediction with measurement data showed overprediction at Deokjeok Island for July 2007 and underprediction at Seoul for October 2007. In Seoul, predicted values are comparable to measured values for January and April 2008 but slightly higher for the former and lower for the latter than measured values.
3. 2 Temporal Variations
Table 3 presents predicted daily-average wet and dry deposition fluxes and Fig. 3 shows hourly variations in predicted wet and dry deposition fluxes, averaged over the Yellow Sea for four modeling periods. Precipitation amount and wind speed are also presented as key parameters of wet and dry deposition, respectively, in Fig. 3. Daily-average deposition fluxes in Table 3 were calculated from hourly-average deposition fluxes, as shown in Fig. 3. As mentioned previously, the number of modeling days varies from 6 to 11, depending on the measurement period.
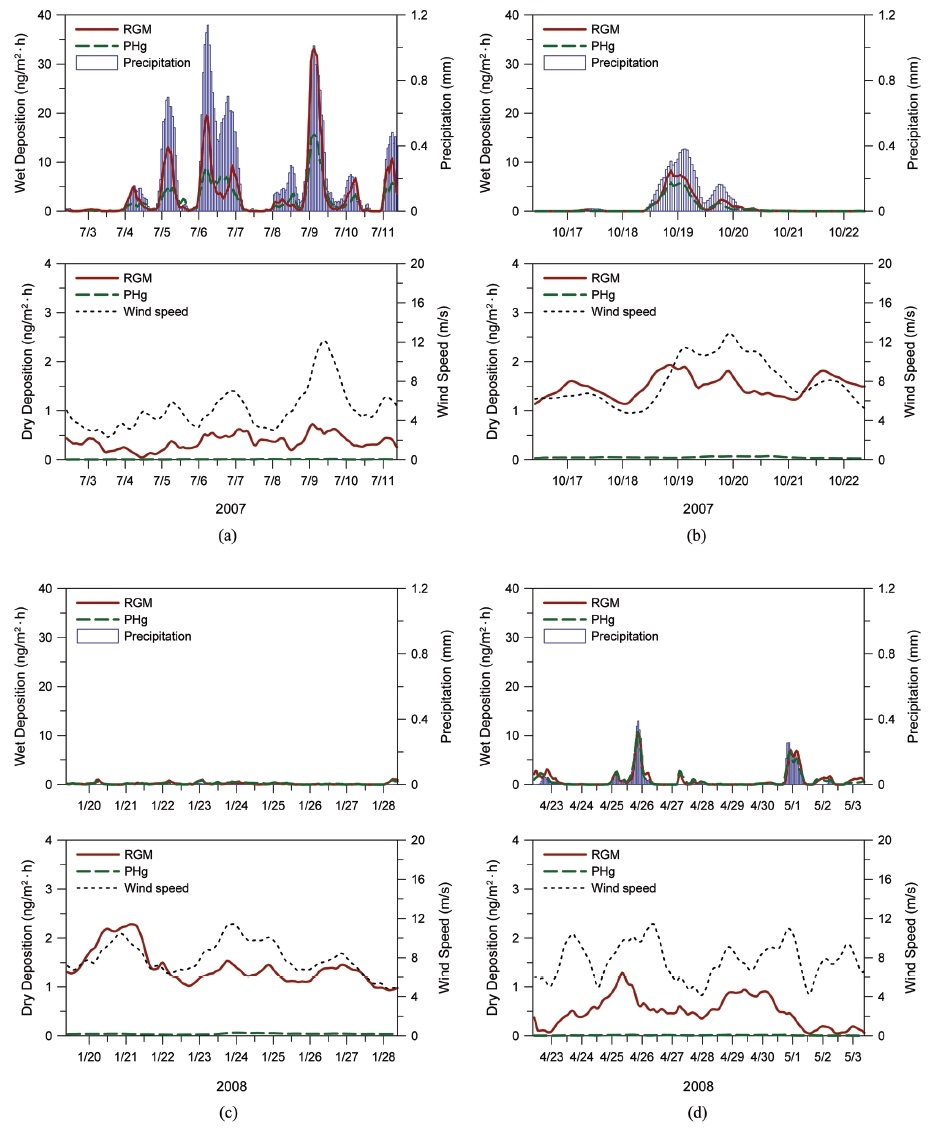
Hourly variations in wet and dry deposition fluxes and meteorological variables averaged over the Yellow Sea region: (a) July 2007; (b) October 2007; (c) January 2008; and (d) April 2008. Precipitation in January 2008 denotes snowfall.
In the case of Hg0, wet deposition fluxes are insignificant owing to its low solubility in water, and since the dry deposition velocity is set to zero over the sea surface, the dry deposition flux is zero. The total wet deposition flux (i.e., the sum of Hg0, RGM, and PHg) was highest in July 2007, followed by October 2007, April 2008, and January 2008 in order of descending flux. The total dry deposition flux was highest in October 2007, followed by January 2008, April 2008, and July 2007 in order of descending flux. Overall, the mean wet deposition flux of 66.1 ng/m2-day was roughly twice the mean dry deposition flux of 32.3 ng/m2-day.
This difference is mainly due to PHg. About 98% of dry deposition flux is in the form of RGM, which is easier to deposit. In contrast, about 40% of wet deposition flux is in the form of PHg. Nevertheless, for RGM, wet deposition flux is about 25% higher than dry deposition flux. As a result, during the 2007-2008 measurement period, precipitation scavenging was more effective than dry deposition, and notably, about 97% of PHg was removed from the atmosphere by wet deposition.
Fig. 3 shows that wet deposition mostly depends on the temporal behavior of the precipitation amount. The amounts of wet deposition in July 2007 are related to the abundance of precipitation, as shown in Fig. 3a. However, wet deposition occurred even during the nonmonsoon season, i.e., January and April 2008 (Fig. 3c and d). This observation can be interpreted as follows: either light precipitation or initial precipitation is effective in promoting wet deposition when there are high airborne mercury concentrations, as is the case with higher wet deposition caused by initial precipitation in July and October 2007 (Ghim and Jin, 2005).
While precipitation amount plays a key role in wet deposition, dry deposition is correlated with wind speed because wind speed is important in determining dry deposition velocity (Kim et al., 2010; Ghim and Kim, 2002). This is particularly true in July 2007 and January 2008, with correlation coefficients of 0.66 and 0.54, respectively, between wind speed and dry deposition of RGM (see Fig. 3a and c). The lowest dry deposition, which accounted for only 6% of total deposition, occurred in July 2007, when the highest wet deposition occurred. This observation can be interpreted as follows: in July 2007, airborne mercury concentrations were considerably lowered by precipitation scavenging, and concurrently, dry deposition velocity was kept low by a lower average wind speed of 5.2 m/s compared to 7.7-8 m/s during the other periods. This explanation was substantiated by higher dry deposition fluxes in October 2007 and January 2008, periods in which mean wind speed was comparably 8.0 m/s. However, less dry deposition occurs in April 2008 than in October 2007 and January 2008, even with small differences in wind speeds. RGM concentrations are lower in April 2008, at about one-third of those for the other two periods, but the cause is still unclear.
3. 3 Spatial Distributions
Fig. 4 shows spatial distributions of wet deposition flux and precipitation amount by period on a daily basis, and Fig. 5 illustrates spatial distributions of dry deposition flux and mean wind speed. In general, higher wet deposition fluxes are concentrated around the areas with higher precipitation amounts, as shown in Fig. 4. However, the spatial distributions of dry deposition and wind speed are somewhat dissimilar, as shown in Fig. 5. Higher dry deposition occurs mostly along the coast, whereas higher average wind speeds occur on open water far from the coast. This pattern is observed because dry deposition occurs around emission sources and in the form of highly reactive RGM, as can be seen in Table 3 as well as Fig. 3.
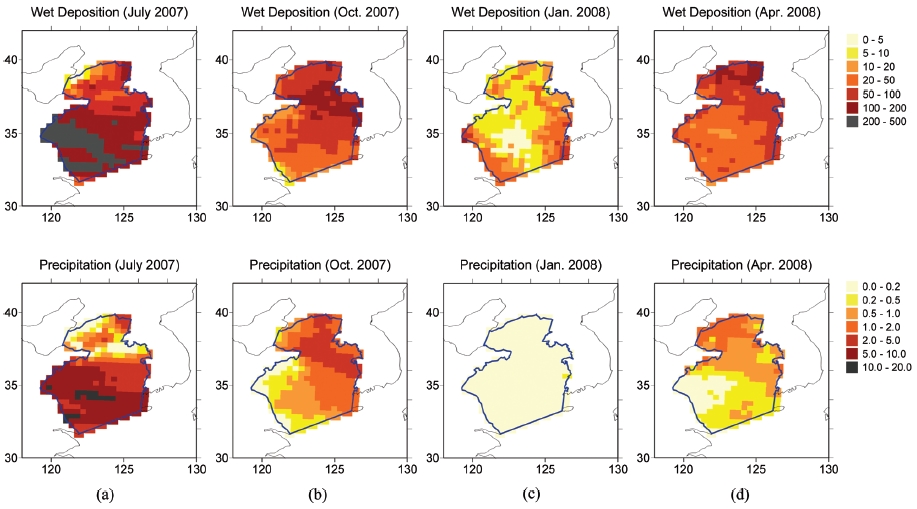
Spatial distributions of wet deposition flux (ng/m2-day) and precipitation amount (mm) over the Yellow Sea region: (a) July 2007; (b) October 2007; (c) January 2008; and (d) April 2008. The darker the color, the higher the wet deposition or precipitation. Note that wet deposition in January 2008 was attributed to snowfall rather than rain.
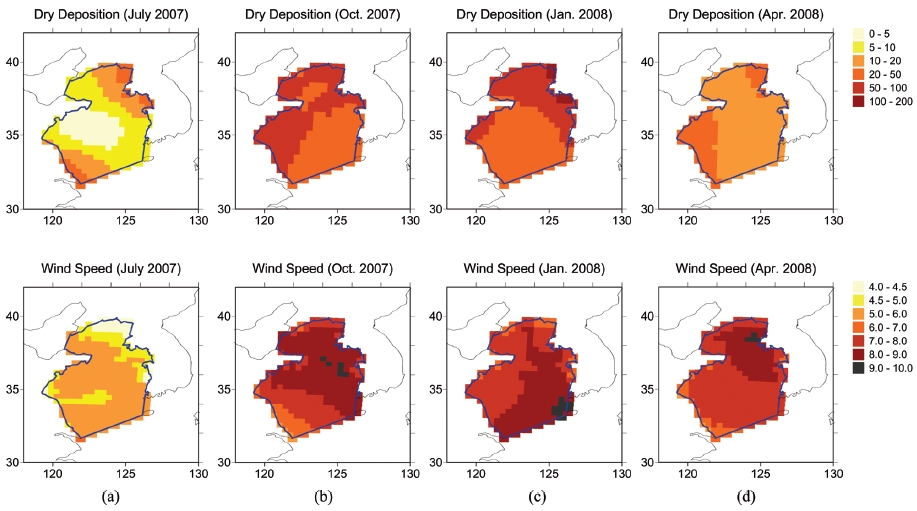
Spatial distributions of dry deposition flux (ng/m2-day) and mean wind speed (m/s) over the Yellow Sea region: (a) July 2007; (b) October 2007; (c) January 2008; and (d) April 2008. The darker the color, the higher the dry deposition or wind speed.
The previous discussion is similarly applicable to wet deposition. However, in contrast to dry deposition, wet deposition is not high along the coast because wet deposition shows a high proportion of PHg and a high correlation with precipitation amount, as mentioned earlier (see Fig. 4). As shown in Fig. 4a (top panel), higher wet depositions were found in areas far out from the southern part of the Shandong Peninsula in July 2007, owing to the higher precipitation amount (bottom panel). In January 2008, snow fell, so the precipitation amount was expressed as snowfall rather than rainfall. A measurable amount of wet deposition occurred along the coast at that time in spite of minimal precipitation. It is generally known that snow may scavenge some species more efficiently than an equal amount of rain, and this behavior seemingly holds for mercury.
4. CONCLUSION
Mercury depositions over the Yellow Sea were estimated using the air quality modeling code CMAQ v4.6 with meteorological input from the WRF v2.2 model. Considering the completeness of land-based and shipborne measurement data in Korea and China during the 2007-2008 period, three periods (July and October 2007 and April 2008) representative of the summer, fall, and spring seasons, respectively, were selected. For the sake of completeness, January 2008 was included as representative of the winter season, even though measurement data in Korea for that period were somewhat limited compared to other seasons.
Model predictions for PHg at Seoul and Deokjeok Island and for Hg0 at Deokjeok Island, Beijing, Chengshantou, and along the Inchon-Weihai ferry route were compared with observations. In general, measurements and model results agreed fairly well. Model calculations could not reproduce hourly variations in Hg0, particularly at Chengshantou, which are believed to be due to the effects of localized emissions.
Despite a slight time lag, variations in wet deposition fluxes are generally similar to variations in precipitation. Thus, wet deposition fluxes were the highest, at about 153 ng/m2-day, in July 2007, during an abundance of precipitation associated with the monsoon season. These fluxes are over three times higher than those in October 2007 and April 2008, when there is relatively low precipitation, as well as those in January 2008, with an absence of precipitation. Spatial distributions of wet depositions are similar to those of precipitation, and RGM accounted for about 50-62% of total wet deposition fluxes, slightly higher than PHg.
Dry deposition fluxes are correlated with wind speed, to which dry deposition velocity is proportional. The fact that dry deposition flux contributed to only 6% of total deposition in July 2007 can be attributed to low airborne concentrations, caused by frequent precipitation scavenging along with low wind speed. About 97% of dry deposition fluxes occurred in the form of RGM, and owing to the high reactivity of RGM, higher dry deposition fluxes were found around emission sources along the coast than on open waters with higher wind speeds.
Acknowledgments
This work was supported by the Hankuk University of Foreign Studies Research Fund.
REFERENCES
- Bullock Jr., O.R., Brehme, K.A., (2002), Atmospheric mercury simulation using the CMAQ model: formulation description and analysis of wet deposition results, Atmospheric Environment, 36, p2135-2146.
- Bullock Jr., O.R., Brehme, K.A., (2006), Atmospheric mercury simulation with CMAQ version 4.5.1, 5th Annual CMAS Conference, Chapel Hill, NC, October 16-18.
- Ghim, Y.S., Jin, H.C., (2005), Measurement of nitrogen and sulfur deposition to Lake Paldang, Journal of Korean Society for Atmospheric Environment, 21, p39-48, (in Korean with English abstract).
-
Ghim, Y.S., Kim, J.Y., (2002), Dry deposition of reactive nitrogen and sulfur compounds in the greater Seoul area, Korean Journal of Chemical Engineering, 19, p52-60.
[https://doi.org/10.1007/bf02706874]

- Jiang, G.-B., Shi, J.-B., Feng, X.-B., (2006), Mercury pollution in China: An overview of the past and current sources of the toxic metal, Environmental Science & Technology, 40, p3673-3678.
-
Kim, J.Y., Ghim, Y.S., Lee, S.B., Moon, K.-C., Shim, S.-G., Bae, G.N., Yoon, S.-C., (2010), Atmospheric deposition of nitrogen and sulfur in the Yellow Sea region: Significance of long-range transport in East Asia, Water, Air, & Soil Pollution, 205, p259-272.
[https://doi.org/10.1007/s11270-009-0072-2]

- KME (Korean Ministry of Environment), (2008), Environment White Paper.
-
Lin, C.-J., Pongprueksa, P., Lindberg, S.E., Pehkonen, S.O., Byun, D., Jang, C., (2006), Scientific uncertainties in atmospheric mercury models I: Model science evaluation, Atmospheric Environment, 40, p2911-2928.
[https://doi.org/10.1016/j.atmosenv.2006.01.009]

-
Nguyen, D.L., Kim, J.Y., Shim, S.-G., Zhang, X.-S., (2011), Ground and shipboard measurements of atmospheric gaseous elemental mercury over the Yellow Sea region during 2007-2008, Atmospheric Environment, 45, p253-260.
[https://doi.org/10.1016/j.atmosenv.2010.07.021]

-
Pacyna, E.G., Pacyna, J.M., Steenhuisen, F., Wilson, S., (2006), Global anthropogenic mercury emission inventory for 2000, Atmospheric Environment, 40, p4048-4063.
[https://doi.org/10.1016/j.atmosenv.2006.03.041]

-
Pan, L., Chai, T., Carmichael, G.R., Tang, Y., Streets, D., Woo, J.-H., Friedli, H.R., Radke, L.F., (2007), Top-down estimate of mercury emissions in China using four-dimensional variational data assimilation, Atmospheric Environment, 41, p2804-2819.
[https://doi.org/10.1016/j.atmosenv.2006.11.048]

-
Pan, L., Carmichael, G.R., Adhikary, B., Tang, Y., Streets, D., Woo, J.-H., Friedli, H.R., Radke, L.F., (2008), A regional analysis of the fate and transport of mercury in East Asia and an assessment of major uncertainties, Atmospheric Environment, 42, p1144-1159.
[https://doi.org/10.1016/j.atmosenv.2007.10.045]

-
Pirrone, N., Cinnirella, S., Feng, X., Finkelman, R.B., Friedli, H.R., Leaner, J., Mason, R., Mukherjee, A.B., Stracher, G.B., Streets, D.G., Telmer, K., (2010), Global mercury emissions to the atmosphere from anthropogenic and natural sources, Atmospheric Chemistry and Physics, 10, p5951-5964.
[https://doi.org/10.5194/acpd-10-4719-2010]

-
Stein, E.D., Cohen, Y., Winer, A.M., (1996), Environmental distribution and transformation of mercury compounds, Critical Reviews in Environmental Science and Technology, 26, p1-43.
[https://doi.org/10.1080/10643389609388485]

-
Streets, D.G., Bond, T.C., Carmichael, G.R., Fernandes, S.D., Fu, Q., He, D., Klimont, Z., Nelson, S.M., Tsai, N.Y., Wang, M.Q., Woo, J.-H., Yarber, K.F., (2003), An inventory of gaseous and primary aerosol emissions in Asia in the year 2000, Journal of Geophysical Research: Atmospheres, 108(D21), p8809.
[https://doi.org/10.1029/2002JD003093]

-
Streets, D.G., Hao, J., Wu, Y., Jiang, J., Chan, M., Tian, H., Feng, X., (2005), Anthropogenic mercury emissions in China, Atmospheric Environment, 39, p7789-7806.
[https://doi.org/10.1016/j.atmosenv.2005.08.029]

- UNECE (United Nations Economic Commissions for Europe), (1998), The 1998 Aarhus Protocol on Heavy Metals, http://www.unece.org/env/lrtap/hm_h1.htm (accessed January 2002).
- UNEP (United Nations Environment Programme), (2002), Global Mercury Assessment, UNEP Chemicals, Geneva, Switzerland.
- UNEP, (2013), Minamata Convention on Mercury, http://www.mercuryconvention.org (accessed August 2015).
-
Wu, Y., Wang, S., Streets, D.G., Hao, J., Chan, M., Jiang, J., (2006), Trends in anthropogenic mercury emissions in China from 1995 to 2003, Environmental Science & Technology, 40, p5312-5318.
[https://doi.org/10.1021/es060406x]

-
Zhang, Q., Streets, D.G., Carmichael, G.R., He, K.B., Huo, H., Kannari, A., Klimont, Z., Park, I.S., Reddy, S., Fu, J.S., Chen, D., Duan, L., Lei, Y., Wang, L.T., Yao, Z.L., (2009), Asian emissions in 2006 for the NASA INTEX-B mission, Atmospheric Chemistry and Physics, 9, p5131-5153.
[https://doi.org/10.5194/acpd-9-4081-2009]

