SO2, NO2 and BTEX Concentrations in Educational and Industrial Areas: Field Measurements in Kuwait
Abstract
Measurements of SO2, NO2 and benzene, toluene, ethylbenzene, and xylenes BTEX concentrations using passive tubes were carried out at five locations featuring educational and light industrial activities in south western Kuwait City during 2014. The five selected sites, chosen to be statistically representative of land use in the study area, were monitored to evaluate the impacts of traffic and light industrial activities on pollutant concentrations. The recorded mean concentrations of NO2, SO2 and BTEX were 40.3, 28.1 and 3.72 μg/m3, respectively. The lowest concentrations were recorded in the educational area. Comparisons between the measured concentrations and the applicable air quality standards from the Kuwait Environment Public Authority showed that the gas concentrations were lower than the allowable limits.
Keywords:
passive tubes, standards, air quality, BTEX1. INTRODUCTION
Recent studies have shown that, at a minimum, seasonal air quality data should be used to evaluate the impacts and risks of human exposure to air pollution (e.g. Pérez Ballesta et al., 2008; Clench-Aas et al., 1999). Many studies have demonstrated that high levels of air pollution negatively impact human health and can cause increased respiratory morbidity and mortality (e.g. Zhou et al., 2003). Besides affecting human health, air pollution can also damage property, plants and crops (Seinfeld, 1986). Although these types of damage cause high, directly measureable costs, they are not comparable to the costs associated with human health (Brunekreef and Holgate, 2002; Levy et al., 2002). Monitoring the potential health effects of any urban air pollutant requires many complementary measurements. As such, there is a need for cost-effective ways to simultaneously evaluate multiple pollutants and this can be achieved using diffusive sampling techniques (Costabile et al., 2006).
In Kuwait, air pollution caused by emissions of toxic compounds from the country’s industrial areas, especially oil production facilities and refineries, has become a priority for authorities. Air pollution became more of a priority after people began to move into new cities located downwind of most of the country’s oil production facilities. With a rapidly growing population of over three million and a vehicle fleet of more than one million, Kuwait City, and its neighbouring areas in particular, are experiencing increased traffic volumes, greater trip frequencies and increased trip lengths (Al-Awadhi, 2014). These features have caused outdoor air quality to become a major problem and concern for people living in urban areas, particularly because of its impact on indoor air quality. Analysis of air quality data from air quality monitoring stations operated by the Kuwait Environmental Public Authority (KEPA) showed that concentrations of SO2 and NOx exceeded the permitted levels over a 7-year study period (1998-2004) (Al-Mutairi and Koushki, 2009). Traffic was the main source of air pollution in the district located adjacent to the Kuwait City centre, while oil refineries contributed the most to ambient air pollution in rural districts. Based on this work, Al-Harbi (2014) used the chemical mass balance (CMB) model to quantify the contributions of NO2, SO2 and other species in two urban areas (Fahaheel and Al-Rabia). The results revealed that the main emission sources in Fahaheel were petroleum downstream facilities and highway traffic, which accounted for 69% and 17%, respectively, while in Al-Rabia, highway traffic and the area’s commercial activities accounted for 79% and 13%, respectively. Jallad and Espada-Jallad (2012) also investigated road traffic emissions in the Salmiyah residential area of Kuwait. Their results showed that NO2, SO2 and other gases exceeded the ambient air quality standards during different times of the year. From March 2011 to February 2012, Al-Awadhi (2014) performed intensive measurements of gaseous air pollutants including SO2, NO, NO2, H2S, O3, NH3 and BTEX at 10 locations throughout Kuwait City using IVL passive sampler technology, provided by Swedish Environmental Research Institute. The study revealed that the pollutants were present in lower concentrations than prescribed in the residential Kuwait Environment Public Authority standards.
This study focused on seasonal measurements of selected gaseous air pollutants in ambient air near educational and light industrial areas located 6 km southwest of Kuwait City, which is the most congested area of the country. Passive samplers were used to collect the gas samples. The pollutants studied were sulphur dioxide (SO2), nitrogen dioxide (NO2) and BETX compounds (benzene, toluene, n-octane, ethyl benzene, m&p-xylene, o-xylene and n-nonane). The measurements were performed simultaneously to ensure optimal use of time and effort. It is estimated that passive sampling methods are at least 50-fold less expensive than active sampling methods. This means that reliable air pollution monitoring methods are affordable for environmental authorities with small budgets.
2. MAJOR POLLUTION SOURCES AND ACTIVITIES WITHIN THE STUDY AREA
The eastern region of the study area contained a harbour (Mina Shuwaikh port), free trade zone, the headquarters of some Kuwaiti corporations and many small industrial workshops, while the western region contained educational institutes and Kuwait University. Major road and bridge construction activities were ongoing in the vicinity of the study area, so traffic congestion was at its peak. The numbers of vehicles operating on the main roads in the study area (Ghazali Street, south of Jahra Road, Abdul Nasser Street, west of Ghazali Street, and Jahra Road, west of Ghazali Street) were obtained by personal communication with the team leader of the Sheikh Jaber Al Ahmed Al Sabah Causeway Project, Traffic Study. The average daily number of vehicles in the study area ranged from 71 885 to 128 920 vehicles per day.
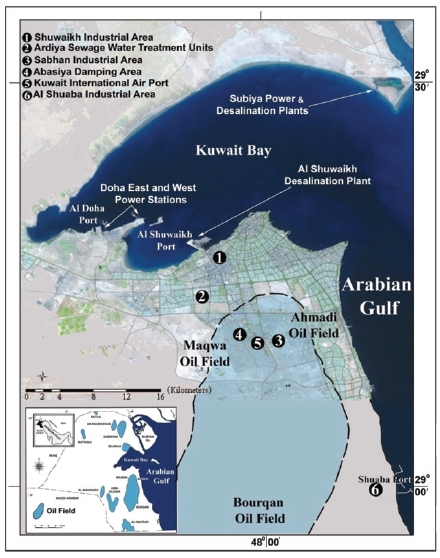
While traffic is the main source of air pollution in the study area, activities within the harbour and the industrial area also contribute to the traffic-related airborne pollutants and pollution load. Other industries, such as power stations, oil fields and refineries, contribute the least to air pollution emissions in the study area (Fig. 1). Northern power plants (operating on fossil fuels) were expected to be major sources of SO2 and NOx in the study area. Emissions of these pollutants from the oil fields are also likely to contribute to measured concentrations in Kuwait City and its surroundings.
3. METHODOLOGY
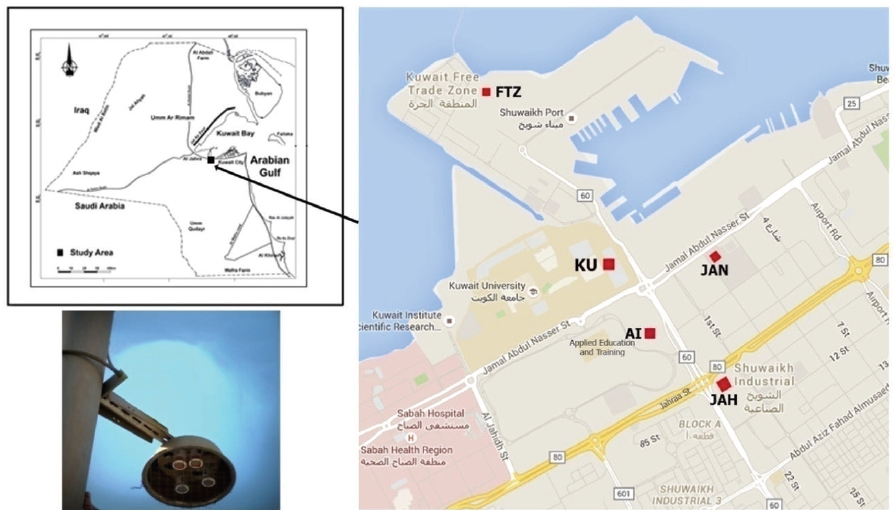
Passive tube sampling was carried out in 2014. SO2, NO2 and BTEX compounds were simultaneously measured at five locations in the study area through four field measurement campaigns. The four field campaigns were designed to measure contributions on a seasonal basis. The five sampling locations (Fig. 2) were selected throughout the study area to cover industrial and educational areas. Passive diffusive samplers, developed at the IVL (Swedish Environmental Research Institute Ltd - Gothenburg, Sweden) and described by Ferm and Rodhe (1997), were used in this study. The samplers, fixed at a height of 3 m above the ground, were left in the field for approximately two weeks and then the samples were sealed in a bag and sent to the Swedish Research Laboratory for analysis. At IVL, the analytical procedures for the samplers have been accredited. Furthermore, the IVL is participating in the standardization work for testing diffusive samplers within the CEN (European Committee for Standardization). This implies that certified standards are used every time a batch of samples is analyzed. Additional information of the use of IVL-type samplers and their comparison with active sampling results can be found in Ayers et al. (2002 and 1998) and Gillett et al. (2000). To ensure that there are no biases in determining each gas concentration including BTEX compounds, the calculations are fully based on Fick’s first and second laws of diffusion implying that the ambient concentration is calculated from the theoretical uptake rate and not from an empirical one (Ferm and Svanberg, 1998; Ferm and Rodhe, 1997). Turbulent diffusion, convection, and rotation of the sampler can cause an active movement of air inside the sampler. This can be avoided by using a membrane at the inlet, shadowing the sampler and during personal monitoring, facing the inlet downwards.
The analyses of the adsorbent tubes, for BTEX compounds, were carried out on an automated thermal desorption instrument (ATD400, Perkin-Elmer) attached to a gas chromatograph (GC). During the desorption stage the adsorbent tubes were heated to 330℃ during 10 minutes under a flow of helium. The desorbed components were refocused on a cold trap packed with Tenax GR cooled to - 30℃. The trap was then heated rapidly to 300℃ in order to inject the retained analyses into the GC as a highly concentrated band of vapour. On the GC the analyses were separated on an un-polar analysis column (CP Sil 5 CB, Agilent) and detected on a flame ionization detector (GC-FID). Quantification was based on comparison of the peak height to the known peak heights of various concentrations of the standard analyses in a reference mixture. The calibration concerning benzene, toluene, n-octane, ethyl benzene, m&p-xylene, o-xylene and n-nonane was controlled against certified standards on Carbopack B. The limit of detection (LOD) was defined as 3 times the blank samples standard deviation of fieldand lab-blanks.
The data obtained were analysed using the SPSS software package (Version 19) and contour maps for annual and seasonal measured pollutant concentrations were produced using the Surfer software (Version 11). For each monitoring station the X coordinate (latitude) and Y coordinate (longitude) were included and entered into the software. Surfer Gridding Technique was then used to interpolate the measured values between the 5 sampling stations and to predict the concentration trends within the study area. Such technique relies on the similarity of nearby sample points. To create the spatial interpolation in our study area (~2 km2), Surfer Kriging Interpolation Method has been used. Kriging is a geostatistical gridding method which attempts to express trends suggested within the source data.
Meteorological software was used to analyse different meteorological variables that were collected at the Kuwait International Airport. Table 1 presents the meteorological conditions during the sampling period.
4. RESULTS AND DISCUSSION
Results from analyses of the diffusive samples at the selected locations are presented in Table 2. Table 3 provides statistical results for each pollutant aggregated over the five sites during each season.
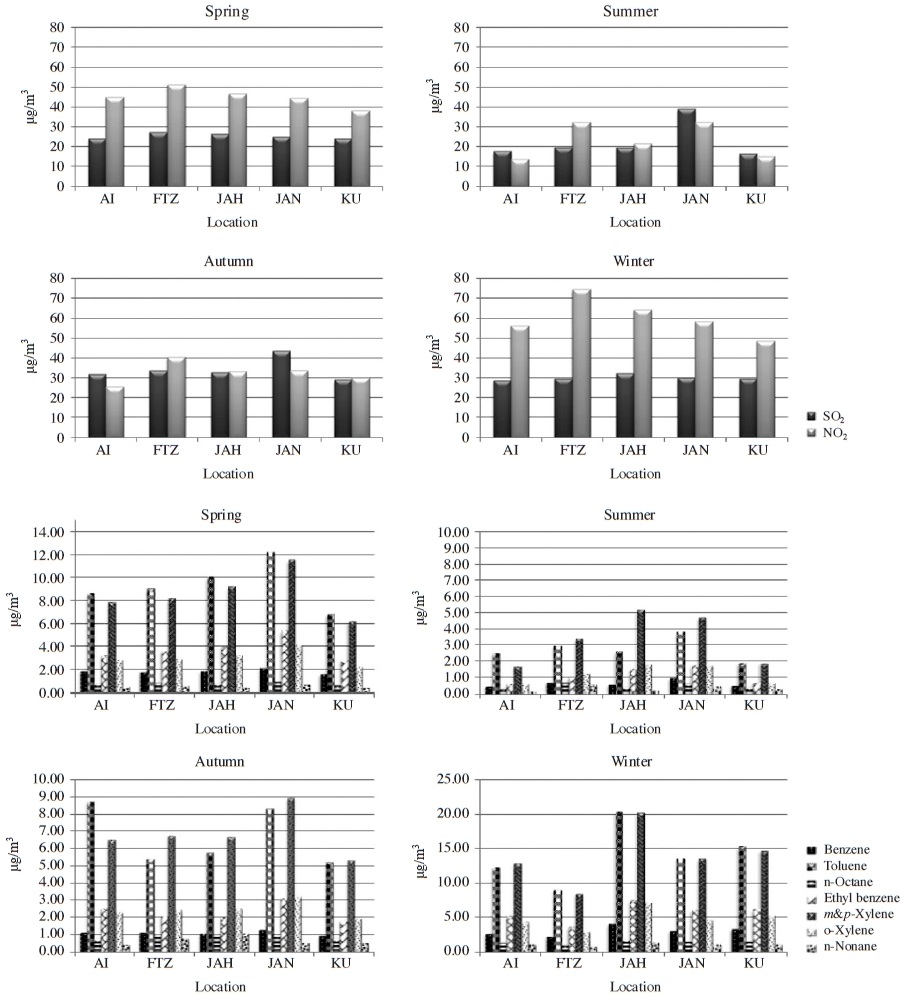
Seasonal peak concentrations of each of the measured pollutants at each site are presented in Fig. 3. Seasonal variations in the concentrations of each compound varied. For example, SO2 concentrations peaked during autumn (34.13 μg/m3). This could be from short-range transport of SO2 from surrounding oil fields, while the low mean concentration of SO2 during the summer (22.5 μg/m3) likely resulted from SO2 emissions from the southern oil fields being directed away from Kuwait city and its surrounding areas by the prevailing north-westerly winds. The difference in mean concentrations between autumn and summer (11.6 μg/m3) may also be associated with SO2 emissions from nearby power plants located upwind of the study area.
High mean concentrations of NO2 were recorded during winter (60.69 μg/m3). The difference between mean NO2 concentrations during winter and summer was 37.7 μg/m3. The main reason for higher NO2 concentrations during winter is that winter traffic volumes were higher than those during summer. The influx of people to the industrial, educational and health areas studied is considerably higher during winter than during summer because the majority of the professionals and workers leave the country for their summer vacations, resulting in reduced traffic emissions during summer. Also, temperature inversions may play an important role in trapping more pollutants and controlling plumes emitted from power plants during colder months. For example, plume may be emitted below the boundary layer during the early morning that is not able to effectively disperse.
For BTEX compounds, except m&p-xylene and toluene, not much seasonality was apparent and their concentrations did not appear to be impacted by meteorological factors, such as humidity and wind speed, or traffic volumes. Concentrations of toluene ranged from 1.9 to 20.4 μg/m3 and the mean concentration during winter (14.17 μg/m3) was significantly higher than that during summer. Similarly, the mean concentration of m&p-xylene during winter (14.02 μg/m3) was much higher than that during summer (3.37 μg/m3). It seems that the overall BTEX contribution of oil refineries and field, is minimal because the compounds react or are removed from the atmosphere before reaching the study area, i.e.; once released in the environment, BTEX compounds usually evaporate quickly into the air due to their short life time, for example the half-life time of benzene, toluene, ethylbenzene, and xylenes are 141.8, 57.1, 47.0 and 23.3 hours, respectively (CalTOXTM, 1994). The photochemical reactivity of these compounds which leads to the formation of carbonyls through reaction with hydroxyl radical plays important role in their removal with bounty of sunlight (Dutta et al., 2009). However, the xylene concentrations being much higher than the benzene concentrations may indicate that these two compounds have different emission sources or their source are the same but have different emission rates. Generally, trends in the BTEX compound’s concentrations were similar to each other and traffic emissions were likely the main source of BTEX pollutants. High traffic emissions were particularly evident during winter.
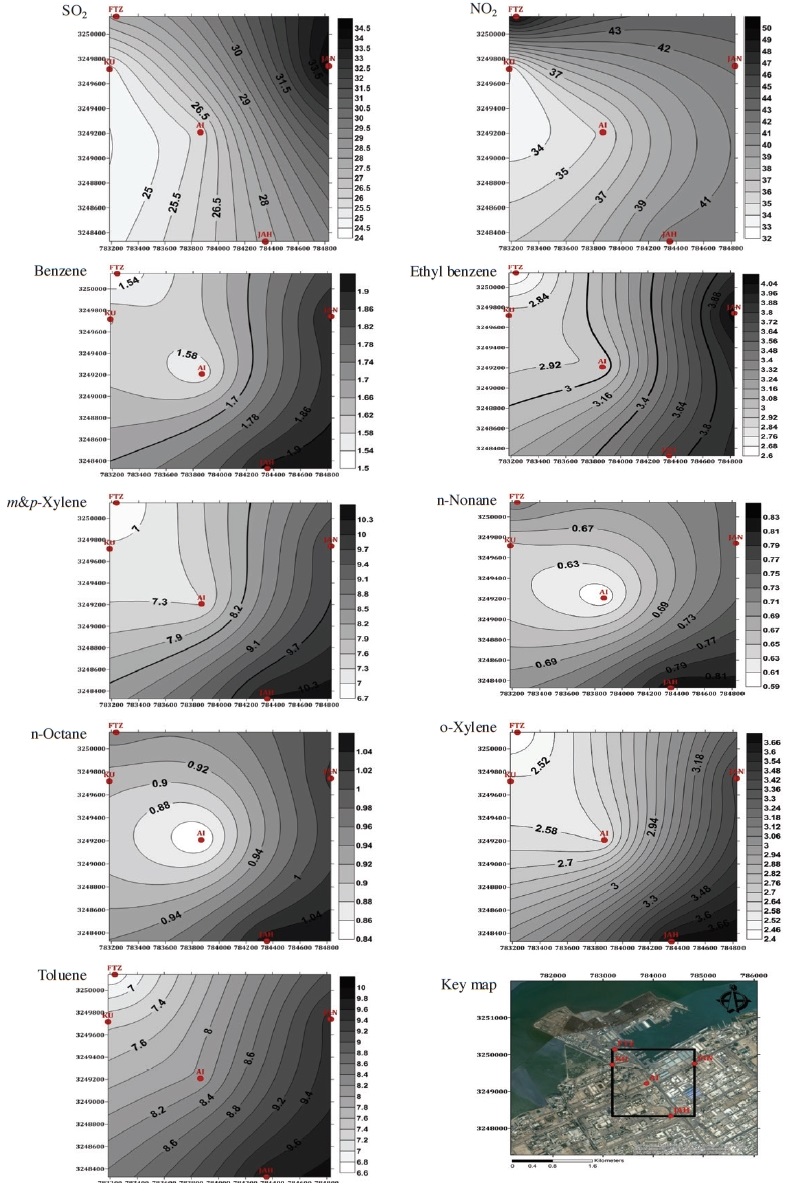
Spatial distributions of measured pollutants in the study area are presented in Fig. 4. It is evident from Fig. 4 that patterns in the BTEX concentrations were similar for all of the compounds, with elevated mean concentrations in industrial areas. This may confirm that some BTEX compounds are emitted from traffic movements and that the source is local rather than from surrounding refineries or oil fields. The spatial distribution of SO2 was similar to that of the BTEX compounds, with peak concentrations occurring in the northeast and southeast sectors (industrial areas). The spatial distribution of NO2 showed a slightly different pattern, with higher mean concentrations at the free trade zone where the greatest traffic congestion occurs because of major ongoing road construction. NO2 emissions in the study area were likely also associated with other emission sources such as from the port and light industrial activities. Because of the diverse sources, high concentrations of NO2 were also spread throughout the northeast and southeast sectors of the study area.
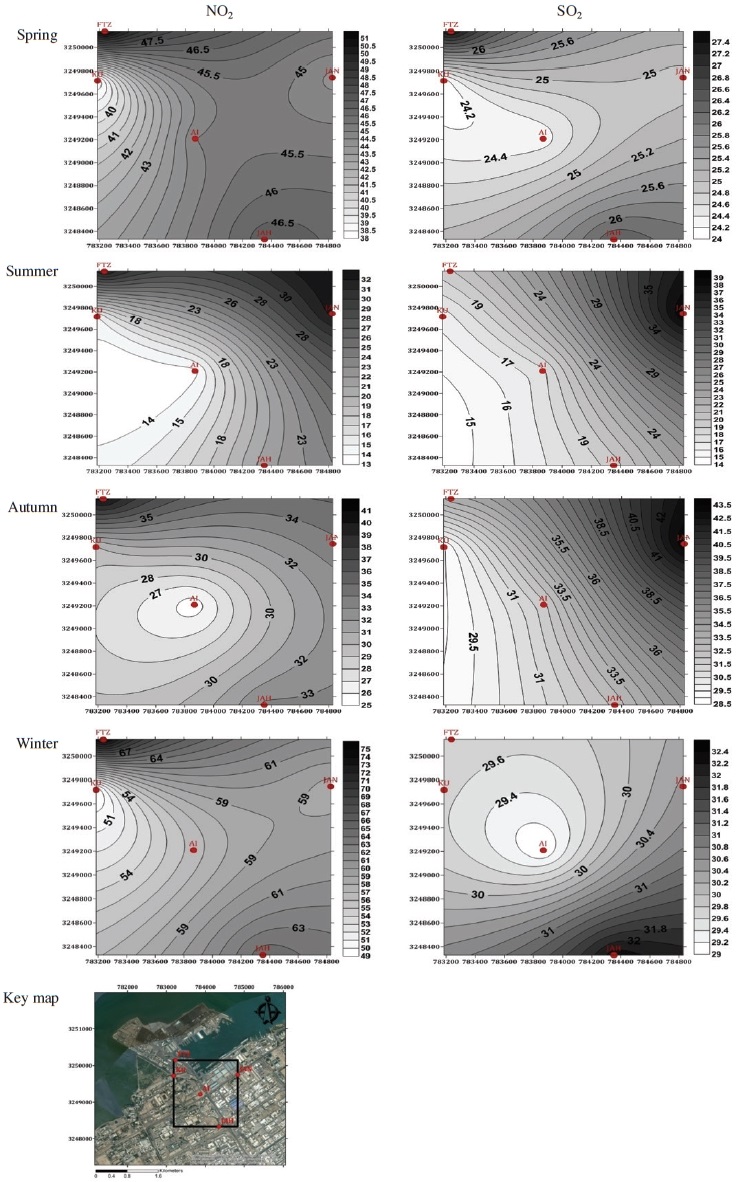
Contour plots of the NO2 and SO2 concentrations during the four seasons are shown in Fig. 5. NO2 and SO2 concentration distributions showed variable spatial distributions for each season. Peak concentrations occurred in the northeast (sea port area) and southeast (light industrial area). During spring however, their highest concentrations occurred in the free trade zone. The lowest concentrations occurred in a zone extending between the educational area and an area between the port and industrial area. During summer, the concentrations of NO2 and SO2 gradually increased moving from the educational area towards the industrial area, with peak NO2 concentrations at the free trade zone, confirming that traffic was the main source of NO2 emission in the study area. During autumn, elevated concentrations of SO2 occurred in the northeast and southeast sectors, which were similar to the pattern observed during spring, while NO2 concentrations during autumn were highest in the free trade zone. During winter, the distributions of NO2 and SO2 concentrations were slightly different than their distributions during the summer. The highest SO2 concentrations occurred in the southeast (light industrial area), while the highest NO2 concentrations occurred in the northeast (sea port), southeast and free trade zone. This trend is in agreement with general wind directions in Kuwait. The seasonal meteorological conditions indicated possible NO2 and SO2 contributions from power plants to the north of the study area and other power plants and refineries to the south. SO2 concentrations in the study area largely depended on emissions from heavy-duty vehicles, ships and some emissions from distant power stations. The study area was near a busy port where goods are transported on heavy trailers using diesel and gasoline.
Table 4 compares mean concentrations of NO2 and SO2 gases in Kuwait City reported by Al-Awadhi (2014) with the findings of this study and applicable air quality standards (AQS) from the Kuwait EPA. Since the measured values represent a period of days, thus yearly AQS was applied for comparison purpose; K-EPA provides hourly, daily and yearly allowable limits for NO2 and SO2 emissions. The comparison shows that the measured concentrations of NO2 and SO2 in this study were higher than those previously measured in Kuwait city by factors of 1.4 and 2.1, respectively, while the BTEX compound concentrations were lower than those previously measured in Kuwait City. A comparison between the results presented in Table 3 and 4 indicates that none of the mean measured gas concentrations exceeded the Kuwait EPA allowable limits. The peak NO2 concentration during winter (74.9 μg/m3) at the free trade zone was the only exceedance of the Kuwait EPA yearly standard for a residential area (67 μg/m3). The compression also shows that the mean measured BTEX compounds are extremely less than allowable exposure limits provided by OSHA.
5. CONCLUSION
A preliminary assessment of ambient air quality in the study area revealed that the concentrations of SO2 and NO2 were below the Kuwait EPA allowable limits and the mean measured concentrations of BTEX compounds were low and less than the relevant United States Environmental Protection Agency annual threshold values. This study also showed that the educational area in the study area had lower concentrations of measured pollutants than those in the light industrial area. However, NO2 emissions increased at certain times because of traffic congestion in and nearby the educational area. The spatial distributions of the measured gaseous pollutants were consistent with the influence of the prevailing seasonal wind directions, traffic volumes and industrial activities.
Acknowledgments
This work was supported by Kuwait University Research Grant No. [SE03/08]. The author gratefully acknowledges the assistance and statistical analysis support provided by Ms. Shahrzad Gashasi from Solution for Environmental Consultancy Office.
REFERENCES
-
Al-Awadhi, J.M., (2014), Measurement of air pollution in Kuwait city using passive samplers, Atmospheric and Climate Sciences, 4, p253-271.
[https://doi.org/10.4236/acs.2014.42028]

- Al-Harbi, M., (2014), Assessment of air quality in two different urban localities, International Journal of Environmental Research, 8(1), p15-26.
-
Al-Mutairi, N., Koushki, P., (2009), Potential contribution of traffic to air pollution in the State of Kuwait, American Journal of Environmental Sciences, 5(3), p218-222.
[https://doi.org/10.3844/ajessp.2009.218.222]

-
Ayers, G.P., Keywood, M.D., Gillet, R.W., Manins, P.C., Malfroy, H., Bardsley, T., (1998), Validation of passive diffusion samplers for SO2 and NO2, Atmospheric Environment, 32, p3593-3609.
[https://doi.org/10.1016/s1352-2310(98)00079-x]

- Ayers, G.P., Peng, L.C., Gillet, R.W., Fook, L., (2002), Rainwater composition and acidity at five sites in Malaysia in 1996, Water, Air and Soil Pollution, 133, p15-30.
- Brunekreef, B., Holgate, S., (2002), Air pollution and health, The Lancet, 360(9341), p1233-1242.
- CalTOXTM Version 1.5, (1994), A Multimedia Total Exposure Model for Hazardous-Waste Sites, Prepared by The University of California, Davis in Cooperation with Lawrence Livermore National Laboratory for the Office of Scientific Affairs Department of Toxic Substances Control California Environmental Protection Agency, Sacramento, California.
- Clench-Aas, J., Bartonova, A., Bøhler, T., Grønskei, K.E., Sivertsen, B., Larssen, S., (1999), Air pollution exposure monitoring and estimating, Part I. Integrated air quality monitoring system, Journal of Environmental Monitoring, 1, p313-319.
-
Costabile, F., Bertoni, G., Desantis, F., Wang, F., Weimin, H., Fenglei, L., Allegrini, I., (2006), A preliminary assessment of major air pollutants in the city of Suzhou, China, Atmospheric Environment, 40, p6380-6395.
[https://doi.org/10.1016/j.atmosenv.2006.05.056]

- Dutta, C., Som, D., Chatterjee, A., Mukherjee, A.K., Jana, T.K., Sen, S., (2009), Mixing ratios of carbonyls and BTEX in ambient air of Kolkata, India and their associated health risk, Environmental Monitoring Assessment, 147, p97-107.
- Ferm, M., Rodhe, H., (1997), Measurements of air concentrations of SO2, NO2 and NH3 at rural and remote sites in Asia, Journal of Atmospheric Chemistry, 27, p17-29.
-
Ferm, M., Svanberg, P.A., (1998), Cost-efficient techniques for urban- and background measurements of SO2 and NO2, Atmospheric Environment, 32, p1377-1381.
[https://doi.org/10.1016/s1352-2310(97)00170-2]

- Gillett, R.W., Ayers, G.P., Mhwe, T., Selleck, P.W., Harjan, H., (2000), Concentrations of nitrogen and sulfur species in gas and rainwater from several sites in Indonesia, Water, Air and Soil Pollution, 120, p205-2015.
-
Jallad, K., Espada-Jallad, C., (2012), Characterization of road traffic emissions in a densely populated residential area of Kuwait, Environment and Natural Resources Research, 2(2), p2-15.
[https://doi.org/10.5539/enrr.v2n2p2]

-
Levy, J.I., Greco, S.L., Spengler, J.D., (2002), The importance of population susceptibility for air pollution risk assessment: a case study of power plants near Washington, DC, Environmental Health Perspectives, 110(10), p1253-1260.
[https://doi.org/10.1289/ehp.021101253]

-
Pérez Ballesta, P., Field, R., Fernández-Patier, R., Galán-Madruga, D., Connolly, R., BaezaCaracena, A., De Saeger, E., (2008), An approach for the evaluation of exposure patterns of urban populations to air pollution, Atmospheric Environment, 42(21), p5350-5364.
[https://doi.org/10.1016/j.atmosenv.2008.02.047]

- Seinfeld, J., (1986), Atmospheric chemistry and physics of air pollution, New York, Wiley-Interscience.
-
Zhou, Y., Levy, J.I., Hammitt, J.K., Evans, J.S., (2003), Estimating population exposure to power plant emissions using CALPUFF: a case study in Beijing, China, Atmospheric Environment, 37(6), p815-826.
[https://doi.org/10.1016/s1352-2310(02)00937-8]

