Evaluation of Water Retentive Pavement as Mitigation Strategy for Urban Heat Island Using Computational Fluid Dynamics
Abstract
Here we evaluated the effect of using water retentive pavement or WRP made from fly ash as material for main street in a real city block. We coupled computational fluid dynamics and pavement transport (CFD-PT) model to examine energy balance in the building canopies and ground surface. Two cases of 24 h unsteady analysis were simulated: case 1 where asphalt was used as the pavement material of all ground surfaces and case 2 where WRP was used as main street material. We aim to (1) predict diurnal variation in air temperature, wind speed, ground surface temperature and water content; and (2) compare ground surface energy fluxes. Using the coupled CFD-PT model it was proven that WRP as pavement material for main street can cause a decrease in ground surface temperature. The most significant decrease occurred at 1200 JST when solar radiation was most intense, surface temperature decreased by 13.8°C. This surface temperature decrease also led to cooling of air temperature at 1.5 m above street surface. During this time, air temperature in case 2 decreased by 0.28°C. As the radiation weakens from 1600 JST to 2000 JST, evaporative cooling had also been minimal. Shadow effect, higher albedo and lower thermal conductivity of WRP also contributed to surface temperature decrease. The cooling of ground surface eventually led to air temperature decrease. The degree of air temperature decrease was proportional to the surface temperature decrease. In terms of energy balance, WRP caused a maximum increase in latent heat flux by up to 255 W/m2 and a decrease in sensible heat flux by up to 465 W/m2.
Keywords:
Water retentive pavement, Urban heat island, Computational fluid dynamics, Mitigation strategy, Heat and moisture transport1. INTRODUCTION
The warming of urban surfaces such as streets and buildings has been proven to be one major contributing factor to urban heat island or UHI phenomenon (Golden and Kaloush, 2006; Asaeda and Ca, 2000; Asaede and Ca, 1996; Asaede and Ca, 1993; Oke, 1982). Thus, mitigation strategies that improve urban surfaces could be most effective in moderating UHI. For example, the use of “cool” pavements have been gaining popularity. A pavement is considered “cool” if it has high albedo and high emissivity or it has high latent heat of evaporization (Santamouris, 2013). A number of studies investigated the thermal and moisture characteristics of pavement materials with high latent heat flux of evaporization, referred to as water retentive pavement or WRP (Cortes et al., 2016; Kinoshita et al., 2012; Takebayashi and Moriyama, 2012; Misaka et al., 2009; Ueno and Tamaoki, 2009; Yamamoto et al., 2006; Asaeda and Ca, 2000). Other studies also evaluated the thermal performance and effectiveness of high albedo, reflective pavements (Guntor et al., 2014; Wan and Hien, 2012; Kawakami and Kub, 2008). The combined effect of both reflective and permeable pavements as UHI mitigation was also examined (Takebayashi et al., 2014; Li et al., 2012). Very few studies evaluated the performance of these pavements in urban areas. Nayakama and Fujita (2010) coupled the National Institute for Environmental Studies (NIES) Integrated Catchment-based Eco-hydrology model with urban canopy model to evaluate the role of retentive pavements in UHI mitigation. They found out that air temperature above the WRP is much lower than the air temperature above lawn or building rooftop. Georgakis et al. (2014) evaluated cool pavements and roof coated with high reflection paints as UHI mitigation. They used computational fluid dynamics (CFD) model to calculate surface temperature and air temperature within the urban canyon. Their model estimated a 7-8°C decrease in surface temperature at ground level. However, none of the existing studies evaluated the pavement performance when used in a real city. Here we evaluated the effect of using WRP made from fly ash as material for main street in a real city block. We chose Suita City for analysis because important information such as building height and coverage were available. Suita City is also one of the main cities in Osaka Prefecture and its urban environment has not been modeled yet. We used CFD model to examine energy balance in the building canopies and coupled it with the pavement transport model (referred to as PT model) we originally developed. The PT model calculates for ground surface energy balance, ground surface temperature and ground surface water content. The governing equations and validation of the PT model are not presented in this paper because these were already reported by Cortes et al., 2016. This study was conducted as a continuation and focused on the application of PT model in real urban scenario. The specific objectives are: to (1) predict diurnal variation in air temperature, wind speed, ground surface temperature and water content; and (2) compare ground surface energy fluxes. This paper serves as a case study and would be the first to present the findings of the newly developed and coupled CFD-PT model. The results can be used for future urban planning especially in assessing the use of cool pavements before the real application in urban areas.
2. Methods of simulation
2. 1 Area of Analysis
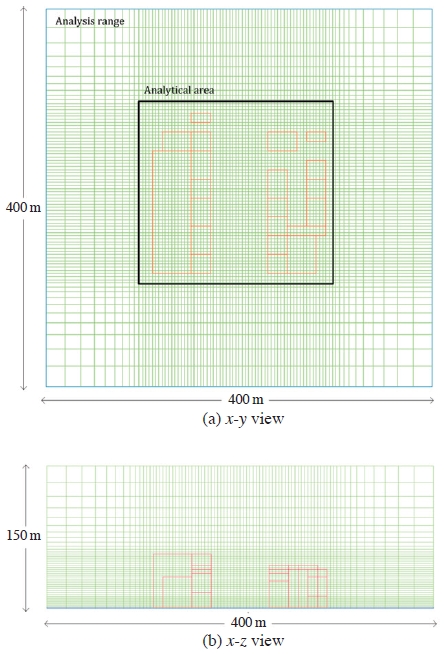
The Suita City government had selected two regions within the city where UHI mitigation strategies shall be implemented (Suita City, 2016). One of these regions is Esaka, the analysis area, which is a highly urbanized district with major roads, residential and industrial buildings. Prior to simulation, a 3D model of Esaka (4.758°N, 135.497°E) was created as shown in Fig. 1. The 3D model was then divided into meshes with a grid interval of 5 m. Fig. 2 shows the domain size and the analyzed area surrounded by the solid line. There were 22 buildings with the highest building being 56 m. The total mesh number in the CFD model was 80×77×47 including the virtual space. For the PT model, which is one dimensional, the total mesh number was 16 with a grid interval of 0.01 m.
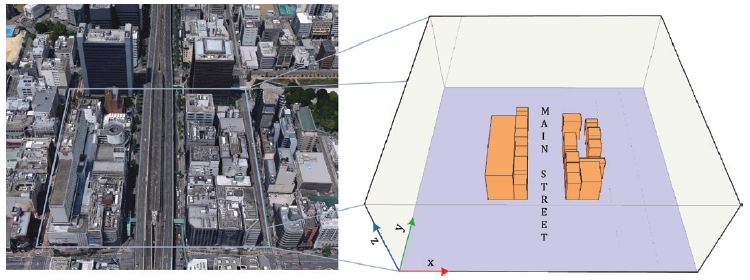
Esaka district (4.758°N, 135.497°E) as seen from Google Earth (2015) and its corresponding 3D model.
2. 2 Boundary Conditions
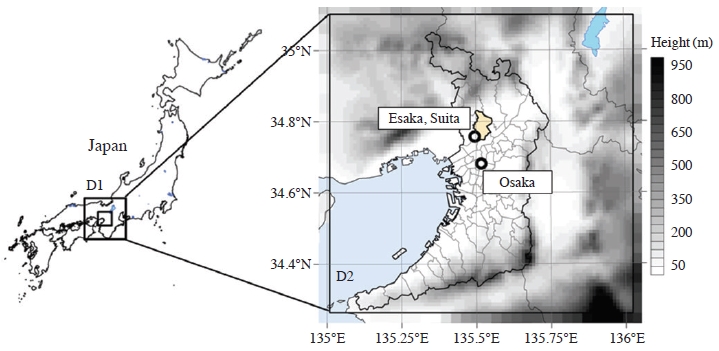
The Weather Research Forecasting (WRF) model version 3.5.1 (Skamarock et al., 2008) was used to determine the boundary conditions of the CFD model. Fig. 3 shows two WRF domains: the coarser domain (D1) covering Kansai region with 90×90 grid cells and horizontal grid resolution of 3 km, and the finer domain (D2) covering Osaka Prefecture, which includes Suita City with 90×90 grid cells and horizontal grid resolution of 1 km. The vertical domain consists of 30 layers from the surface to 100 hPa with the middle height of the first, second and third layers are about 28 m, 92 m and 190 m above the surface, respectively. Except for the calculation period, the WRF configurations were essentially the same as those in Shimadera et al. (2015), the Yonsei University planetary boundary layer scheme (Hong et al., 2006), the WRF single-moment 6-class microphysics scheme (Hong and Lim, 2006), the Noah land surface model (Chen and Dudhia, 2001), the rapid radiative transfer model (Mlawer et al., 1997) for the long wave radiation, and the shortwave radiation scheme of Dudhia (1989) with initial and boundary conditions derived from the mesoscale model grid point value data by the Japan Meteorological Agency (JMA).
The WRF simulation was conducted using online one-way nesting in the two domains for August 8-9, 2011 with a 7-day initial spin-up. This period was chosen because there was clear and calm weather due to the high pressure system that formed above Japan (Fig. 4a). Because of the lack of meteorological observatory in Suita City, the WRF results in the study period were compared with observation data of JMA at the Osaka meteorological observatory at (135.518°E, 34.682°N) in Osaka City (Fig. 4b). WRF fairly well simulated temporal variations of air temperature and wind, including daytime stronger wind caused by prevailing southwesterly sea breeze and nocturnal calm condition. The WRF results at Esaka, Suita City for the CFD boundary conditions were generally similar to those at the Osaka meteorological observatory.
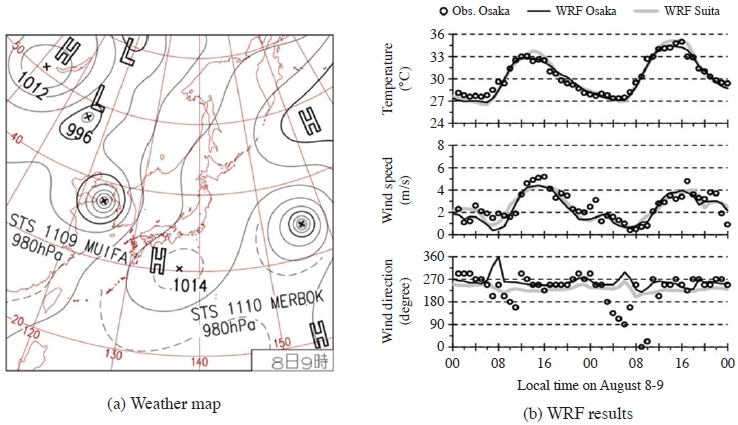
Weather map at 0900 JST on August 8, 2011 obtained from JMA (a); time series of observed and WRF-simulated temperature and wind at Osaka meteorological observatory and WRF-simulated values at Esaka, Suita on August 8-9 (b).
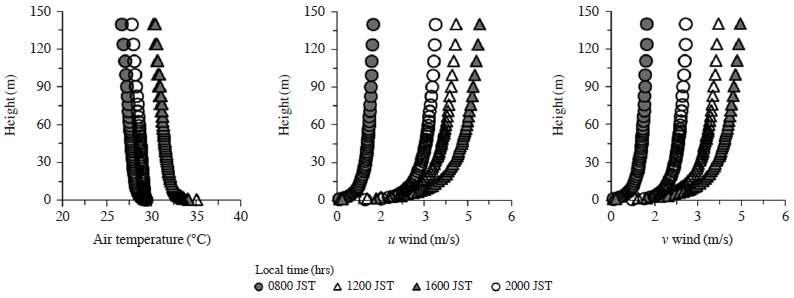
Owing to the coarser vertical resolution of WRF model compared with CFD, Monin-Obukhov Similarity Theory (MOST) was applied. The MOST defines the vertical distribution of wind speed and air temperature using hourly WRF data at heights 28 m and 92 m with a roughness length of 0.1 m. Fig. 5 shows the lateral boundary conditions of CFD for air temperature and wind components u and v at each vertical level. Air temperature was warmer in the surface layer especially during noon. Wind speed was stronger during daytime and wind direction was generally south-west because of prevailing sea breeze.
2. 3 The CFD-PT Model
The CFD model was composed of the conservation equations for momentum, continuity and mass. The k-ε turbulence model was used for turbulence while Semi-Implicit Method for Pressure Linked Equations (SIMPLE) algorithm (Pantakar, 1980) was utilized for pressure corrections. The CFD model calculated for air temperature, wind speed, air humidity, downward longwave radiation and shortwave radiation and supplied these parameters to the PT model. The CFD calculation was conducted for 24 h from 0500 Japan Standard Time (JST) on August 8 to 0500 JST August 9, 2011 with a time step of 0.5 s. Linear interpolation was applied to the hourly data obtained from the WRF model in order to update the lateral boundaries of the CFD model every time step.
There were two surface energy budget model incorporated into the CFD model. One is the building envelope model or BEM (Eq. (1)), used to calculate heat transfer from building surface to atmosphere. For a detailed discussion of the BEM refer to Cortes et al. (2015).
| (1) |
Here ε is emissivity, σ is Stefan-Boltzmann constant (W/m2 K4), Tbso is the temperature of outer building surface (°C), fi,j is view factor of each surface element j from element i, Tj is temperature of surface j, αbs is building surface albedo, S↓ is shortwave radiation (W/m2), ρa is air density (g/cm3), cp is specific heat at constant pressure (J/kgK), cH_bs is bulk heat transfer coefficient, u is wind speed (m/s), Tair is air temperature (°C) and Q is heat flux (W/m2). The method for calculating solar radiation and view factor can be obtained from Ikejima et al. (2011).
Second is the PT model which simulates heat transfer from ground surface to the atmosphere. The PT model was composed of conservation equations for heat and soil moisture. The parameters used were volumetric water content θ (m3/m3), evaporation efficiency β and matric potential ψ (m). The β was defined from the evaporation equation (Eq. (2)) for bare soil developed by Kondo et al. (1990). The van Genuchten-Mualem model shown in Eq. (3)-(4) was used to express the relationship between ψ and θ (van Genuchten, 1980; Mualem, 1976).
| (2) |
| (3) |
| (4) |
Here E is evaporation rate (kg/m2s), CE is bulk coefficient of evaporation, qs is specific humidity (g/kg) at ground surface temperature Ts (°C), qa is specific humidity of air (g/kg), θsat is saturated volumetric water content, x and n are van Genuchten curve-fitting parameters, m=1- (1/n), K is the hydraulic conductivity (m/s) and Ksat is saturated hydraulic conductivity (m/s). In this study we were interested in determining the maximum performance of WRP hence the initial θ was set at saturation level (Table 1) and we did not consider other scenarios like varying initial θ. The ground surface energy balance is shown in Eq. (5) where the left terms represent radiation and right terms represent sensible heat flux, latent heat flux, ground heat flux respectively.
| (5) |
where αg is ground albedo, L↓ is downward longwave radiation (W/m2), H is sensible heat flux (W/m2), l is latent heat of vaporization (J/kg) and G is heat flux into the soil (W/m2). The heat fluxes were solved using Eq. (6)-(8).
| (6) |
| (7) |
| (8) |
The bulk coefficient for the sensible heat flux, CH_gs, was assumed to be equal to CE based on Kondo et al. (1990). The initial values of parameters used in PT model are listed in Table 1. The PT model calculation time step was 60 s.
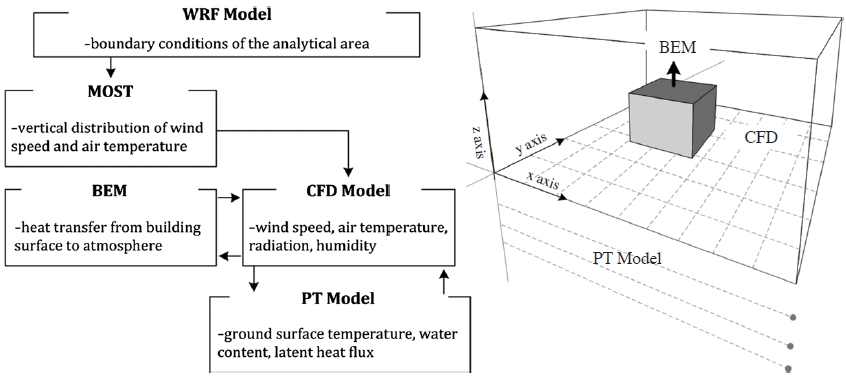
Fig. 6 shows the model integration and the variables calculated in each system. Using the coupled CFD-PT model, two cases of 24 h unsteady analysis were simulated. In case 1, asphalt was used as the pavement material of all ground surface. In case 2, WRP was used as the pavement material of the main street and asphalt for the rest of the ground surface.
3. Results and Discussion
3. 1 Effect on Ground Surface Temperature
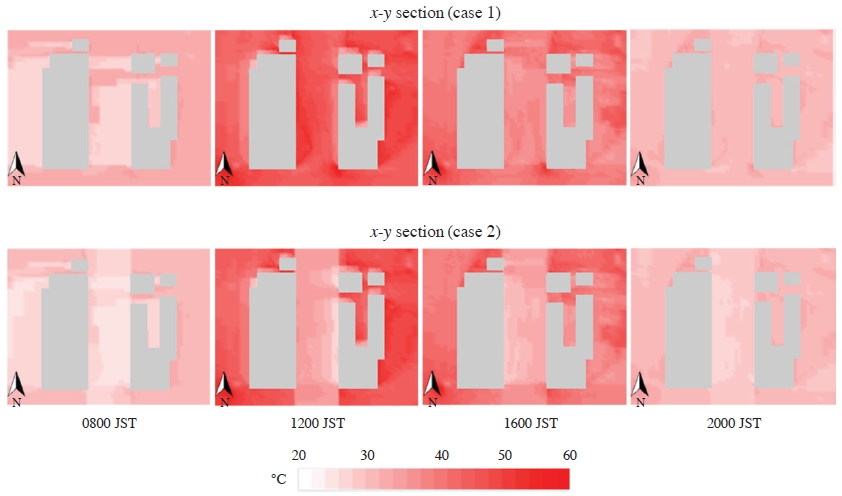
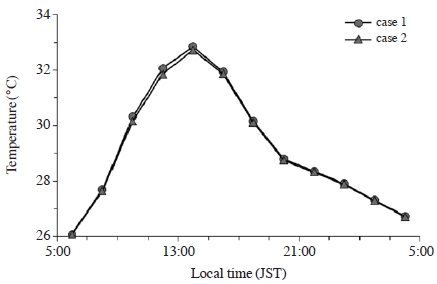
Examining the average diurnal variation in ground surface temperature within the analysis area (Fig. 7), it can be seen that Ts in case 2 was consistently lower throughout the day. As Cortes et al. (2016) pointed out, the cooling property of WRP compared with asphalt can be attributed to three factors namely water content, albedo and thermal conductivity. However, by creating a graphical representation of the diurnal variation in Ts, it was discovered that shadow effect also contributed to a decrease in surface temperature (Fig. 8). True for both case 1 and case 2, Ts on the western side of the buildings decreased at 0800 JST. During this time the shadow formed on the west as the sun rose in the east.
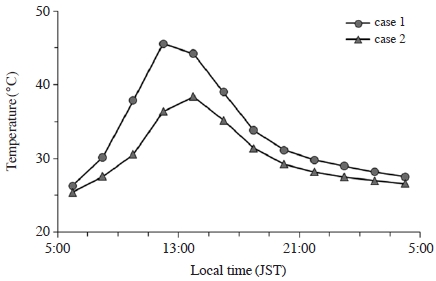
The diurnal variation in ground surface temperature, Ts, within the analysis range for 24-h time period.
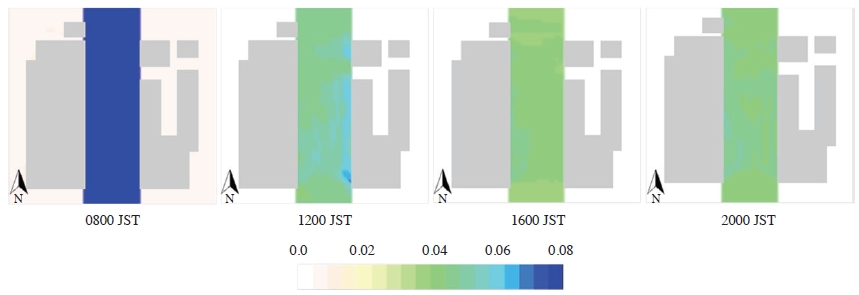
Here we focus the discussion to the difference between main street Ts in case 1 and case 2. Results show that Ts in case 2 main street decreased by 3.1°C at 0800 JST. We attribute this to the greater water content of WRP compared with asphalt which led to evaporative cooling and increased latent heat flux (discussed in section 3.3). This agrees with the study of Asaeda (1993) on evaporation in bare soil where the transport of water vapor inside soil affects subsurface distribution of temperature greatly. Due to evaporation, bare soil is cooler than covered surfaces such that increase in thickness of the covering material causes temperature increase and higher heat stored. Similar to bare soil, the ability of WRP to hold water and its porosity allow for water transport thus affecting subsurface distribution of temperature. It can be seen in Fig. 9 that at 0800 JST, the average water content of WRP was 0.08 which was still near to the saturation level of 0.09. At 1200 JST the water content decreased to 0.05, the greatest change throughout the day. This can be expected because at noontime, the sun was most intense. Increased solar radiation further promoted evaporation of water from surfaces. It also explains the greatest difference in Ts between case 1 and case 2; during this time, Ts in case 2 main street decreased by 13.8°C. From 1600 JST to 2000 JST the surface water content remained at 0.04 but the surface temperature continued to decrease. During this time, Ts of case 2 main street decreased by 5.7°C and 2.9°C. respectively. We attribute this decrease in Ts despite the constant surface water content to both higher albedo and lower thermal conductivity of WRP compared with asphalt (Table 1). Both factors allowed reflection of sunlight during daytime and minimized the release of heat during night time. These estimates of main street Ts between case 1 and case 2 were proximate to the observations of Cortes et al. (2016) on the behavior of asphalt and WRP in an outdoor set-up.
3. 2 Effect on Air Temperature
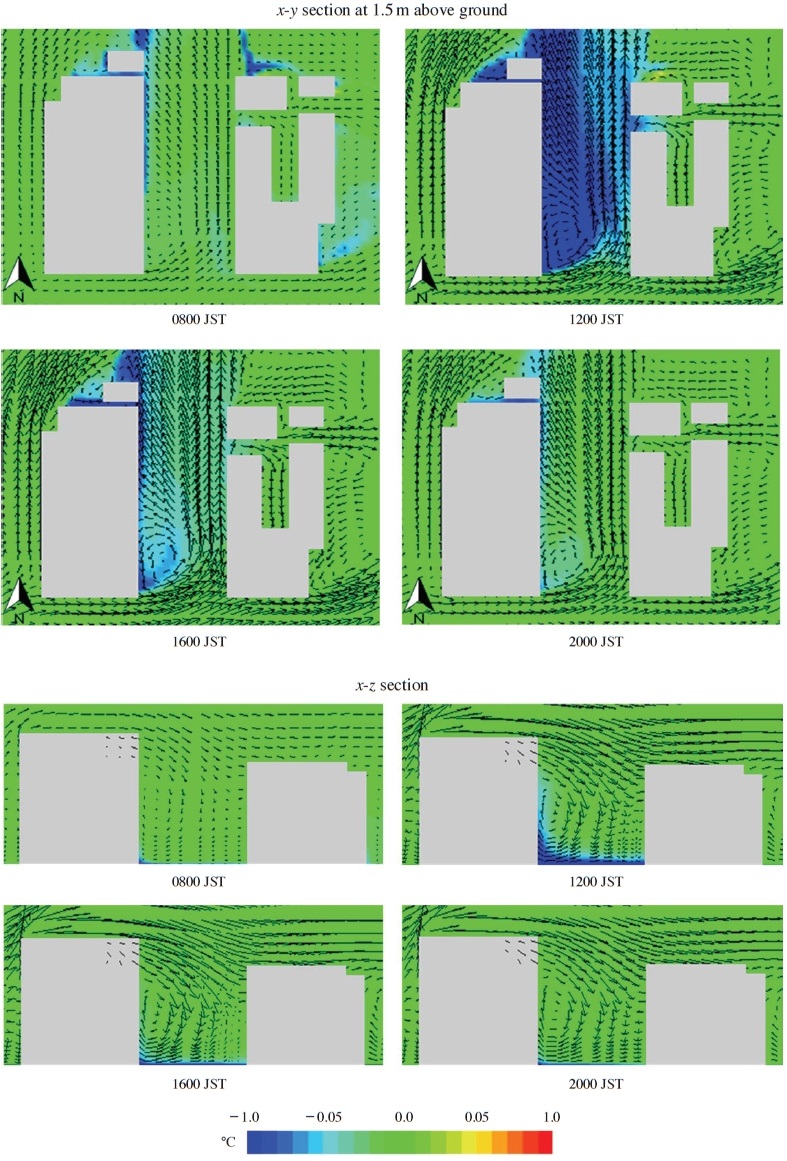
In this section we discuss the effect of WRP on diurnal variation in air temperature. The CFD-PT model estimated an overall decrease in air temperature at 1.5 m within the analysis area (Fig. 10). The average air temperature difference over main street was computed as case 1 Tair - case 2 Tair. Results show that air temperature in case 2 decreased by 0.05°C at 0800 JST, 0.3°C at 1200 JST, 0.1°C at 1600 JST and 0.06°C at 2000 JST. The air temperature decrease was most pronounced at 1200 JST which is proportional to the degree of surface temperature cooling. Looking at the x-y section in Fig. 11, the decrease is particularly noticeable on the western side of the main street area. We attribute this to the stronger wind towards north-west direction which is evident in the wind profile.
By examining the x-z section, we can see greater air temperature decrease above WRP surface (main street) compared with asphalt surface (none main street areas) confirming the occurrence of evaporative cooling. Moreover, there was also vortex formation within the street canyon. This vortex allowed for mixing of air that eventually caused cooler air from the ground to rose.
3. 3 Effect on Energy Fluxes
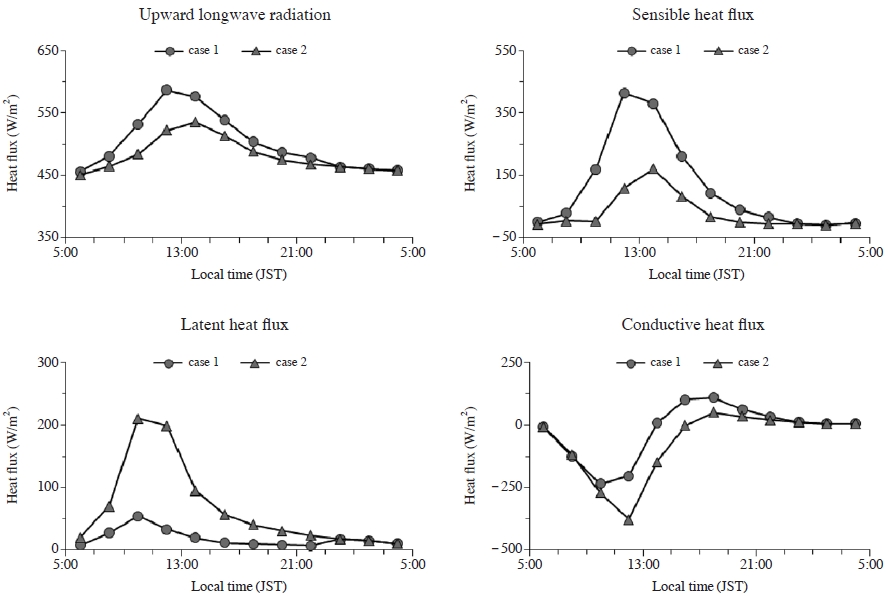
Fig. 12 shows the diurnal variations in ground surface energy fluxes within the analysis area. Results show an overall increase in latent heat flux and decrease in sensible heat flux, conductive heat flux and upward longwave radiation throughout the day. Due to the significant decrease in main street Ts, a comparison of the surface energy fluxes in the same area was also carried out. The ground surface energy flux difference over main street was computed as case 1 heat flux- case 2 heat flux. The model estimated an average increase in latent heat flux by up to 51 W/m2 at 0800 JST, 255 W/m2 at 1200 JST, 68 W/m2 at 1600 JST and 34 W/m2 at 2000 JST. This diurnal variation in latent heat flux was also relative to the diurnal variation in water content discussed previously. As the sun started to become intense from morning to noon, evaporation rate also increased dramatically. Consequently, this increase in latent heat flux caused a particularly slight difference between Ts and Tair, allowing for a distinct decrease in sensible heat flux. As expected from the increase in latent heat flux, maximum decrease in sensible heat flux occurred at 1200 JST. During this time sensible heat flux in case 2 decreased by 465 W/m2. The longwave radiation also decreased by 97 W/m2.
4. Conclusion
Using the coupled CFD-PT model it was proven that WRP as pavement material for main street can cause a decrease in ground surface temperature. This cooling is primarily due to the evaporation of water from WRP surfaces thereby causing an increase in latent heat flux. The increase in latent heat flux minimizes the difference between air temperature and surface temperature which leads to a decrease in sensible heat flux and longwave upward radiation. Other contributing factors to the cooling of WRP surface include high albedo and lower thermal conductivity. The cooling of ground surface eventually leads to air temperature decrease. The degree of air temperature decrease is proportional to the surface temperature decrease.
Acknowledgments
This research was supported by the JSPS KAKENHI grant number 26420581 and the Japan Ministry of Education, Culture, Sports and Technology scholarship.
REFERENCES
-
Asaeda, T., Ca, V.T., (1993), The subsurface transport of heat and moisture and its effect on the environment: a numerical model, Boundary-Layer Meteorology, 65, p159-179.
[https://doi.org/10.1007/bf00708822]

-
Asaeda, T., Ca, V.T., (2000), Characteristics of permeable pavement during hot summer weather and impact on the thermal environment, Building and Environment, 35, p363-375.
[https://doi.org/10.1016/s0360-1323(99)00020-7]

-
Asaeda, T., Ca, V.T., Wake, A., (1996), Heat storage of pavement and its effect on the lower atmosphere, Atmospheric Environment, 30, p413-427.
[https://doi.org/10.1016/1352-2310(94)00140-5]

-
Chen, F., Dudhia, J., (2001), Coupling an advanced land-surface/hydrology model with the Penn State/NCAR MM5 modeling system. Part I: Model implementation and sensitivity, Monthly Weather Review, 129, p569-585.
[https://doi.org/10.1175/1520-0493(2001)129<0569:caalsh>2.0.co;2]

- Cortes, A., Kondo, A., Shimadera, H., Hongu, S., (2016), Numerical evaluation of the transport of heat and moisture in water retentive pavement, Journal of Japan Society for Atmospheric Environment, 51, p103-110.
-
Cortes, A., Murashita, Y., Matsuo, T., Kondo, A., Shimadera, H., Inoue, Y., (2015), Numerical evaluation of the effect of photovoltaic cell installation on urban thermal environment, Sustainable Cities and Society, 19, p250-258.
[https://doi.org/10.1016/j.scs.2015.07.012]

-
Dudhia, J., (1989), Numerical study of convection observed during the Winter Monsoon Experiment using a mesoscale two-dimensional model, Journal of the Atmospheric Sciences, 46, p3077-3107.
[https://doi.org/10.1175/1520-0469(1989)046<3077:nsocod>2.0.co;2]

-
Georgakis, C., Zoras, S., Santamouris, M., (2014), Studying the effect of “cool” coatings in street urban canyons and its potential as a heat island mitigation technique, Sustainable Cities and Society, 13, p20-31.
[https://doi.org/10.1016/j.scs.2014.04.002]

-
Golden, J.S., Kaloush, K.E., (2006), Mesoscale and microscale evaluation of surface pavement impacts on the urban heat island effects, International Journal of Pavement Engineering, 7, p37-52.
[https://doi.org/10.1080/10298430500505325]

- Google Earth 7.1.5.1557, (2015), Esaka 34°45′29.29″N, 135°29′50.16″E, elevation 395M, 3D Buildings data layer, accessed on February 2016.
- Guntor, N.A., Din, M.F., Ponraj, M., Iwao, K., (2014), Thermal performance of developed coating material as cool pavement material for tropical regions, Journal of Materials in Civil Engineering, 26, p755-760.
- Hong, S.-Y., Lim, J.-O.J., (2006), The WRF Single-Moment 6-Class Microphysics Scheme (WSM6), Journal of the Korean Meteorological Society, 42, p129-151.
-
Hong, S.-Y., Noh, Y., Dudhia, J., (2006), A new vertical diffusion package with an explicit treatment of entrainment processes, Monthly Weather Review, 134, p2318-2341.
[https://doi.org/10.1175/mwr3199.1]

- Ikejima, K., Akira, K., Akikazu, K., (2011), The 24-h unsteady analysis of air flow and temperature in a real city by high-speed radiation calculation method, Building and Environment, 46(8), p1632-1638.
- Kawakami, A., Kubo, K., (2008), Development of a cool pavement for mitigating the urban heat island effect in japan water-retention pavement heat-shield pavement, International Society for Asphalt Pavements Conference 2008, p1-12.
- Kinoshita, S., Yoshida, A., Okuno, N., (2012), Evaporation performance analysis for water-retentive material based on outdoor heat-budget and transport properties, Journal of Heat Island Institute International, 7, p222-230.
-
Kondo, J., Saigusa, N., Sato, T., (1990), A parameterization of evaporation from bare soil surfaces, Journal of Applied Meteorology, 29, p385-389.
[https://doi.org/10.1175/1520-0450(1990)029<0385:apoefb>2.0.co;2]

- Misaka, I., Narita, K., Yokoyama, H., (2009), Evaluation of evaporation ability of the system for mitigating urban heat island, The 7th International Conference on Urban Climate, B18-5.
-
Mlawer, E.J., Taubman, S.J., Brown, P.D., Iacono, M.J., Clough, S.A., (1997), Radiative transfer for inhomogeneous atmospheres: RRTM, a validated correlated-k model for the longwave, Journal of Geophysical Research D: Atmospheres, 102, p16663-16682.
[https://doi.org/10.1029/97jd00237]

- Mualem, Y., (1976), A new model for predicting the hydraulic conductivity of unsaturated porous media, Water Resource Research, 3, p513-522.
- Ohashi, Y., Ihara, T., Kikegawa, Y., Sugiyama, N., (2015), Numerical simulations of influence of heat island countermeasures on outdoor human heat stress in the 23 wards of Tokyo, Japan, Energy and Buildings, 114, p104-111.
-
Oke, T.R., (1982), The energetic basis of the urban heat island, Quarterly Journal of the Royal Meteorological Society, 108, p1-24.
[https://doi.org/10.1002/qj.49710845502]

- Pantakar, S.V., (1980), Numerical heat transfer and fluid flow, Taylor & Francis, New York, p126-131.
-
Santamouris, M., (2013), Using cool pavements as a mitigation strategy to fight urban heat island - A review of the actual developments, Renewable and Sustainable Energy Reviews, 26, p224-240.
[https://doi.org/10.1016/j.rser.2013.05.047]

-
Shimadera, H., Kondo, A., Shrestha, K.L., Kitaoka, K., Inoue, Y., (2015), Numerical evaluation of the impact of urbanization on summertime precipitation in Osaka, Japan, Advances in Meteorology, 2015, p1-11.
[https://doi.org/10.1155/2015/379361]

- Skamarock, W.C., Klemp, J.B., Dudhia, J., Gill, D.O., Barker, D.M., Duda, M.G, Huang, X.-Y., Wang, W., Powers, J.G., (2008), A Description of the Advanced Research WRF Version 3, NCAR Tech, Note NCAR/TN-475+STR, p113.
- Suita City: environmental information, data collection and business analysis, http://www.city.suita.osaka.jp/var/rev0/0090/2831/201276174559.pdf accessed on February 2016, [in Japanese].
-
Takebayashi, H., Kimura, Y., Kyogoku, S., (2014), Study on the appropriate selection of urban heat island measure technologies to urban block properties, Sustainable Cities and Society, 13, p217-222.
[https://doi.org/10.1016/j.scs.2014.01.008]

- Ueno, T., Tamaoki, K., (2009), Thermal characteristics of urban land cover by indoor lamp-irradiation experiment, The Seventh International Conference on Urban Climate, P1-28.
-
van Genuchten, M., (1980), A closed-form equation for predicting the hydraulic conductivity of unsaturated soils, Soil Science Society of America Journal, 44, p892-898.
[https://doi.org/10.2136/sssaj1980.03615995004400050002x]

- Wan, W., Hien, W., (2012), A study on the effectiveness of heat mitigating pavement coatings in Singapore, Journal of Heat Island Institute International, 7(2), p238-247.
-
Yamagata, H., Nasu, M., Yoshizawa, M., Miyamoto, A., Minamiyama, M., (2008), Heat island mitigation using water retentive pavement sprinkled with reclaimed wastewater, Water Science and Technology, 57, p763-771.
[https://doi.org/10.2166/wst.2008.187]

- Yamamoto, T., Maki, T., Honda, T., (2006), Discussions on assessment and quality standards of water-retaining concrete block, In 8th International Conference on Concrete Block Paving, p253-262.
