Distribution of Airborne Hexavalent Chromium Concentrations in Large Industrial Complexes in Korea
Abstract
This paper reports the results of a field evaluation which used sampling and analytical methods to determine the levels of airborne hexavalent chromium Cr(VI) in major industrial complexes in Korea over a seven year period (2007-2013). Cr(VI) concentrations were determined using cellulose filter sampling and ion chromatography analysis. In order to validate the analytical performance of these methods, studies were also carried out to investigate data quality control (QC) parameters, such as the method detection limit (MDL), repeatability, and recovery efficiencies. The average concentrations of Cr(VI) for the nine industrial complexes in Korea were in the range of 0.09 to 1.40 ng/m3, which is similar to of the concentrations in other industrial areas around the world. The impacts of Cr(VI) emissions from industrial areas on Cr(VI) concentrations in neighboring-residential areas were considerably low, and the dispersion of Cr(VI) from industrial areas to residential areas was estimated to be ‘not-significant’. Cr(VI) levels were not affected by seasonal variation, which suggests that chromium was emitted continuously from the industrial sources throughout the year. The concentration of Cr(VI) measured accounted for 0.7 to 9.4 percent of the total chromium level, which is a low percentage compared to those in other urban areas around the world. This is the first report in an international journal of a field study conducted in Korea to determine the concentration of Cr(VI) in the ambient air of industrial and residential areas.
Keywords:
Chromium, Ion chromatography, Hazardous air pollutants, Industrial complex1. Introduction
Chromium is widely distributed in nature, and present in several oxidation states in the environment. Chromium in ambient air exists primarily in the trivalent (Cr(III)) and hexavalent (Cr(VI)) oxidation states (Kotas and Stasicka, 2000). Cr(III) has known to be a naturally occurring-environmentally pervasive trace element, whereas Cr(VI) is generated anthropogenically from a variety of industrial sources. Cr(III) is an essential nutrient for humans and is non-toxic. Cr(VI), however, readily penetrates biological membranes and has been identified as an industrial toxin and carcinogen (Barceloux, 1999; Kimbrough et al., 1999; Singh et al., 1999; Cohen et al., 1993). The US EPA has classified Cr(VI) as a Group A human carcinogen when exposure occurs via inhalation (USEPA, 1984). Owing to the disparate effects of Cr(III) and Cr(VI) on human health, identifying the sources of chromium in airborne particulate matter is crucial when evaluating the toxicity of aerosols (Singh et al., 1999).
Most sources of atmospheric chromium are predominantly anthropogenic (60-70%) (Seigneur and Constantinou, 1995). Anthropogenic sources include the metal industry, brick manufacturing, plating, fuel combustion, waste incineration, the manufacture of chromium compounds such as chromates and di-chromates, the synthesis of dyes and pigments, the cleaning of metal parts in the automobile and aircraft industries, coal combustion, and others (Cohen and Costa, 2006). Natural sources include volcanic eruptions and soil and rock erosion (Kotas and Stasicka, 2000). A recent study reported that Cr(VI) is present mainly in particles less than 2.5 μm in diameter (Lin et al., 2008). Ambient fine particles (PM2.5) can travel long distances because they tend to remain suspended in air for long periods of time.
Occupational exposure to airborne Cr(VI) is associated with increased risk of lung and nasal cancers (Kotas and Stasicka, 2000; Barceloux, 1999; Kimbrough et al., 1999). Cr(VI) is listed as one of the 187 hazardous air pollutants (HAPs) in the United States due to its high toxicity. Moreover, Cr(VI) is included in the 33 urban air toxic pollutants and the 18 core HAPs in the United States. A class of ‘chromium and its compounds’ has been included in the list of HAPs in Korea since 1979. However, the general population lacks understanding of the effects of exposure to airborne Cr(VI) because there is insufficient data on the Cr(VI) levels in ambient air. In many countries, air quality monitoring programs only measure the total chromium levels in airborne particulate matter. The lack of data on the ambient concentration of Cr(VI), as opposed to total chromium, has been attributed to the difficulty of collecting and analyzing air samples for Cr(VI) measurements.
The average concentration of Cr(VI) in ambient air was found to be less than 0.5 ng/m3 in unpolluted areas of the United States (Seinfeld and Pandis, 2006). However, the average levels of Cr(VI) are likely to be high in areas near chromium emission sources. Despite this, no domestic studies in Korea have investigated the distribution of Cr(VI) in industrial areas and neighboring residential areas. This study, therefore, examined the concentration distribution of Cr(VI) in ambient air, according to location and season, in large-scale industrial complexes in Korea.
2. Methods
2. 1 Characteristics of Industrial Complexes
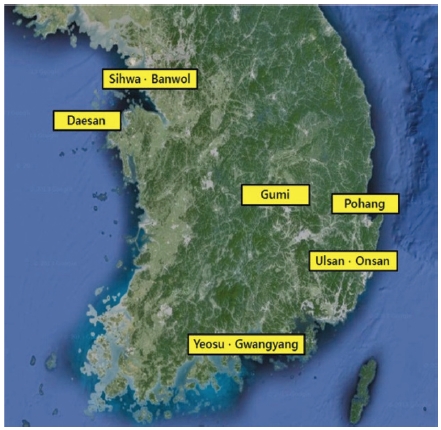
This study was set in Korea and involved a number of field studies in large-scale national industrial complexes with the potential to emit specific HAPs. Air samples were collected at industrial sites and neighboring residential areas simultaneously. Air sampling was performed in different industrial complex, or pair of complexes, each year from 2007 to 2013, beginning with Sihwa-Banwol (2007), Yeosu-Gwangyang (2008), Ulsan-Onsan (2009), Gumi (2010), Daesan (2011), and Pohang (2013). Fig. 1 shows the locations of these industrial complexes.
To give some background information on the industrial complexes located in different parts of Korea, we have summarized the characteristics of the resident companies of each industrial complex in Table 1. The companies have been classified by industry type in accordance with the Korean Standard Industrial Classification Code. Industry types include food and beverage, textile and apparel, wood and paper, petrochemical, non-metal and steel, machinery, electrical and electronics engineering, transportation equipment, nonmanufacturing, and others. The distribution of the major industries varies across complexes. The machinery and electrical-electronics industries accounted for the largest percentage of all businesses in the Sihwa-Banwol industrial complex. A very wide range of tenant companies can be found in this complex. The petrochemical industry accounted for the largest percentage of all businesses in the Yeosu industrial complex, while the major industries in the Gwangyang industrial complex were machinery, non-manufacturing and steel. Machinery, transportation equipment and petrochemical industries accounted for a large portion of businesses in the Ulsan and Onsan industrial complexes. The electrical-electronics industry accounted for a relatively large percentage of all businesses in the Gumi industrial complex. The steel and petrochemical industries accounted for a large portion in the Pohang and Daesan industrial complexes, respectively, indicating a relatively simple distribution of businesses in these two complexes.
2. 2 Sampling and Analytical Methods
Daily air samples were collected during an intensive measurement period of 7 to 11 days in each season and at each industrial complex. Precipitation days were inevitably included in the sampling periods due to the continuous nature of the sampling. Table 2 lists the sampling periods for each industrial complex.
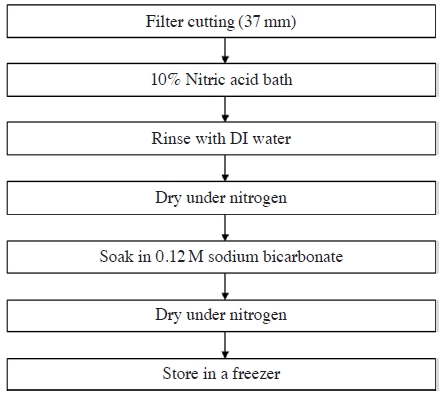
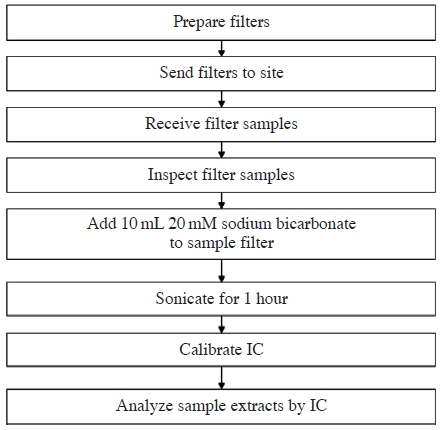
To measure the Cr(VI) levels in airborne particulate matter, samples were collected using cellulose filter paper (Cellulose, Whatman No. 41 ø37 mm) and a filter pack. In order to remove the impurities, the filter paper was washed, first with a nitric acid solution (HPLC grade, 10%) following by deionized water, and then dried in a glove box filled with nitrogen (99.999%). Once dried, the filter was impregnated with NaHCO3 (0.12 M) and then dried completely with nitrogen gas to be used as an air sampling medium (California EPA, 2002). The prepared filter paper was placed on a Petri dish and refrigerated at - 20℃. Fig. 2 shows the filter paper pre-treatment process. Considering the filter paper’s resistance to dust loading, air sampling was carried out at a flow rate of 10 L/min for 24 hours to collect samples sufficient for analysis. After sampling, the filter paper was stored in a freezer prior to analysis. To analyze the air samples, the filter paper was moved to a nitrogen-filled box and ultrasonic extraction was carried out for one hour with 10 mL of 20 mM NaHCO3. The extracted sample was analyzed immediately using ion chromatography (IC; Dionex DX-120). Fig. 3 shows a flowchart of the preparation and analysis of the Cr(VI) samples.
For the Cr(VI) analysis, 250 mM (NH4)2SO4 and 100 mM NH4OH were mixed to produce an eluting solution for IC, and 1,5-diphenylcarbazide and sulfate (99.999 %) were mixed to prepare a reagent for post-column derivatization. Table 3 lists the operating parameters for IC analysis. More details of the sampling and analysis of Cr(VI) can be found in the literature (Kang et al., 2009). As well as Cr(VI), total chromium was sampled using a high-volume air sampler (Sierra Andersen, Model UV-1), which was used for the measurement of other heavy metals associated with particulate matter. For heavy metal analysis, sample extraction was performed using a microwave oven (Milestone, Terminal 640), and samples were analyzed using ICP spectroscopy (USEPA, 1999).
2. 3 Quality Control/Quality Assurance(QC/QA)
The precision of the methods used was evaluated by obtaining the relative standard deviation (RSD) for the results of replicate analysis of a standard solution (0.5 ng/mL). The recovery efficiency and method detection limit (MDL) were measured by spiking pre-treated filter papers with a chromium standard solution (0.5 ng/mL) and subjecting them to the same extraction and analysis methods used on the field air samples. The MDL (99% confidence level) was estimated according to a USEPA method (USEPA, 1990). The recovery efficiency and MDL were confirmed repeating the measurements more than seven times. Table 4 summarizes repeatability (as RSDs), recovery efficiency and MDL of each field study for six of the industrial complexes.
3. Results and Discussion
3. 1 Spatial Distribution of Cr(VI) Concentrations
Table 5 presents the average (seasonal and annual) ambient concentrations of Cr(VI) for nine industrial complexes, that were measured sequentially from 2007 to 2013. In most cases, the measurement was conducted simultaneously at an industrial site and a neighboring residential site within the industrial complex. However, no residential sites were measured at the Sihwa-Banwol, or Onsan industrial complexes because no neighboring residential area was identified.
As shown in Table 5, the average concentration of Cr(VI) at the industrial site was highest in the Ulsan industrial complex (1.40 ng/m3), followed by the Banwol (0.80 ng/m3) and Sihwa (0.77 ng/m3) industrial complexes. In addition, the Cr(VI) concentration was relatively higher in the Pohang industrial complex (0.60 ng/m3) than in the other industrial complexes. The lowest Cr(VI) concentration at an industrial site was 0.09 ng/m3 in the Yeosu industrial complex, where a large number of petrochemical industries are located. However, it should be noted that direct comparison of Cr(VI) levels among different industrial complexes may not be quite adequate because the data in Table 5 lacks simultaneity, as the sampling years are all different in different cities.
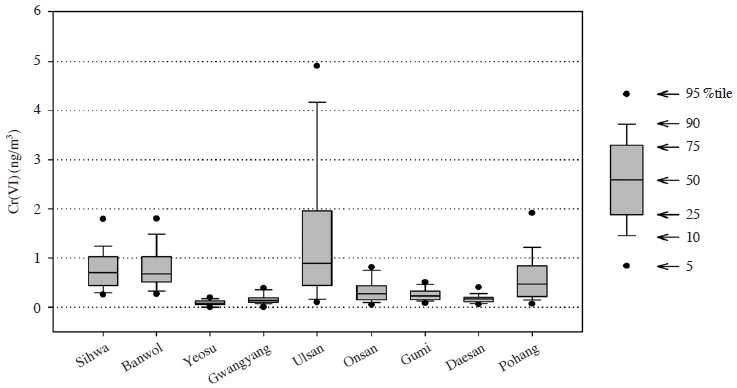
The ratio of average concentrations of Cr(VI) at industrial to residential sites was also calculated, and is presented in Table 5. For Ulsan and Pohang, the I/R ratio exceeded 2 for both of seasonal and annual averages, indicating the impact of industrial emissions of Cr(VI) from local sources on the measured Cr(VI) concentrations at monitoring sites. However, the I/R ratios for the other complexes ranged from 0.4 to 1.5, implying that there was no significant difference between the average levels of Cr(VI) at industrial and neighboring residential sites for these complexes. Fig. 4 shows a comparison of the distribution of Cr(VI) concentrations from nine different industrial complexes. A wide range of Cr(VI) concentrations was evident in Ulsan, Sihwa-Banwol, and Pohang, while in the other complexes the variation was relatively small.
As shown in Fig. 4, the Ulsan industrial complex, which has the highest Cr(VI) concentration, consists mainly of businesses in the machinery, transportation equipment, petrochemical, and non-ferrous metal industries, in that order. Similarly, the machinery, electrical-electronics, petrochemical, transportation equipment, and steel industries account for a large portion of the businesses in the Sihwa and Banwol industrial complexes, which also showed relatively high Cr(VI) concentrations. These three industrial complexes have a similar distribution of businesses. The complex with the fourth-highest Cr(VI) concentration appeared to be Pohang. This can be attributed to the steel industry, which account for a high percentage of all businesses in the Pohang industrial complex. Although the distribution of businesses at the Onsan industrial complex is similar to that in Ulsan, the lower levels of Cr(VI) at Onsan can be attributed to the considerably smaller number of its tenant companies.
The other four complexes, Gumi, Yeosu, Gwangyang, and Daesan showed relatively low levels of Cr (VI). The factor of common to these four complexes is a very simple distribution of businesses. The Gumi industrial complex was developed mainly for the electronics and electric industries, and is known as a Mecca of the electronics industry in Korea. The Gwangyang industrial complex was developed mainly for the machinery, steel and non-metal industries. The Yeosu and Daesan industrial complexes, which showed the lowest Cr(VI) levels are comprised predominantly of petrochemical companies.
3. 2 Seasonal Variations in Cr(VI) Levels
The nine industrial complexes included in this study can be placed in six different local areas (Fig. 1) that are widely distributed from North to South and West to East on the Korean peninsula. It is therefore of a matter of interest whether there is any distinct pattern in the seasonal variation of Cr(VI) concentration in the ambient air of any specific region of Korea. Fig. 5 shows the seasonal variations in average concentrations of Cr(VI) at industrial sites in the six different regions. The Cr(VI) level was high in the winter in the Sihwa- Banwol region and high in the spring and the fall at Ulsan-Onsan. Cr(VI) levels gradually increased from the spring to the winter in Pohang. No seasonal change was observed in other areas such as Gumi, Yeosu-Gwangyang, and Daesan.
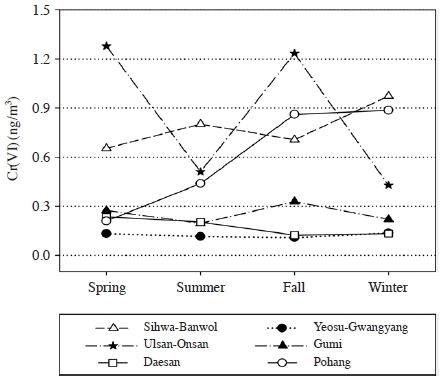
Seasonal variation of Cr(Ⅵ) concentrations at industrial complexes located in different parts of Korea.
Overall, it can be concluded that the ambient air concentration of Cr(VI) in industrial complexes in Korea has no specific seasonal pattern. Therefore, unlike other air pollutants associated with the burning of fossil fuels, Cr(VI) in ambient air is believed to be emitted primarily by industries, which operate constantly throughout the year in industrial complexes. Seasonal variation appears to have an insignificant effect on Cr (VI) concentrations for this reason. The seasonal variation observed in some areas can be attributed either to adverse weather conditions during the monitoring periods or to irregular local emissions.
3. 3 Comparison of Cr(VI) Levels in Korea with Those in Other Countries
Although Cr(VI) is known to be a highly toxic pollutant (Barceloux, 1999), there is little available information about its concentrations in the ambient air to which the general public is routinely exposed. This is largely because the determination of Cr(VI) concentrations requires a specific measurement method unnecessary for other heavy metals. Consequently, no research papers or project reports regarding human health risks due to Cr(VI) available until recently in Korea. Table 6 compares the Cr(VI) levels in Korea with those in different areas of other countries.
The Cr(VI) concentrations ranged from 0.09-1.40 ng/m3 in the industrial complexes in Korea, while those in residential areas near the industrial complexes ranged from 0.10-0.21 ng/m3. According to the literature, the highest levels worldwide were 5.4-8.2 ng/m3 in an industrial area close to steel mills in Isfahan, Iran (Talebi, 2003). Richter et al. (2007) reported a Cr(VI) concentration of 5.0 ng/m3 in Santiago, Chile, which is also considerably higher than the concentrations in Korea.
Except in these two cases, the Cr(VI) levels found in previous studies were mostly low. According to Bell and Hipfner (1997), the mean Cr(VI) level in industrial areas in Hamilton, where a number of steel manufacturing companies are located, was 0.55 ng/m3. Li et al. (2002) reported that the Cr(VI) levels in Sydney, Australia were 0.14 in a residential area and 0.2-1.3 ng/m3 in an industrial area. SCAQMD (2000) reported that the Cr(VI) levels ranged from 0.15-0.60 ng/m3 in ten urban sites on the South Coast of California, while a Cr(VI) level of 0.5 ng/m3 was measured in Wilmington, USA (Khlystov and Ma, 2006).
In European countries, the Cr(VI) level in Regensburg, Germany was reported to be 1.0 ng/m3 (Nusko and Heumann, 1997). Recently, Tirez et al. (2011) reported that the Cr(VI) concentration was 0.9 ng/m3 in an area close to steel mills in Flemish, Belgium. According to the literature, the ambient levels of Cr(VI) in Korean industrial complexes and neighboring residential areas are comparable with those measured in the USA, Canada, Australia, and some European countries.
3. 4 Percentage of Cr(VI) in Total Cr
The percentage of total Cr (T-Cr) comprising Cr(VI) is a matter of interest because many previous studies have reported total Cr concentrations instead of Cr(VI) concentrations. If the percentage of Cr(IV) in T-Cr is consistent, it could be very useful in estimating the Cr(VI) levels based on the T-Cr data. Table 7 lists the Cr(VI)/T-Cr percentages according to season for various industrial areas from this study. The annual average Cr(VI)/T-Cr percentage ranged from 0.7-9.4%. Compared to the 3-8% in urban areas abroad (Khlystove and Ma, 2006; Nusko and Heumann, 1997), the Cr(VI)/T-Cr ratios in Korea are generally low, below 3% in most domestic regions. The Gumi and Daesan industrial complexes showed high Cr(VI)/T-Cr percentages at more than 4%. This result is believed to be due to relatively low levels of total atmospheric chromium at Gumi and Daesan, which are dominated by electronics and petroleum-refining industries, respectively. According to the seasonal variation of in Cr(VI)/T-Cr percentages, the percentage was highest during spring in Ulsan and Pohang, during summer in Sihwa and Daesan, and during winter in other areas. These results indicate that there is no specific seasonal variation in the Cr(VI)/T-Cr percentage. However, as the field studies were carried out in different years in different industrial complexes, the data from this study lacks simultaneity. It is therefore hard to conclude whether or not there is any particular seasonal pattern.
4. Conclusion
The mean ambient levels of Cr(VI) ranged from 0.09-1.40 ng/m3 and were highest in the Ulsan, Banwol, Sihwa, and Pohang industrial complexes, in that order. Regarding the relationship between Cr(VI) level and industry type, the machinery, transportation equipment and steel industries accounted for large portions of all businesses in the industrial complexes with higher levels of Cr(VI). Cr(VI) concentrations were relatively low at the Yeosu and Daesan industrial complexes, where a large portion of the businesses were in the petroleum refining industry. The ambient levels of Cr (VI) in Korean industrial complexes and neighboring residential areas were comparable to those measured in the USA, Canada, Australia, and some European countries, and much lower than those measured in industrial areas in Chile and Iran. Unlike other air pollutants, Cr(VI) showed no distinct seasonal variation in concentration, which can be attributed to the fact that the businesses run constantly throughout the year. The percentage of Cr(VI) accounted for 0.7-9.4% of the total chromium, which is lower than the Cr(VI) figures generally reported for urban areas in other countries. A high ratio of Cr(VI) to total Cr was observed in areas where non-metallic industry was common and concentrations of total chromium were relatively low.
Acknowledgments
This study was conducted as a part of projects “Monitoring of Hazardous Air Pollutants in National Industrial Complexes in Korea, 2007 to 2013”, which were financially supported by National Institute of Environmental Research in Korea.
REFERENCES
- Barceloux, D.G., (1999), Chromium, Journal of Toxicology-clinical Toxicology, 37, p173-194.
-
Bell, R.W., Hipfner, J.C., (1997), Airborne hexavalent chromium in southwestern Ontario, Journal of Air and Waste Management Association, 47, p905-910.
[https://doi.org/10.1080/10473289.1997.10464454]

- California EPA, (2002), Standard operating procedure for the analysis of hexavalent chromium in ambient atmospheric levels by ion chromatography, SOP MLD039 p8.
- Cohen, M.D., Costa, M., (2006), Chromium, Environmental Toxicants: Human Exposures and Their Health Effects, 2nd Ed, Lippman, M ) (edited by, John Wiley and Sons, NJ, p173-191.
-
Cohen, M.D., Kargacin, B., Klein, C.B., Costa, M., (1993), Mechanisms of chromium carcinogenicity and toxicity, Critical Reviews in Toxicology, 23, p255-281.
[https://doi.org/10.3109/10408449309105012]

-
Kang, B.W., Han, J.S., Lee, M.D., Lee, H.S., Kim, J.H., Son, E.S., Baek, S.O., (2009), Concentration characteristics of airborne hexavalent chromium in the industrial area, Journal of Korean Soiciety for Atmospheric Environment, 25(3), p179-187, (in Korean with English abstract).
[https://doi.org/10.5572/kosae.2009.25.3.179]

-
Khlystov, A., Ma, Y., (2006), An on-line instrument for mobile measurements of the spatial variability of hexavalent and trivalent chromium in urban air, Atmospheric Environment, 40, p8088-8093.
[https://doi.org/10.1016/j.atmosenv.2006.09.030]

-
Kimbrough, D.E., Cohen, Y., Winer, A.M., Creeman, L., Mabuni, C., (1999), A critical assessment of chromium in the environment, Critical Reviews in Environmental Science and Technology, 29, p1-46.
[https://doi.org/10.1080/10643389991259164]

- Kotas, J., Stasicka, Z., (2000), Chromium occurrence in the environment and methods of its speciation, Environmental Pollution, 107, p263-283.
-
Li, Y., Pradhan, N.K., Foley, R., Low, G.K.C., (2002), Selective determination of airborne hexavalent chromium using inductively coupled plasma mass spectrometry, Talanta, 57, p1143-1153.
[https://doi.org/10.1016/s0039-9140(02)00196-0]

- Lin, L., Fan, Z., Lioy, P.J., (2008), The distribution of chromium species as a function of particle size for chromium waste laden soils, in Final Technical Report to New Jersey Dept. of Environmental Protection, p46.
- Nusko, R., Heumnann, K.G., (1997), Cr(Ⅲ)/Cr(Ⅵ) speciation in aerosol particles by extractive separation and thermal ionization isotope dilution mass spectrometry, Fresenius, Journal of Analytical Chemistry, 357, p1050-1055.
-
Richter, P., Grino, P., Ahumada, I., Giordano, A., (2007), Total element concentration and chemical fractionation in airborne particulate matter from Santiago, Chile, Atmospheric Environment, 41, p6729-6738.
[https://doi.org/10.1016/j.atmosenv.2007.04.053]

- SCAQMD, (2000), Multiple air toxics exposure study in the South Coast Air Basin (II), South Coast Air Quality Management District.
-
Seigneur, C.H., Constantinou, E., (1995), Chemical kinetics mechanism for atmospheric chromium, Environmental Science and Technology, 29, p222-231.
[https://doi.org/10.1021/es00001a029]

- Seinfeld, J.H., Pandis, S.N., (2006), Atmospheric chemistry and physics-From air pollution to climate change, John Wiley & Sons, ISBN 978-0-471-72018-8, 66.
-
Singh, J., Pritchard, D.E., Carlisle, D.L., Mclean, J.A., Montaser, A., Orenstein, J.M., Patierno, S.R., (1999), Internalization of carcinogenic lead chromate particles by cultured normal human lung epithelial cells: formation of intracellular lead-inclusion bodies and induction of apoptosis, Toxicology and Applied Parmacology, 161, p240-248.
[https://doi.org/10.1006/taap.1999.8816]

-
Talebi, S.M., (2003), Determination of total and hexavalent chromium concentrations in the atmosphere of the city of Isfahan, Environmental Research, 92, p54-56.
[https://doi.org/10.1016/s0013-9351(02)00036-1]

- Tirez, K., Silversmit, G., Bleux, N., Adriaensens, E., Roekens, E., Servaes, K., Vanhoof, C., Vincze, L., Berghmans, P., (2011), Determination of hexavalent chromium in ambient air: A story of method induced Cr(Ⅲ) oxidation, Atmospheric Environment, 45, p5332-5341.
- USEPA, (1984), Health effects assessment for hexavalent chromium, USEPA, Washington, DC.
- USEPA, (1990), Definition and procedure for the determination of the method detection limit, Code of Fedral Regulations, Part 136, Appendix B p537.
- USEPA, (1999), Compendium method IO-3.4: determination of metals in ambient particulate matter using inductively coupled plasma (ICP) spectroscopy, EPA/625/R-96/010a.
