The Size-Oriented Particulate Mass Ratios and Their Characteristics on the Seoul Metropolitan Subway Lines
Abstract
The purpose of the study was to initially investigate the concentration patterns of PM1, PM2.5 and PM10 in the Seoul subway lines, and then to figure out the PM behaviors of internal and external sources inside subway tunnels. The PMs were monitored by a light scattering real-time monitor during winter (Jan. 8-26 in 2015) and summer (July 2-Aug. 7 in 2015) in tunnel air, in passenger cabin air, and in the ambient air. The daily average PM10, PM2.5, and PM1 concentrations on these object lines were 101.3±38.4, 81.5±30.2, and 59.7±19.9 μg/m3, respectively. On an average, the PM concentration was about 1.2 times higher in winter than in summer and about 1.5 times higher in underground tunnel sections than in ground sections. In this study, we also calculated extensively the average PM mass ratios for PM2.5/PM10, PM1/PM10, and PM1/PM2.5; for example, the range of PM2.5/PM10 ratio in tunnel air was 0.82-0.86 in underground tunnel air, while that was 0.48-0.68 in outdoor ground air. The ratio was much higher in tunnel air than in outdoor air and was always higher in summer than in winter in case of outdoor air. It seemed from the results that the in/out air quality as well as a proper amount of subway ventilation must be significant influence factors in terms of fine PM management and control for the tunnel air quality improvement.
Keywords:
Particulate matter, Subway tunnel, PM mass ratio, IAQ1. INTRODUCTION
In present, the Seoul City in the Republic of Korea is undergoing traffic congestion problems caused by rapid urbanization and population growth. Thus the city government has reorganized the mass transportation systems since 2004 and the subway has become one of important means for public transit. The subway takes up to 39% share of total passenger transportation services and it is the biggest part of service systems in Seoul (Seoul Metropolitan Government, 2015). The first line of the Seoul Metropolitan Subway Network (SMSN) has been operated from the Seoul Station to the Cheongnyangni Station since 1974. Up to the present time, the SMSN consists of 9 lines, which are owned by four independent companies. By 2016, the total track length of the 9 lines is 331.6 km and the lines consist of 283 underground and 24 ground stations.
Since subway system is typically a closed environment, the indoor air quality issues have often raised by the general public. Although the air quality has improved in both a subway platform and a concourse after installing platform screen doors (PSD) (Kim et al., 2012; Lee et al., 2010), the tunnel air quality related with particulate matter (PM) has been contrarily deteriorated by the PSD which hindering air circulation in subway tunnels (Lee et al., 2015; Son et al., 2013). Especially since a huge amount of PM is emitted from tunnels due to train operations and subway services, it is necessary to examine the characteristics and behaviors of fine PM in tunnel air in order to protect passenger health. Many other studies had also investigated in various subways on PM concentrations and their sizeoriented mass ratios such as in Shanghai (Qiao et al., 2015a), in Taipei (Cheng et al., 2008), in Guangzhou (Chan et al., 2002a), in Hong Kong (Chan et al., 2002b), and in Los Angeles (Kam et al., 2011), and so on.
In this study, PM1, PM2.5, and PM10 concentrations were initially measured to investigate the physical characteristics of PM on the Seoul subway Line-1 to Line-9 during winter and summer periods. To figure out the PM behaviors of internal and external sources inside tunnels, we investigated size-oriented PM mass ratios extensively in tunnel air, in passenger cabin air, and in the ambient air.
2. RESEARCH METHODS
To investigate the temporal and spatial patterns of airborne PM, we monitored the concentrations of PM1, PM2.5, and PM10 in all the Seoul subway lines. Details of object subway lines are described in Table 1 including operational extension distance, number of stations operated, number of passengers carried, and train operation frequency. In the table, the numerical order of line numbers matches with the operation age of subway lines; for example, the first subway Line-1 has been operated in 1974 and the Line-9 in 2009 and further the lines are clearly distinguished by color symbols as shown in Fig. 1(a). The subway trains run either underground tunnel sections or ground sections, where a section means a railroad interval between two near stations on each subway line. Thus the total number of sections is smaller or larger than the number of stations in a subway line depending on the railroad facility circumstances of departure and arrival stations. The map in Fig. 1(b) shows ground and underground sections in Seoul and also shows that the Line-2, 3, 4, and 7 have only above-ground sections.
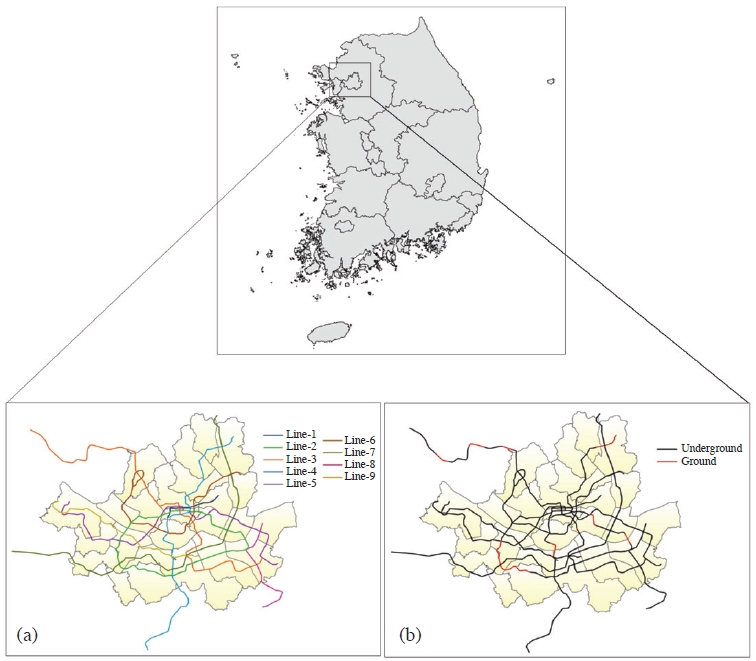
Seoul subway maps for the Line-1 to Line-9; (a) color symbolized lines and (b) ground and underground sections on each line.
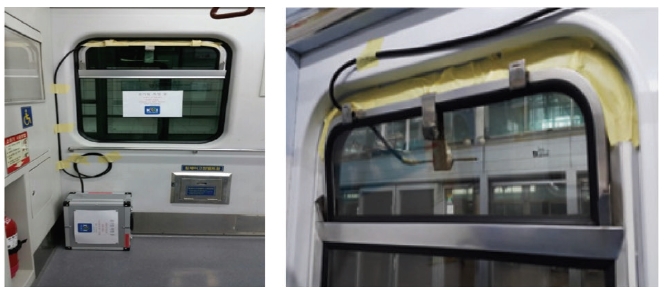
We measured PM concentrations using a light scattering real-time method during winter (Jan. 8-26, 2015) and summer (July 2-Aug. 7, 2015) periods. Unfortunately the measured raw data from the Line-1, 4, 5, 7 in winter as well as the Line-7 in summer were deleted in this study due to unexpected measurement errors on the basis of QA/QC. The concentration patterns on all the subway lines were statistically investigated after simultaneously measuring PM1, PM2.5, and PM10 by the Grimm Dust Monitor 1.108. The particles in the monitor air are detected by a light scattering technique in a measuring cell of the monitor. The scattered laser pulse for each single particle is counted and then the intensity of its scattered signal is classified into a specific particle size-range, one of 15 size channels, after amplification subject to its intensity (Grimm Aerosol Technik, 2010). The monitor can quickly measure PM concentration with the flow rate of 1.2 L/min and allows direct mass or number concentration measurements in near real-time (Colls and Micallef, 1999). Details of the monitor are described in Table 2. For our PM monitoring, the ground and underground air was led directly into measuring cell of the monitor via our custom-designed stainless steel air inlet, which was fixed on outside window glass in a train cabin as shown in Fig. 2. The sampling inlet was connected to the measuring cell with a conductive silicone tube. The PM signals were monitored every 6 second after train service and train departure and arrival times were recorded as well.
In addition to measuring the PM on the underground and ground sections during the sampling periods, we also obtained ambient PM2.5 and PM10 hourly raw-data from 27 monitoring sites in Seoul, which were operated by the Korean Ministry of Environment (MOE), in order to compare PM behaviors in tunnel air, in passenger cabin air, and in outdoor air.
3. RESULTS AND DISCUSSION
3.1 Characteristics of PM10, PM2.5 and PM1 Concentrations on Seoul Subway Lines
As results of PM measurement in Seoul subway lines, which are mostly consisted of underground tunnels, the daily average PM10, PM2.5, and PM1 concentrations for the entire sections were 101.3±38.4, 81.5±30.2, and 59.7±19.9 μg/m3, respectively. As shown in Table 3, the daily average PM10, PM2.5 and PM1 concentrations in winter were 106.7±40.1, 86.6±32.6, 64.2±20.9 μg/m3, respectively; however, in summer were 98.0±37.4, 78.4±28.7, 56.9±19.2 μg/m3, respectively. The PM levels in winter were about 1.2 times higher than those in summer. Especially during the summer period, the highest average concentrations of PM10 and PM2.5 were observed respectively by 136.0 μg/m3 and 101.7 μg/m3 in the Line-1 and further that of PM1 was 77.9 μg/m3 in the Line-9. When comparing among subway lines, the seasonal pattern showed that the behavior of Line-2 was quite different from other lines. In other words, the range of average concentration was widest between two seasons since very low levels were observed in summer, but very high levels in winter. Generally in the ambient air, the PM concentration in Korea is highest during the winter heating season, but lowest during the summer rainy season. Thus the subway Line-2 might be easily influenced by the ambient air when comparing other lines since the Line-2 has 11 above-ground sections out of total 44 sections as shown in Table 1. On the other hands, seasonal differences in terms of PM levels were very small since other lines have a few or none ground sections.

Average concentrations of PM10, PM2.5, and PM1 in Seoul subway tunnels each lines during sampling periods.
The Korean MOE has established the PM10 indoor air quality (IAQ) standard of 150 μg/m3 for subway platform, concourse, and passage way, while the standard for tunnel air does not exist yet (Ministry of Environment, 2014). According to the IAQ recommendation for urban transit units, PM10 concentration in train cabins should not be exceeded 200μg/m3. Furthermore, the Korean ambient air quality standards (AAQS) of 24-hr basis PM10 and PM2.5 were set by 100 μg/m3 and 50 μg/m3, respectively.
Fig. 3 showed seasonal cumulative distributions of PM concentrations monitored on the Line-2, 3, 6, 8 and 9. The distributions were obtained by integrating total concentration range with respect to the frequency distribution of the PM concentration in a certain section. The cumulative distribution analysis was performed using an Excel program. The respective median concentrations of PM10 on the Line-2, 3, 6, 8 and 9 were 122.6, 76.7, 91.1, 89.6, and 109.7 μg/m3 in winter [see Fig. 3(a)] and 66.2, 76.3, 72.6, 82.5, and 110.0 μg/m3 in summer [see Fig. 3(b)]. In addition, the respective median concentrations of PM2.5 on the Line-2, 3, 6, 8 and 9 were 99.1, 58.3, 78.4, 85.2, and 87.8 μg/m3 in winter [see Fig. 3(c)] and 57.6, 61.1, 61.3, 73.9, and 97.0 μg/m3 in summer [see Fig. 3(d)].
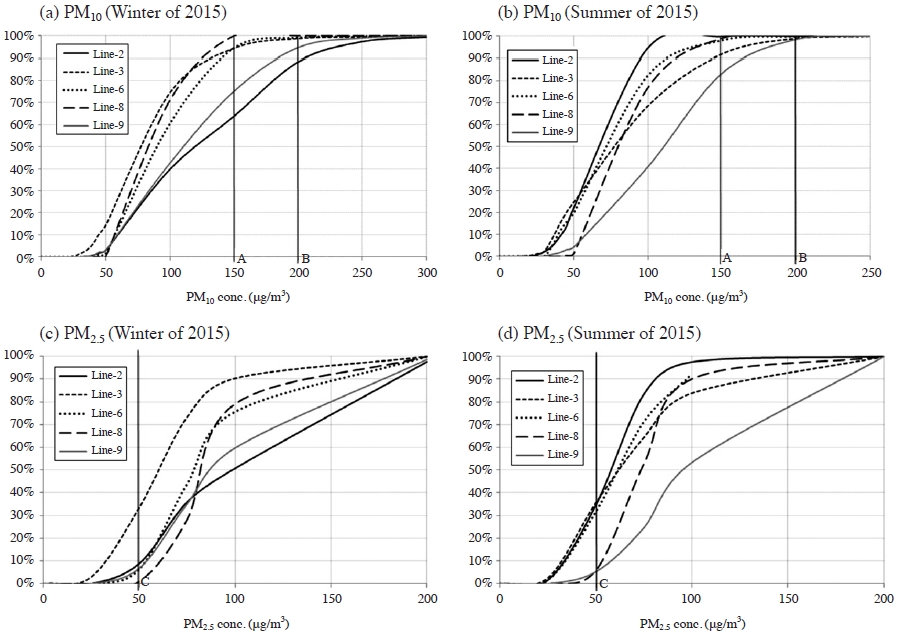
Seasonal cumulative distributions of PM2.5 and PM10 concentrations monitored on the selected subway lines in tunnels, where the solid line A in figure boxes indicates the Korean IAQ standard of PM10 (150 μg/m3), the solid line B as the urban transit units’ recommendation of PM10 (200 μg/m3), and the solid line C as the Korean AAQS of PM2.5 (50 μg/m3 for 24-hr basis).
The PM10 distribution in Fig. 3(a) and (b) showed that 36% of Line-2 did not meet the IAQ standard of 150 μg/m3 in winter, while 30% of Line-6 did not meet the standard in summer. In addition, the PM2.5 distributions in Fig. 3(c) and (d) showed that 99% of Line-8 did not meet the Korean AAQS of 50 μg/m3 in winter, while 95% of Line-2 as well as Line-8 did not meet the standard in summer.
3. 2 PM mass ratios on the Seoul Subway Lines
Particle size as one of physical parameters is important to determine the properties, effects, and fate of airborne particles. Also aerosol deposition rate as well as residence time directly affecting human health and wealth are strongly related with aerodynamic diameter (EPA, 1999). To examine the aerosol behaviors and its possible sources in the subway environment, we initially calculated the size-oriented PM mass ratios. Table 4 shows the average PM mass ratios for PM2.5/PM10, PM1/PM10, and PM1/PM2.5 which were monitored on all the ground and underground sections on the selected Seoul subway lines.

A statistics of average mass ratios for PM2.5/PM10, PM1/PM10, and PM1/PM2.5 in the Seoul subway tunnels.
When comparing results among subway sections, the average mass ratio of PM2.5/PM10 was calculated by 0.78 on ground and 0.82 on underground sections in winter and that was also calculated by 0.84 on ground and 0.86 on underground sections in summer. The range of mass ratios for PM2.5/PM10 was 0.67-0.78 in Taipei subway stations (Cheng et al., 2008), 0.79 in Guangzhou (Chan et al., 2002a), 0.72-0.78 in Hong Kong subway stations (Chan et al., 2002b) and 0.76 on the ground stations and 0.73 on underground stations in Los Angeles (Kam et al., 2011). Further the respective mass ratios of PM1/PM10 and PM2.5/PM10 were 0.49-1.00 and 0.56-1.00 in a Shanghai subway tunnel (Qiao et al., 2015a). The result of LA was relatively close to our results obtained on the Line-4 during summer survey. It might be natural that the mass ratios of PM1/PM10 and/or PM2.5/PM10 were observed to be somewhat different in every subway environment due to various control facilities, power and brake systems, ventilation systems, and operation conditions. Above all things, the in/out air quality near each station should be a significant influence factor on the PM mass ratios.
There are many internal and external PM sources worsen the subway air quality. Internal PM is mainly produced from mechanical wear during the period of trains running or braking, maintenance activities as well as construction works in tunnels, etc. (Kim et al., 2008). It is also noted that most of the internal PM is considered as coarse particles. According to a research paper (Qiao et al., 2015a), the mass ratios of PM1/PM10 and PM2.5/PM10 were higher when subway trains went out of service since the emission activities generating coarse particles were completely ceased. On the other hands, external PM is penetrated from various outdoor sources like traffic emissions surrounding the subway (Qiao et al., 2015b), where the PM penetration into the subway is significantly assisted by mechanical and natural type ventilations. It seems that the amount of ventilation presumably affects the PM mass ratios on the Seoul subway lines. During our study period, the amount of subway ventilation was usually decreased to keep warm air temperature from inflowing cold ground air during winter time; however, that was increased to reduce hot air temperature and to enhance air quality by inflowing fresh outdoor air during the summer time. Thus it seems that internal emissions tend to be accumulated in subway tunnels during winter, while external emissions tend to easily flow into the tunnels during the other seasons.
In our study, it was observed that the fine proportions (i.e. the mass ratios of PM1/PM10 and PM2.5/PM10) were generally higher in summer than those in winter and also each fine proportion was elevated on ground sections in summer as well as on underground sections in winter. For example, the respective PM1/PM10 ratios on underground and ground sections were 0.61 and 0.62 in winter and 0.67 and 0.70 in summer. It is presumably because the fine secondary aerosols, mostly PM1, are generated by photochemical reaction during summer. It is also worth noting in this study that the PM1/PM2.5 ratio was always higher on ground sections; however, the PM2.5/PM10 ratio was always higher on underground sections. It is partly because a proportion of fine particles including PM1 and PM2.5 was increased on ground sections due to various anthropogenic emissions such as on-road mobile source, fossil fuel combustion source, secondary aerosol source, and so on. In an earlier study, the mass ratio of PM2.5/PM10 for on-road vehicles was almost 1 (Jin et al., 2012).
It is necessary to figure out the behaviors of internal and external emission sources in order to improve subway air quality. According to a result from PMF (positive matrix factorization) receptor modeling study in Seoul subway tunnels, a total of 3 sources was identified and then average contribution to PM10 mass was determined by 56.9% from brake wear-related source, 13.8% from iron-related source, and 17.9% from secondary aerosol sources (Park, 2013). Since a mass proportion of fine particle is considered to be significant in subway tunnels, it is needed to extend receptor modeling study to determine quantitative contribution to each PM1 and PM2.5 mass from various emission sources.
3. 3 PM Size Distribution in Subway Tunnels and Outdoor
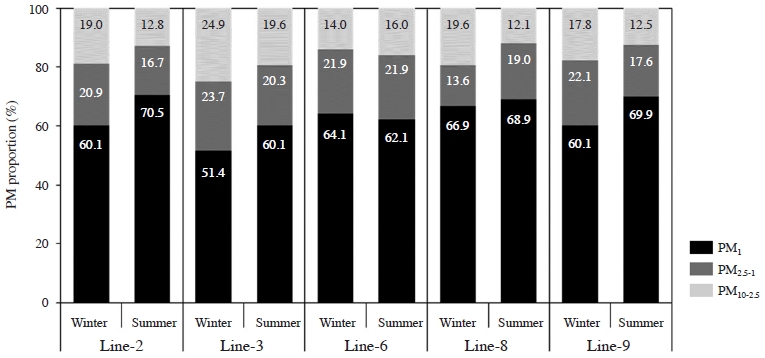
Fig. 4 shows mass concentrations of PM1, PM2.5, and PM10 measured on the subway Line-2, 3, 6, 8, and 9 during the study periods. On the basis of PM10 mass concentration, the sum of fine mass proportions including PM1 and PM2.5 occupied a minimum of 0.75 in winter on the Line-3 and a maximum of 0.88 in summer on the Line-8, while the range of PM1 mass proportion occupied 0.51-0.71 in PM10.
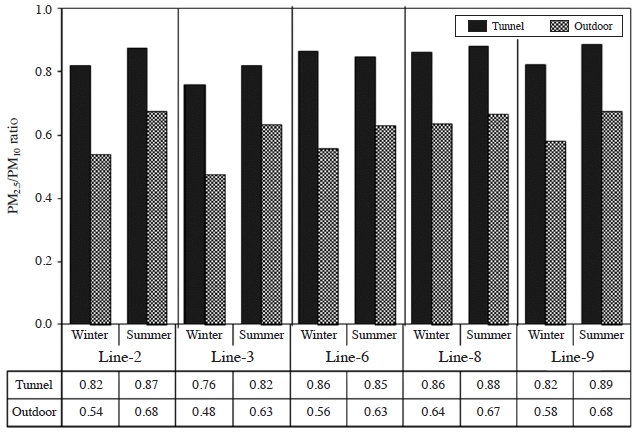
The MOE has been operating automatic monitoring networks to monitor criteria air pollutants including PM2.5 and PM10 on 259 monitoring sites nationwide including 27 sites in Seoul City (NIER, 2016). For our study on comparing between subway tunnel air and outdoor air, we obtained ambient PM2.5 as well as PM10 hour-data from the MOE. Initially we had to select each MOE monitoring site locating near the subway lines, and then we synchronized ambient MOE data with our subway data one by one basis. Fig. 5 shows a comparative result studied on both tunnel air and outdoor air for each subway line. The mass ratio range for PM2.5/PM10 in tunnel air was 0.76-0.89, while that in outdoor air was 0.48-0.68. In general, the ratio of PM2.5/PM10 was much higher in tunnel air than that in outdoor air. Especially the ratio of PM2.5/PM10 in outdoor air was always higher in summer than that in winter.
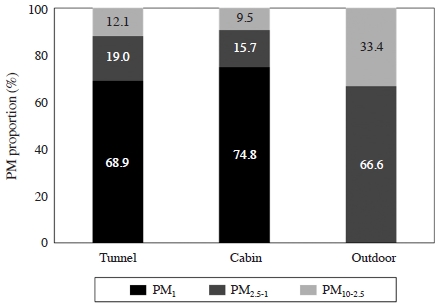
Fig. 6 shows the average proportions of PM1, PM2.5, and PM10 mass observed in tunnel sections, passenger cabins and outdoors on the Line-8. The outdoor PM2.5 and PM10 data were obtained from the MOE as mentioned earlier. The PM2.5/PM10 ratio in cabin air was observed to be slightly higher than that in tunnel, but the ratio was much higher than in outdoor air. It seemed from the result that fine particles generated in tunnels intruded into cabins after PSD installation more significantly than before so that tunnel air directly affected cabin air. Thus it is necessary to improve ventilation systems to block fine particle inflows from tunnels or to enhance tunnel air quality by proper controls.
4. CONCLUSION
In this study, PM1, PM2.5, and PM10 concentrations had been measured by a real-time dust monitor to investigate the physical characteristics of PM on 5 lines among the 9 Seoul subway lines during winter and summer periods. The subway lines were initially separated into ground and underground sections and then size-oriented PM mass ratios were calculated to figure out the behaviors of internal and external particle sources. We calculated extensively PM mass ratios in tunnel air, passenger cabin air, and in the ambient air.
The results showed that the average PM concentration was about 1.2 times higher in winter than in summer and about 1.5 times higher in underground tunnel sections than in ground sections. Since PM concentration in Korea is generally highest during the winter but lowest during the summer in the ambient air, the underground tunnel air might be seasonally influenced by the ambient air. Further, when comparing among subway sections, the average mass ratio of PM2.5/PM10 was calculated by 0.78 on ground and 0.82 on underground sections in winter and that was also calculated by 0.84 on ground and 0.86 on underground sections in summer. Even though the PM mass ratios in subway tunnels were mainly affected by various internal emission activities, the in/out air quality near each station was consider to a significant influence factor on the ratios. In addition, the PM2.5/PM10 ratio in passenger cabin air was almost similar to tunnel air, but much higher in outdoor air. It seemed that fine particles in tunnels intruded more into cabins after PSD installation. Thus a proper amount of ventilation in each subway station should be a key factor to control the subway air quality. To improve ventilation systems or to enhance tunnel air quality by proper controls, it is necessary to preferentially consider extended receptor modeling studies to determine quantitative contribution to each PM1 and PM2.5 mass emitted from various sources since the fine PM proportions are huge in subway environment.
Acknowledgments
This research was supported by a grant from the Railway Technology Research Project of the Ministry of Land Infrastructure and Transport (16RTRP-B0822486-03).
REFERENCES
-
Chan, C.Y., Chan, L.Y., Lau, W.L., Lee, S.C., (2002b), Commuter Exposure to Particulate Matter in Public Transportation Modes in Hong Kong, Atmospheric Environment, 36(21), p3363-3373.
[https://doi.org/10.1016/s1352-2310(02)00318-7]

-
Chan, L.Y., Lau, W.L., Zou, S.C., Cao, Z.X., Lai, S.C., (2002a), Exposure Level of Carbon Monoxide and Respirable Suspended Particulate in Public Transportation Modes While Commuting in Urban Area of Guangzhou, China, Atmospheric Environment, 36(38), p5831-5840.
[https://doi.org/10.1016/s1352-2310(02)00687-8]

-
Cheng, Y.H., Lin, Y.L., Liu, C.C., (2008), Levels of PM10 and PM2.5 in Taipei Rapid Transit System, Atmospheric Environment, 42(31), p7242-7249.
[https://doi.org/10.1016/j.atmosenv.2008.07.011]

-
Colls, J.J., Micallef, A., (1999), Measured and Modelled Concentrations and Vertical Profiles of Airborne Particulate Matter within the Boundary Layer of a Street Canyon, Science of the Total Environment, 235(1), p221-233.
[https://doi.org/10.1016/s0048-9697(99)00194-1]

- EPA, (1999), Air Quality Criteria for Particulate Matter, Vol. 1, EPA600/P-99/002a.
- Grimm Aerosol Technik, (2010), Aerosol Spectrometer and Dust Monitor series 1.108 and 1.109, http://www.wmo-gaw-wcc-aerosol-physics.org/files/OPC-Grimmmodel--1.108-and-1.109.pdf.
-
Jin, H.A., Lee, J.H., Lee, K.M., Lee, H.K., Kim, B.E., Lee, D.W., Hong, Y.D., (2012), The Estimation of PM2.5 Emissions and Their Contribution Analysis by Source Categories in Korea, Journal of Korean Society for Atmospheric Environment, 28(2), p211-221.
[https://doi.org/10.5572/kosae.2012.28.2.211]

-
Kam, W., Cheung, K., Daher, N., Sioutas, C., (2011), Particulate Matter (PM) Concentrations in Underground and Ground-Level Rail Systems of the Los Angeles Metro, Atmospheric Environment, 45(8), p1506-1516.
[https://doi.org/10.1016/j.atmosenv.2010.12.049]

-
Kim, K.H., Kim, J.C., Ho, D.X., Jeon, J.S., (2012), a Noticeable Shift in Particulate Matter Levels after Platform Screen-Door Installation in a Korean Subway Station, Atmospheric Environment, 49, p219-223.
[https://doi.org/10.1016/j.atmosenv.2011.11.058]

-
Kim, Y.S., Kim, C.N., Kim, K.Y., Roh, Y.M., Lee, C.M., (2008), Spatial Distribution of Particulate Matter (PM10 and PM2.5) in Seoul Metropolitan Subway Stations, Journal of Hazardous Materials, 154(1), p440-443.
[https://doi.org/10.1016/j.jhazmat.2007.10.042]

-
Lee, T.J., Jeon, J.S., Kim, S.D., Kim, D.S., (2010), A Comparative Study on PM10 Source Contributions in a Seoul Metropolitan Subway Station before/after Installing Platform Screen Doors, Journal of Korean Society for Atmospheric Environment, 26(5), p543-553.
[https://doi.org/10.5572/kosae.2010.26.5.543]

- Lee, T.J., Lim, H.J., Kim, S.D., Park, D.S., Kim, D.S., (2015), Concentration and Properties of Particulate Matter (PM10 and PM2.5) in the Seoul Metropolitan, Journal of Korean Society for Atmospheric Environment, 31(2), p164-172.
- Ministry of Environment, (2014), http://www.me.go.kr.
- NIER, (2016), National Institute of Environmental Research, Annual Report of Air Quality in Korea 2015.
- Park, S.B.S.N., (2013), Chemical Characteristics of PM10 and Identification of its Sources in a Seoul Metropolitan Subway Station, Kyung Hee University Master Thesis.
- Qiao, T., Xiu, G., Zheng, Y., Yang, J., Wang, L., (2015b), Characterization of PM and Microclimate in a Shanghai Subway Tunnel, China, Procedia Engineering, 102, p1226-1232.
- Qiao, T., Xiu, G., Zheng, Y., Yang, J., Wang, L., Yang, J., Huang, Z., (2015a), Preliminary Investigation of PM1, PM2.5, PM10 and its Metal Elemental Composition in Tunnels at a Subway Station in Shanghai, China, Transportation Research Part D, 41, p136-146.
- Seoul Metropolitan Government, (2015), Transportation allotment rate, http://traffic.seoul.go.kr/archives/289.
- Seoul Metropolitan Government, (2016), Subway statistics, http://traffic.seoul.go.kr/archives/296.
-
Son, Y.S., Salama, A., Jeong, H.S., Kim, S.H., Jeong, J.H., Lee, J.H., Sunwoo, Y., Kim, J.C., (2013), The Effect of Platform Screen Doors on PM10 Levels in a Subway Station and a Trial to Reduce PM10 in Tunnels, Asian Journal of Atmospheric Environment, 7(1), p38-47.
[https://doi.org/10.5572/ajae.2013.7.1.038]

