Study the Impact of Engineering Ventilation on Indoor Air Quality in Hospitals during COVID-19
Copyright © 2021 by Asian Association for Atmospheric Environment
This is an open-access article distributed under the terms of the Creative Commons Attribution Non-Commercial License (http://creativecommons.org/licenses/by-nc/4.0/), which permits unrestricted non-commercial use, distribution, and reproduction in any medium, provided the original work is properly cited.
Abstract
This study investigates the importance of using engineering ventilation in healthcare settings, especially during widespread disease outbreaks such as COVID-19. Ventilation can be used to improve indoor air quality in care homes, hospitals, and quarantine locations. In the research, two scenarios of engineering ventilation are simulated using a Fire Dynamic Simulator (FDS), with sulfur hexafluoride employed as the contaminant emitted by the patient in the hospital room. The volume of the room selected for the present study is 60 m3, and the ventilation mode is designed according to the American Society of Heating, Refrigerating and Air-Conditioning Engineers (ASHRAE), with 12 air changes per hour and negative pressure. The mean concentration of the pollutants is estimated for both scenarios, giving concentrations in the range of 920±397 to 1260±580 ppm. The estimated indoor air quality (IAQ) values varied from 2.06 to 2.90. According to the obtained results, ventilation plays a critical role in eliminating pollutants, indicating that suitably engineered ventilation strategies can reduce the impact of COVID-19 spread in closed buildings.
Keywords:
Care facilities, COVID-19, Indoor air quality, Ventilation1. INTRODUCTION
Throughout human history, viruses have inflicted misery and disease on humans (Girard et al., 2010; Ghendon, 1994). Among the most frequently occurring of viruses resulting in widespread disease are coronaviruses, which may cause anything from the common cold to more severe and potentially fatal illnesses such as Severe Acute Respiratory Syndrome (SARS) or Middle East Respiratory Syndrome (MERS) (Badawi and Ryoo, 2016; Chan et al., 2015). At the end of 2019, a new (novel) coronavirus, SARS-CoV-2, appeared in the city of Wuhan, China. The illness caused by this virus was officially labelled “COVID-19” by the World Health Organization (WHO). COVID-19 stands for “Corona Virus Disease 2019” (Stein, 2020). According to the WHO, the majority of people who are infected with SARS-CoV-2 experience either mild or moderate illness that does not require treatment in a healthcare setting (Stein, 2020). However, the virus is more likely to cause severe to fatal illness in the elderly and those with pre-existing medical conditions such as diabetes or chronic respiratory issues (Liu et al., 2020; Badawi and Ryoo, 2016). The virus is passed from person to person in a number of ways, including droplet infection when a person with COVID-19 coughs, sneezes, or speaks (Chinazzi et al., 2020; Goldmann, 2000). These droplets are relatively heavy, do not travel far, and quickly sink to the ground. However, people can catch COVID-19 if they breathe in the infected droplets (Bahl et al., 2020). Another way that SARS-CoV-2 spreads from person to person is via fomites (Pitol and Julian, 2020). When droplets from a person’s cough, sneeze, or “talk spray” land on surfaces near the infected person, other people may catch the disease by touching these surfaces (doorknob, elevator button, handrail, etc.) and then touching their face, particularly their mouth, nose and eyes (Stein, 2020). Virus particles that cause COVID-19 may stay viable on fomites for up to several days, depending on environmental conditions (Stein, 2020). To reduce the impact of COVID-19, most countries around the world have imposed numerous restrictions of movement and socializing on their populations (Chinazzi et al., 2020). Some restrictions are very stiff, such as prohibiting people from going outside for several days (Chinazzi et al., 2020). Most domestic and international borders are also closed (Chinazzi et al., 2020). Even without the threat of contracting COVID-19, governments have been paying more and more attention to air quality over the past few decades, both indoor and outdoor. In the present study, the investigations are focused on indoor air quality (IAQ), as addressing IAQ is key to protecting human health in a closed building. The design and control of ventilation strategies is of great importance to IAQ (Fan et al., 2020; Zhu et al., 2020). In isolation rooms, the layout of the furniture and the strategies applied to the ventilation process can have a profound influence on both pollutant distribution and airflow patterns (Cheong and Phua, 2006). Tung et al. (2009) found that a room’s ventilation efficiency is the greatest at -15.0 Pa/24 h-1, and that this efficiency accordingly decreases when at -15.0 Pa/12 h-1, -8.0 Pa/24 h-1, -5.0 Pa/24 h-1, -2.5 Pa/24 h-1, -8.0 Pa/12 h-1, -5.0 Pa/12 h-1, or -2.5 Pa/12 h-1. The tests were carried out in a hospital room that had ventilation air change rates of 3. h-1, 6. h-1, and 12. h-1, which was accomplished through mixing the air distribution and maintaining a steady temperature steady of 22°C (Zhang et al., 2021; Bolashikov et al., 2012). In a related study, Bolashikov et al. (2012) discovered broad variations in peak concentration levels, ranging between 194 and 10,228 ppm, inclusive. Based on their respective study results, Bolashikov et al. (2012) as well as Zhang et al. (2021) recommended that optimal ventilation rates should be around 10 to 12. h-1. Other research results concerning hospital isolation room ventilation systems noted that the technique of “low-level extraction” was highly effective in decreasing pollutant and contamination levels (Cho, 2019). The research also found that air exchange rate and room dimension were key factors that prevented or mitigated isolation room contamination (Hui et al., 2011). An additional finding in the literature proposes that negative pressure rooms can be optimal at infection control in hospitals or other institutional settings where contaminants may be spread through aerosols or droplets (Ghorui, 2020; Li et al., 2020). Based on recent findings, there is a strong possibility of airborne transmission of SARS-CoV-2 in indoor air environments (Noorimotlagh et al., 2020). However, there is currently widespread debate among researchers and scien-tists about the routes of transmission of the virus, including airborne transmission, especially in indoor environments (Noorimotlagh et al., 2020). In this paper, the potential aerosol transmission of SARS-CoV-2 in the indoor air of hospital wards with confirmed COVID-19 patients was investigated. Isolating or quarantining at home has become the global norm nowadays to protect people from the virus. At the same time, however, there is a lack of information on how the virus spreads and who is susceptible to contracting the virus, which may be leading to poor IAQ (Zakaria Abouleish, 2020). Medical staff are being infected in healthcare buildings, even while wearing personal protective equipment (PPE) (Stewart et al., 2020). Accordingly, the role of engineering ventilation strategies in reducing the spread of the novel coronavirus within enclosed buildings, including hospitals, was investigated, as engineered ventilation may provide the key to mitigating the transmission of diseases inside enclosed structures. To protect public health, the role of engineering ventilation in improving IAQ in hospitals and other healthcare environments to reduce the spread of SARSCoV-2 should be closely considered (Miller et al., 2020). However, to date, only a few studies have investigated how engineering ventilation might lead to COVID-19 reductions (Dai and Zhao, 2020; Morawska et al., 2020). In the present study, a Fire Dynamic Simulator (FDS) is used to simulate air profiles in a selected room, and sulfur hexafluoride (SF6) is employed as the contaminant emitted by the patient in the hospital room. Additionally, the room is under negative pressure to eliminate any dispersion of the contaminant to other areas of the hospital. The engineering ventilation is designed according to the specifications of the American Society of Heating, Refrigerating and Air-Conditioning Engineers (ASHRAE) (Sánchez-Barroso and García Sanz-Calcedo, 2019). The main objective of the present paper is to study the effect of engineering ventilation to improve IAQ in the hospital sector. Improving IAQ in hospitals can be a key to reducing the spread of contaminants in hospitals and thus reducing the impact of COVID-19. To achieve the main objective, the concentration of a pollutant in the room is estimated. The pollutant here is SARS-CoV-2 transported by a bio-aerosol emitted by the patient.
2. MATERIALS AND METHODS
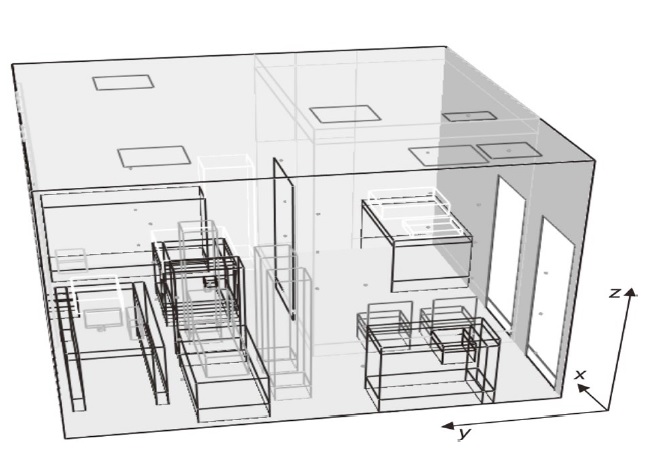
To investigate the indoor air quality in the isolated room (L=4.2 m; W=4.2 m; H=3.4 m), FDS was used to simulate the movement of air and to gauge temperature profiles. FDS is a computational fluid dynamics (CFD) model of fire-driven fluid flow. The Hydrodynamic Model FDS software described in this work numerically solves a form of the Navier-Stokes equations appropriate for lowair velocity thermally driven flow, with an emphasis on smoke and heat transport from fires. The FDS results are visualized in Smokeview. More details are given in the supplemental material. The meshing is summarized in the Table 1. The selected room has an area of 17.64 square meters and a volume of 60 cubic meters (see Fig. 1). The room contains some obstacles, such as the bed of the patient, medical tables, a few chairs, and computer. We also assume that a physician, nurse, and patient are in the room.
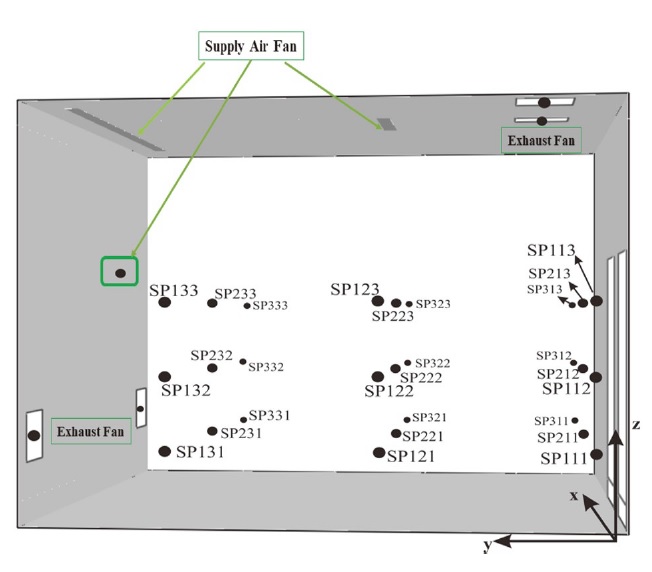
The measurement points are selected in the room as shown in Fig. 2. These measurement points are distributed across three horizontal planes at respective heights of 0.6, 1.2 and 1.8 m. Furthermore, the concentration of SF6 is estimated in each exhaust fan and supply air fan. Two scenarios of simulations are investigated, as reported in Table 2. In the first scenario, the exhaust fans are placed in the ceiling of the room as the supply air fans. In the first scenario, the supply air fan on the left side is set to “ON” (see Fig. 2), while in the second scenario, the supply air on the left side is set to “OFF”. In the second scenario, the exhaust air fans are positioned on the left wall (see Fig. 2), not in the ceiling. The sizes and coordinates of the fans are reported in Table 2. According to ASH RAE norms, the flow rate of the supply air is set at 12 air changes per hour, which corresponds to 0.20 m3/s. The temperature in the room is fixed at 18°C. The room is under negative pressure to avoid the spread of the SARSCoV- 2 virus, in case of COVID-19. The dynamic pressure applied on the door is 1 Pa. The heat flux emitted by each person in the room is estimated to be 80 W/m2. The computer used by the medical staff emits 70 W/m2. The source of contamination (SF6) is modeled by an area of 6 cm2 releasing a mass flow per unit area of 0.17 kg/s/m2 (6 L/min). This flow corresponds to the average air flow emitted by an adult. The mean of the pollutant is estimated by the following equation:
| (1) |
where SPij1 is the sampling point in the plane z=0.6 m. For other points, 1 should be replaced by 2 for z=1.2 m and 1 by 3 for z=1.8 m to estimate SF6 concentrations in these two planes.
To study the effectiveness of each scenario of ventilation, the IAQ was estimated by the following equation:
| (2) |
where Csupply air fan is the concentration of the pollutant in the supply air fan. In this case, it is considered equal zero. There are no sources of contaminant coming from outside and the air is considered clean.
Cexhaust air fan is the concentration of pollutant in the exhaust air fans.
Cmean concentration in the room is the mean concentration of the pollutant in the room.
According to the hypothesis, Equation 3 can be expressed as:
| (3) |
3. RESULTS AND DISCUSSION
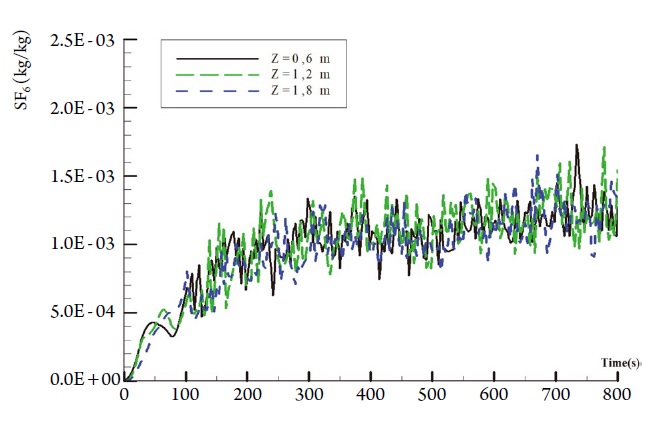
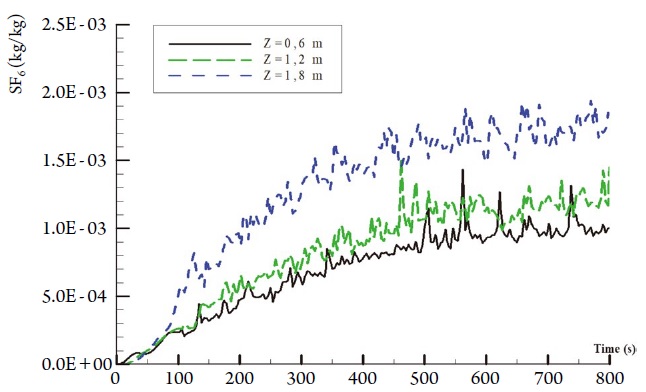
To study the IAQ in the isolated room, FDS was used to simulate the movement of air and temperature profiles. The concentrations of contaminant are estimated numerically and compared with literature. Variations in SF6 concentrations are shown in Figs. 3 and 5 for scenarios 1 and 2. For both ventilation scenarios, the SF6 concentration is stable after 400 s. The concentrations stabilize for the three levels from 400 s, except for the peak at 700 s at a height of 0.60 m. Note that there is not a significant difference in the average concentration of SF6 for the three levels. The mean concentrations, which are estimated in the range time of 600 to 800 s, are reported in Table 3.
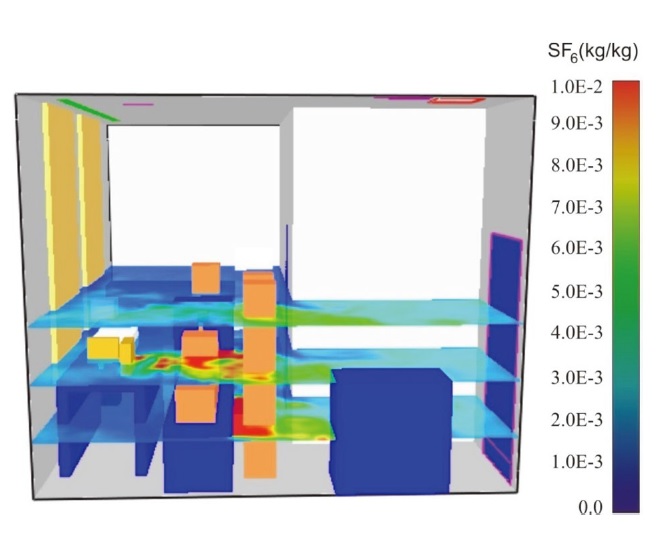
The mean concentrations are in the range of 920±397 to 1260±580 ppm for scenarios 1 and 2, respectively. As can be seen in Table 3, the mean concentration obtained during scenario 2 is greater than that obtained during scenario 1. The distribution of the pollutant in the three planes is shown in Figs. 4 and 6. We choose three levels: (i) z=0.6 m, (ii) z=1.2 m, and (iii) z=1.8 m. For both scenarios 1 and 2, we apply the concentration of SF6 vs time and then observe the differences between the two scenarios, as shown in Figs. 3 and 5. The results obtained during scenario 1 are reported in Fig. 3, while Fig. 5 shows the results for scenario 2. The difference is due to the placement of supply air fans and exhaust air fans and to the supply air in the left wall that is OFF during the second scenario. The average concentration is comparable for the three heights considered, which seems to indicate good mixing conditions in the room. Although the fluctuations in the mass concentration are significant, the mean value of the concentrations is stable from 400 s.
The role of the ventilation installed in the left wall is significant during this study. Note that the addition of two wall exhaust grilles located 50 cm from the floor leads to a deterioration in air quality. High concentration values of the pollutant are observed in the plane z=0.6 m and z=1.2 m. As we considered in this study that an average person (medical staff) measures 1.80 m in height, the first scenario can reduce the impact of the medical staff significantly, as shown in Fig. 4.
In scenario 2, medical staff were shown to be affected. The high values of the pollutant concentration emitted by the patient were on the level of z=1.2 and z=1.8 m, as illustrated in Fig. 6. For the position of the medical staff, we suggest being on the left side (see Fig. 2) of the patient. In fact, a dynamic pressure of 1 Pa that was applied to the door of the room to stop the spread of the contaminants could be applied to other places in healthcare settings during an outbreak.
In order to evaluate the role played by engineering ventilation and its strategies, another index is used in the present study (Eqs. 2 and 3). The ε index will be used to quantify the effectiveness of ventilation to remove pollutants from a room (Table 4). The ventilation scenario is effective for removing pollutants if ε>1. In this case, the scenario represents a good ventilation engineering solution. However, if ε<1, there is an accumulation of contaminants in the room. Hence, the room can be dangerous for medical staff and visitors. Furthermore, the room should be under negative pressure. This could be related to, for example, the existence of recirculation zones where the contaminants accumulate.
According to obtained results based on ventilation scenarios 1 and 2, the ventilation strategies can be considered an excellent tool for reducing the impact of the SARS-CoV2 virus and the COVID-19 illness that it causes. Scenario 1 ventilation gives promising results, as it can reduce the impact of contamination by 28.96% compared to scenario 2 ventilation. This difference can be attributed to the location of the supply air and exhaust air fans in the room. The location of these fans can play a pivotal role in eliminating viruses, bio-aerosols, and contaminants in closed buildings, especially in hospitals. The level of exposure of hospital staff to SF6 is higher in scenario 2. Concentrations in the order of 8×10⁻³ kg of SF6/kg of air are obtained for the two staff members standing to the patient’s left. This value is significantly higher than the results obtained for scenario 1. On the other hand, the staff member located at the back of the patient is no more exposed with this ventilation scenario than in the previous cases (concentration in the order of 2×10⁻³ kg of SF6/kg of air in the inhalation zone).
4. CONCLUSIONS
In the present paper, the role of engineering ventilation in a closed building was investigated. To simulate the indoor quality and virus spread in hospitals, a room with a volume of 60 m3 was selected and two scenarios of ventilation were simulated using FDS, with sulfur hexafluoride serving as the contaminant emitted by the patient. The ventilation mode was designed according to the American Society of Heating, Refrigerating and Air-Conditioning Engineers (ASHRAE). Furthermore, the room was under negative pressure and there were 12 air changes per hour. The mean concentrations of the pollutants were estimated for both scenarios, showing them to be in the range of 920±397 to 1260±580 ppm. Additionally, indoor air quality (IAQ) was estimated, and its value varied from 2.06 to 2.90. According to the obtained results, the applied ventilation strategy played a key role in eliminating pollutants, indicating that ventilation can reduce the impact of COVID-19 spread in a closed building. In the case of a closed room of quarantine that can be considered as an isolated room and it should be under negative pressure, the scenario 1 gave promising results and should be selected as the best engineering solution for reducing the spread of COVID-19 in closed buildings and healthcare settings.
Acknowledgments
The authors of this paper thank the Deanship of scientific research at University of Tabuk - Kingdom of Saudi Arabia and my scientific collaborators. This work was supported by the Deanship of Scientific Research at University of Tabuk [grant number S-0048-1441].
References
-
Badawi, A., Ryoo, S.G. (2016) Prevalence of comorbidities in the Middle East respiratory syndrome coronavirus (MERS-CoV): a systematic review and meta-analysis. International Journal of Infectious Diseases, 49, 129-133.
[https://doi.org/10.1016/j.ijid.2016.06.015]

-
Bahl, P., Doolan, C., de Silva, C., Chughtai, A.A., Bourouiba, L., MacIntyre, C.R. (2020) Airborne or droplet precautions for health workers treating COVID-19? The Journal of Infectious Diseases, jiaa189.
[https://doi.org/10.1093/infdis/jiaa189]

-
Barrero, D., Hardy, J.P., Reggio, M., Ozell, B. (2004) CFD and realistic visualization for the analysis of fire scenarios. In ACM SIGGRAPH 2004 Posters. p. 101. Los Angeles, California: ACM.
[https://doi.org/10.1145/1186415.1186535]

- Bolashikov, Z.D., Melikov, A.K., Kierat, W., Popiołek, Z., Brand, M. (2012) Exposure of health care workers and occupants to coughed airborne pathogens in a double-bed hospital patient room with overhead mixing ventilation. HVAC&R Research, 18(4), 602-615.
-
Chan, J.F., Lau, S.K., To, K.K., Cheng, V.C., Woo, P.C., Yuen, K.-Y. (2015) Middle East respiratory syndrome coronavirus: another zoonotic betacoronavirus causing SARS-like disease. Clinical Microbiology Reviews, 28(2), 465-522.
[https://doi.org/10.1128/CMR.00102-14]

-
Cheong, K., Phua, S. (2006) Development of ventilation design strategy for effective removal of pollutant in the isolation room of a hospital. Building and Environment, 41(9), 1161-1170.
[https://doi.org/10.1016/j.buildenv.2005.05.007]

-
Chinazzi, M., Davis, J.T., Ajelli, M., Gioannini, C., Litvinova, M., Merler, S., Pastore Y Piontti, A., Mu, K., Rossi, L., Sun, K., Viboud, C., Xiong, X., Yu, H., Halloran, M.E., Longini, I.M., Jr, Vespignani, A. (2020) The effect of travel restrictions on the spread of the 2019 novel coronavirus (COVID-19) outbreak. Science, 368(6489), 395-400.
[https://doi.org/10.1126/science.aba9757]

-
Cho, J. (2019) Investigation on the contaminant distribution with improved ventilation system in hospital isolation rooms: Effect of supply and exhaust air diffuser configurations. Applied Thermal Engineering, 148, 208-218.
[https://doi.org/10.1016/j.applthermaleng.2018.11.023]

-
Dai, H., Zhao, B. (2020) Association of the infection probability of COVID-19 with ventilation rates in confined spaces. Building Simulation, 13(6), 1321-1327.
[https://doi.org/10.1007/s12273-020-0703-5]

-
Fan, D.-Y., Wang, Q.-Q., Zhao, L., Liu, M.-L. (2020) Status, standards, technologies and existing problems of residential ventilation in China. Indoor and Built Environment, 29(4), 485-495.
[https://doi.org/10.1177/1420326X19862604]

-
Foias, C., Temam, R. (1984) Determination of the solutions of the Navier-Stokes equations by a set of nodal values. Mathematics of Computation, 43(167), 117-133.
[https://doi.org/10.1090/S0025-5718-1984-0744927-9]

-
Ghendon, Y. (1994) Introduction to pandemic influenza through history. European Journal of Epidemiology, 10(4), 451-453.
[https://doi.org/10.1007/BF01719673]

- Ghorui, S. (2020) CFD study of ventilation in a room maintained under negative-pressure to prevent airborne contamination.
-
Girard, M.P., Tam, J.S., Assossou, O.M., Kieny, M.P. (2010) The 2009 A (H1N1) influenza virus pandemic: A review. Vaccine, 28(31), 4895-4902.
[https://doi.org/10.1016/j.vaccine.2010.05.031]

-
Goldmann, D.A. (2000) Transmission of viral respiratory infections in the home. The Pediatric Infectious Disease Journal, 19(10), 97-102.
[https://doi.org/10.1097/00006454-200010001-00002]

-
Hui, D.S., Chow, B.K., Chu, L., Ng, S.S., Lai, S.T., Gin, T., Chan, M.T. (2011) Exhaled air dispersion and removal is influenced by isolation room size and ventilation settings during oxygen delivery via nasal cannula. Respirology, 16(6), 1005-1013.
[https://doi.org/10.1111/j.1440-1843.2011.01995.x]

-
Li, H., Zhong, K., Zhai, Z.J. (2020) Investigating the influences of ventilation on the fate of particles generated by patient and medical staff in operating room. Building and Environment, 180, 107038.
[https://doi.org/10.1016/j.buildenv.2020.107038]

-
Liu, P.P., Blet, A., Smyth, D., Li, H. (2020) The science underlying COVID-19: implications for the cardiovascular system. Circulation, 142, 68-78.
[https://doi.org/10.1161/CIRCULATIONAHA.120.047549]

- McGrattan, K.B., Baum, H.R., Rehm, R.G., Hamins, A., Forney, G.P., Floyd, J.E., Hostikka, S. (2013) Fire Dynamics Simulator (Version 4), Technical Reference Guide. NIST Special Publication, vol. 1018.
-
Miller, S.L., Nazaroff, W.W., Jimenez, J.L., Boerstra, A., Buonanno, G., Dancer, S.J., Kurnitski, J., Marr, L.C., Morawska, L., Noakes, C. (2020) Transmission of SARS-CoV-2 by inhalation of respiratory aerosol in the Skagit Valley Chorale superspreading event. Indoor Air 31(2), 314-323.
[https://doi.org/10.1111/ina.12751]

-
Morawska, L., Tang, J.W., Bahnfleth, W., Bluyssen, P.M., Boerstra, A., Buonanno, G., Cao, J., Dancer, S., Floto, A., Franchimon, F., Haworth, C., Hogeling, J., Isaxon, C., Jimenez, J.L., Kurnitski, J., Li, Y., Loomans, M., Marks, G., Marr, L.C., Mazzarella, L., Melikov, A.K., Miller, S., Milton, D.K., Nazaroff, W., Nielsen, P.V., Noakes, C., Peccia, J., Querol, X., Sekhar, C., Seppänen, O., Tanabe, S.-i., Tellier, R., Tham, K.W., Wargocki, P., Wierzbicka, A., Yao, M. (2020) How can airborne transmission of COVID-19 indoors be minimised? Environment International, 142, 105832.
[https://doi.org/10.1016/j.envint.2020.105832]

-
Noorimotlagh, Z., Jaafarzadeh, N., Martínez, S.S., Mirzaee, S.A. (2020) A systematic review of possible airborne transmission of the COVID-19 virus (SARS-CoV-2) in the indoor air environment. Environmental Research, 110612.
[https://doi.org/10.1016/j.envres.2020.110612]

-
Pitol, A.K., Julian, T.R. (2020) Community Transmission of SARS-CoV-2 by Fomites: Risks and Risk Reduction Strategies. medRxiv, 2020.2011.2020.20220749.
[https://doi.org/10.1101/2020.11.20.20220749]

-
Sánchez-Barroso, G., García Sanz-Calcedo, J. (2019) Evaluation of HVAC design parameters in high-performance hospital operating theatres. Sustainability, 11(5), 1493.
[https://doi.org/10.3390/su11051493]

-
Stein, R.A. (2020) COVID-19 and rationally layered social distancing. International Journal of Clinical Practice, 74(7), 13501.
[https://doi.org/10.1111/ijcp.13501]

-
Stewart, C.L., Thornblade, L.W., Diamond, D.J., Fong, Y., Melstrom, L.G. (2020) Personal protective equipment and COVID-19: a review for surgeons. Annals of Surgery, 272(2), e132.
[https://doi.org/10.1097/SLA.0000000000003991]

-
Tung, Y.-C., Hu, S.-C., Tsai, T.-I., Chang, I.L. (2009) An experimental study on ventilation efficiency of isolation room. Building and Environment, 44(2), 271-279.
[https://doi.org/10.1016/j.buildenv.2008.03.003]

-
Zakaria Abouleish, M.Y. (2020) Indoor Air Quality and Corona-virus Disease (COVID-19). Public Health, 191, 1-2.
[https://doi.org/10.1016/j.puhe.2020.04.047]

-
Zhang, Y., Han, O., Li, A., Hou, L.A., Olofsson, T., Zhang, L., Lei, W. (2021) Adaptive wall-based attachment ventilation: A comparative study on its effectiveness in airborne infection isolation rooms with negative pressure. Engineering.
[https://doi.org/10.1016/j.eng.2020.10.020]

-
Zhu, H.-C., Yu, C.W., Cao, S.-J. (2020) Ventilation online monitoring and control system from the perspectives of technology application. Indoor and Built Environment, 29(4), 587-602.
[https://doi.org/10.1177/1420326X19878586]

Appendix
SUPPLEMENTARY MATERIALS
Fire Dynamics Simulator (FDS)
An FDS is a computational fluid dynamics (CFD) model of fire-driven fluid flow. The software described in this document numerically solves a form of the Navier-Stokes equations appropriate for low-air velocity thermally-driven flow, with an emphasis on smoke and heat transport from fires.
In this study, the FDS software (version 5) was used. FDS is developed by the National Institute of Standards and Technology (NIST). The first version of FDS was publicly released in February 2000. To date, about half of the applications of the model have been for the design of smoke handling systems and sprinkler/detector activation studies. The other half consists of residential and industrial fire reconstructions (McGrattan et al., 2013).
Hydrodynamic Model
The Hydrodynamic Model FDS numerically solves a form of the Navier-Stokes equations, which are appropriate for low air velocity thermally-driven flow, with an emphasis on smoke and heat coming from fires. The core algorithm is an explicit predictor-corrector scheme with second-order accuracy in space and time. Turbulence is treated by means of the Joseph Smagorinsky form of Large Eddy Simulation (LES). The LES is the default mode of operation (Barrero et al., 2004).
The equations of conservation of mass and momentum written in a system of Cartesian coordinates are as follows (Foias, 1984):
Equation of conservation of mass:
| (1) |
whrer:
ρ=Air density (kg/m3)
=Flow velocity
∇=Operator nabla
Equation of conservation of momentum:
| (2) |
where
:Pressure
:Vector of gravity(m/s2))
Such that:
| (3) |
ω=Air velocity component on z (m/s).
| (4) |
= Density of ambient air (kg/m3).
| (5) |
δij=Kronecker delta
| (6) |
Sij = Strain tensor symmetric rate.
Smokeview
Smokeview is software developed as FDS by NIST. It is used to view the geometry, mesh size, and results obtained by FDS and includes several visualization techniques.
Mesh
For a typical building design simulation using FDS, a large volume of space is simulated. In describing this computation volume, one or more subsections of the overall volume are referred to as a ‘mesh’ and entered as ‘&MESH’ in the FDS input file. In many cases, multiple meshes of different resolutions are required to accurately define the simulated domain. Most modern computers have multiple ‘cores’ or processors per CPU chip, and FDS through the Message Passing Interface (MPI) feature allows for each mesh to be assigned to a specific processor using the MPI_PROCESS keyword. This feature enables any number of meshes to be assigned to the same processor to improve simulation efficiency. In the present study, three different meshes have been tested:
- (1) Dense Mesh (DM)
- (2) Less Dense Mesh (LDM)
- (3) Coarse Mesh (CM)


