Physicochemical Characteristics of PM2.5 Based on Long-term Hourly Data at National Intensive Monitoring Sites in Korea
Copyright © 2022 by Asian Association for Atmospheric Environment
This is an open-access article distributed under the terms of the Creative Commons Attribution Non-Commercial License (http://creativecommons.org/licenses/by-nc/4.0/), which permits unrestricted non-commercial use, distribution, and reproduction in any medium, provided the original work is properly cited.
Abstract
The objective of this study was to analyze the temporal and spatial characteristics of fine particulate matters by using huge hourly datasets of PM2.5, including chemical information monitored at the 6 national intensive monitoring sites (NIMSs) from 2013 to 2018 in Korea. Hourly PM2.5 raw datasets were obtained from the National Institute of Environmental Research (NIER) in Korea. Monitoring sites included urban, rural/agricultural, industrial, and marine environments. Since the PM2.5 concentration steadily decreased nationwide, each species concentration also decreased in general. One of key reasons for decreasing PM2.5 might be explained by the implementation of domestic fine dust reduction policies and external influences such as PM2.5 concentration reduction in China. It was observed that 45.0% of all datasets for 6 years were classified as good condition. The average sum of 14 elements over all sites in 2018 was calculated to be 501.5 ng/m3, and its mass ratio for PM2.5 (21.9 μg/m3) was 2.30%. The inorganic elements were generally higher in industrial/urban areas than in agricultural areas. In addition, the average TC (total carbon) over all 6 sites was 28.3% of PM2.5 with the range of 23.6% to 31.4%. The TC in small urban areas was much higher than that in marine areas or even that in large, populated urban area/industrial areas. It seemed that the latter areas were better controlled than the former area in terms of combustion activities of fossil fuels. It is suggested that these results could be play an important role as important basic data to manage ambient air quality and establish effective emission reduction strategies in each region.
Keywords:
PM2.5, PM10, Chemical composition, Mass ratio, Unidentified fraction1. INTRODUCTION
Fine particulate matter (FPM) in the accumulation size mode remains and is transported in air much longer than that in other modes (McMurry et al., 2004; EPA, 1999). Thus, it can increase exposure time and directly affect health risks. Further, it is obvious that PM penetrates deep into the alveoli through the upper and lower respiratory tracts of the human body and causes pulmonary diseases such as emphysema or asthma, or cardiovascular diseases (Dockery and Stone, 2007). In addition, it reduces visual range and adversely affects crop growth (KOSAE, 2018). The WHO (World Health Organization) estimated that PM in the air environment contributed to 3.2 million premature deaths worldwide in 2010, mostly from cardiovascular diseases, and 223,000 deaths from lung cancer (WHO, 2013). Related to outdoor and indoor air pollution, WHO recently evaluated 7 million deaths worldwide in 2016 due to cardiovascular disease, stroke, respiratory disease and cancer (WHO, 2021a), and then strengthened air quality guidelines for PM2.5 down to 5 μg/m3 for the annual mean and 10 μg/m3 for the 24-hr mean in Sep. 2021 (WHO, 2021b).
The National Ambient Air Quality Standard (NAAQS) in Korea for PM started in 1983 as total suspended particulate (TSP) with a diameter of 500 μm or less. TSP was deleted from the NAAQS, and only PM10 has been regulated since 2001 (Kim, 2013). In 2015, the NAAQS for PM2.5 was set to an annual mean of 25 μg/m3 and a 24-hr mean of 50 μg/m3. However, since the standard was too loose compared to WHO or other foreign standards, the MOE (Ministry of Environment) strengthened the PM2.5 standard a few years later, and the annual and 24-hr standards have been changed to 15 μg/m3 and to 35 μg/m3, respectively, since March 2018 (MOE, 2018). According to a report (MOE, 2020a), annual average level for PM2.5 slightly improved to 26 μg/m3 in 2016, 25 μg/m3 in 2017, and 23 μg/m3 in 2018, but the levels still far exceeded the latest standard of 15 μg/m3. Due to significant social problems related to PM2.5 in the last decade in Korea, the “Special Act on PM Reduction and Management” was enacted on Feb 2019 (MOE, 2019a). By law, the MOE had to prepare a comprehensive PM management plan by November 2019. The goal of the plan was to reduce the average level of PM2.5 nationwide from 26 μg/m3 in 2016 to 16 μg/m3 in 2024 during the period of 2020 to 2024 (MOE, 2019b).
PM is not a simple compound, but a mixture of particles with various sizes containing various chemical species. Usually, PM is composed of sulfate, nitrate, ammonium, and other ionic species, carbon species (such as organic, inorganic, and elemental carbons) and other inorganic elements. Properly providing supplementary meteorological parameters, the chemical species in PM (PM10 and PM2.5) provide key information on where the PM came from, what the PM sources were, how the PM formed, and even when the PM formed. For example, PMs composed of many elements such as Si, Al, Fe, K, Ca are mainly emitted from a soil-related source, sulfate is from combusting sulfur-containing fossil fuels, and V and Ni are from oil combustion sources (Hopke, 1985). Recently, there have been many studies to characterize chemical species of PM2.5 nationwide in Korea such as a study of chemical characteristics of PM2.5 in Seoul in 2019 (Um et al., 2020), a study of the origins and distributions of atmospheric ammonia in Jeonju during 2019-2020 (Park et al., 2020), a study on the characteristics of PM2.5 chemical compositions and high-concentration episodes from 2013 to 2016 in Jeju (Kim et al., 2020), a study on PM2.5 and its chemical compositions from 2017 to 2018 in Jeonju (Jo et al., 2018), estimation of emission source contribution of OC and EC in the spring of 2016 in Seoul (Ham et al., 2017), and a study on the distribution of heavy metals during 2013 and 2014 in Gyeonggi-do (Kim et al., 2014).
The purpose of this study is to analyze the temporal and spatial characteristics of fine particulate matters by using huge hourly datasets of PM2.5, including chemical information monitored at the 6 national intensive monitoring sites (NIMSs) in Korea during the period of 2013 to 2018. These research results can play an important role as basic data for air quality management and establishment of effective emission reduction strategies in each region.
2. EXPERIMENTAL METHODS
2. 1 Data Collection and Analytical Methods
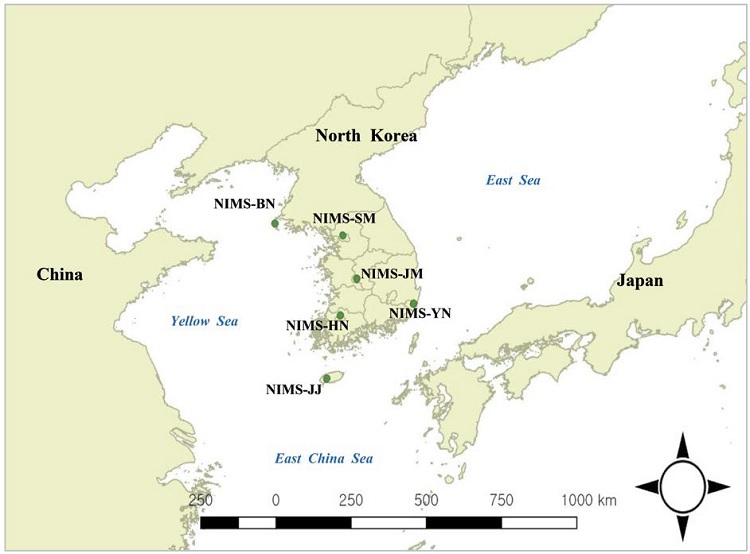
The national intensive monitoring sites (NIMSs) have been operated by the Ministry of Environment (MOE) since 2013 and were developed (i) to describe the status of the ambient air environment nationwide including urban/agricultural/industrial/marine areas, (ii) to measure various ionic species and trace elements contained in long-range transported PM, and finally (iii) to identify the reasons for high PM episodes in Korea. There are a total of six sites such as the Joongbu Site (NIMS-JB), the Seoul Metropolitan Site (NIMS-SM), the Honam Site (NIMS-HN), the Baengnyeongdo Site (NIMS-BN), the Youngnam Site (NIMS-YN), and the Jeju Site (NIMS-JJ) (MOE, 2019c). Recently, the MOE has made the hourly raw data containing chemical information of PM2.5 available. Fig. 1 shows the locations of these six NIMSs in Korea, and Table 1 provides information on location, site category, and monitoring purpose for each NIMS (NIER, 2019). In summary, NIMS-SM and NIMS-JB were established to represent air in large and medium urban areas, respectively, NIMS-HN is used to monitor rural/agricultural areas, NIMS-YN to monitor industrial air, and NIMS-BN and NIMS-JJ to monitor background marine air.
The MOE provided raw sample datasets monitored during 6 years from January 1, 2013 to December 31, 2018 for all 6 NIMSs. The hourly datasets for PM10 and PM2.5 as well as chemical information on PM2.5 were analyzed in this study. PM10 and PM2.5 were separately monitored at each NIMS via size selection by an inertial impactor type inlet and a cyclone type inlet, respectively. After collecting the PM on each filter, mass concentration was determined by a beta-ray absorption method, which detects beta-rays before and then determines PM concentration by beta-ray attenuation after sampling with a high-sensitivity detector (NlER, 2019). Ionic species in PM2.5 were analyzed by ion chromatography after PM collection. Carbon species were analyzed by a thermal/optical transmittance method and a non-dispersive infrared method. Finally, non-destructive x-ray fluorescence spectroscopy (XRF) was employed for trace elements. Further detailed analytical and sampling methods in this study can be found in the literature (NIER, 2019).
2. 2 Data Pretreatment Steps for Characterization of PM and Chemical Species in PM2.5
Statistical analysis was performed after proper pretreatments for sample datasets monitored at hourly intervals from 2013 to 2018 over 6 NIMSs. Initially when either a PM10 or PM2.5 mass datum was missing, it was removed from each sample dataset at each NIMS. A datum was also removed when the PM2.5 mass was higher than the PM10 mass, that is, when F/C ratio>1 (i.e., when the mass ratio of fine particles/coarse particles=PM2.5/PM10 ratio is over 1). After performing the 1st pretreatment step for Study-1, 277,681 (91.0%) out of 305,208 raw sample datasets were left as shown in Table 2. By using the remaining samples, PM10 and PM2.5 mass behaviors, F/C ratios, and relationships with meteorological parameters were investigated for each site.
In Study-2 for chemical characterization, all raw datasets consisting of PM2.5 mass, 8 ionic species (SO42-, NO3-, NH4+, Cl-, Na+, K+, Mg2+, and Ca2+), and 2 carbon components (OC, EC) were examined during the 2nd pretreatment step. When any one of those 10 chemical species was missing or if the sum of them was greater than PM2.5 mass, the hourly dataset for that time was deleted from the analysis. The number of raw samples was 305,208, but only 166,331 samples (54.5%) remained after the pretreatment. In Study-3, the mass ratio for each inorganic element was analyzed based on samples measured only in 2018. Among the initial raw data of 17 inorganic elements (i.e., Si, S, K, Ca, Ti, V, Cr, Mn, Fe, Ni, Cu, Zn, As, Se, Br, Ba, and Pb), three elements (S, K, and Ca) were excluded since those overlapped with ion species mentioned above. For the 3rd data pretreatment step, all the corresponding raw samples were deleted during this pretreatment step if 1) any of the 24 species including 14 elements was missing in the same sample, 2) PM2.5 measurement was missing or its mass concentration was zero, or 3) if the F/C ratio exceeded 1. After the step, the number of initial samples was 52,560, but only 27,910 samples (53.1%) were left for the next analysis.
3. RESULTS AND DISCUSSION
3. 1 Physical Characteristics of PM (PM10 and PM2.5) for Study-1
For 6 years from 2013 to 2018, the average annual range of PM10 concentration at each NIMS was 28.9 to 50.9 μg/m3, and PM2.5 was 16.1 to 31.9 μg/m3. Table 3 summarizes 6-year average statistics for PM, F/C ratio, and meteorological parameters at each site. For the PM levels, it was observed that NIMS-JB>NIMS-SM>NIMS-HN>NIMS-BN>NIMS-YN>NIMS-JJ. The NIMS-JB located on a medium sized urban city in the middle of Korea showed the highest PM level. However, the NIMB-JJ located on the biggest southern island showed the lowest PM level. As shown in Table 3, PM2.5 levels over the country exceeded the 2021 WHO guidelines as well as the 2018 Korean NAAQS.

A summary of statistics for 6-year averages of PM, F/C ratio, and meteorological parameters (Study-1).
In our study, the average range of the F/C ratio was 0.55 to 0.64 over 6 NIMSs, as shown in Table 3. We observed that the F/C ratio tended to be higher as the average concentrations of PM10 and PM2.5 increased together. This means that the increase rate of PM2.5 is generally faster than that of PM10. Further, the ratio was higher in urban and agricultural areas than in marine and industrial areas. It is obvious that there are enormous PAL sources (point, area, line source) emitting primary PM2.5 as well as man-made gaseous pollutants forming secondary PM2.5 in densely populated urban areas. However, there are few distinct PAL sources in sparsely populated background marine areas. Though many point sources exist in industrial areas (like near NIMS-YN), it seems that the sources in that area are well controlled by strict emission regulations. On the other hand, even though there are few point and line sources in agricultural areas like near NIMS-HN, the area sources emitting gaseous pollutants like NH3 might be a major contributor to the formation of secondary PM2.5, and there are many scattered area sources emitting various gaseous and particulate matter from illegal burning of agricultural wastes and solid refused fuel (SRF) in that area. According to the CAPSS (Clean Air Policy Support System) data of the Ministry of Environment as of 2018, NH3 emissions from the agricultural sector were the highest in Honam region with 67,836 tons, followed by the Youngnam, Joongbu, and the metropolitan area at 59,930 ton, 59,877 ton, and 42,677 tons, respectively (NAEIRC, 2019).
A correlation result among annual averages of PM10, PM2.5, and F/C ratios showed that PM10 and PM2.5 were highly correlated with r=0.941 and p-value=0.000. However, PM2.5 and F/C ratio were moderately correlated with r=0.737 and p-value=0.000. Furthermore, PM10 and F/C ratios were poorly correlated with r=0.513 and p-value=0.002. In addition, PM10 and PM2.5 were higher at NIMS-JB and NIMS-SM, both located in urban areas, where WS was quite low at 1.35 m/s and 2.11 m/s, respectively, than at NIMS-JJ (in a marine area), where PM10 and PM2.5 were the lowest with an average WS of 3.08 m/s. Thus, it seems to be that WS inversely impacted PM10 and PM2.5 by dispersed bulk motion. However, even though NIMS-BN located in far western marine areas had the highest wind speed of 4.1 m/s, elevated levels of PM10 and PM2.5 were observed compared to NIMS-YN in land industrial area and NIMS-JJ in a southern marine area. It might be directly affected by PM flowing from outside since NIMS-BN is 180 km away from mainland China and only 14 km away from North Korea. According to Im et al. (2021), high PM10 and PM2.5 during the period of 2015 to 2020 were affected by incoming PM from outside because there are no distinct emitting sources inside the island.
As another correlation result among annual averages of PM10, PM2.5, and WS, when all average data over all 6 sites were used, both PM10 and PM2.5 were weakly but negatively correlated with WS with r=-0.436, p-value= 0.009 and r=-0.518, p-value=0.001, respectively, at 95% significance level, as shown in Fig. 2(a) and (b). However, since NIMS-BN had a big standard deviation and the fastest WS when calculating annual averages of PM, we reanalyzed the relationships between PM and WS after excluding NIMS-BN. The result showed that the correlation coefficient was negative but stronger than before, as shown in Fig. 2(c) and (d). PM10 and PM2.5 were clearly negatively correlated with WS by r=-0.742, p-value=0.000 and r=-0.778 and p-value=0.000, respectively. The point was that less scattered plots were obtained when NIMS-BN was excluded in the analysis. The air quality of NIMS-BN was likely influenced by wind direction rather than wind speed because the site is located on a small island is surrounded by China, South and North Korea and it has few internal emission sources, as mentioned above.
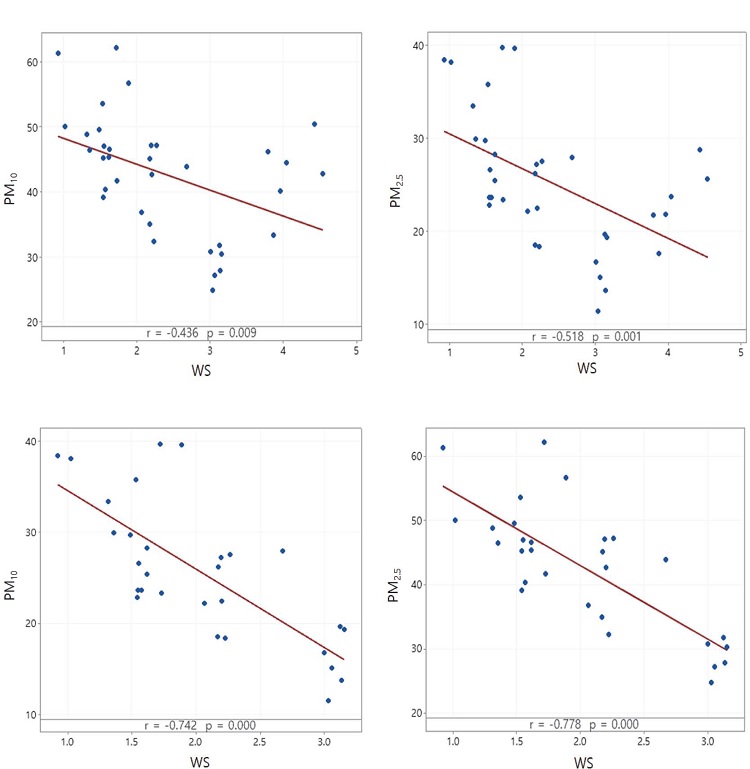
Scattered correlation plots for WS vs. PM10 and WS vs. PM2.5: (a) WS vs. PM10, (b) WS vs. PM2.5, (c) WS vs. PM10 after deleting samples of NIMS-BN, and (d) WS vs. PM2.5 after deleting samples of NIMS-BN.
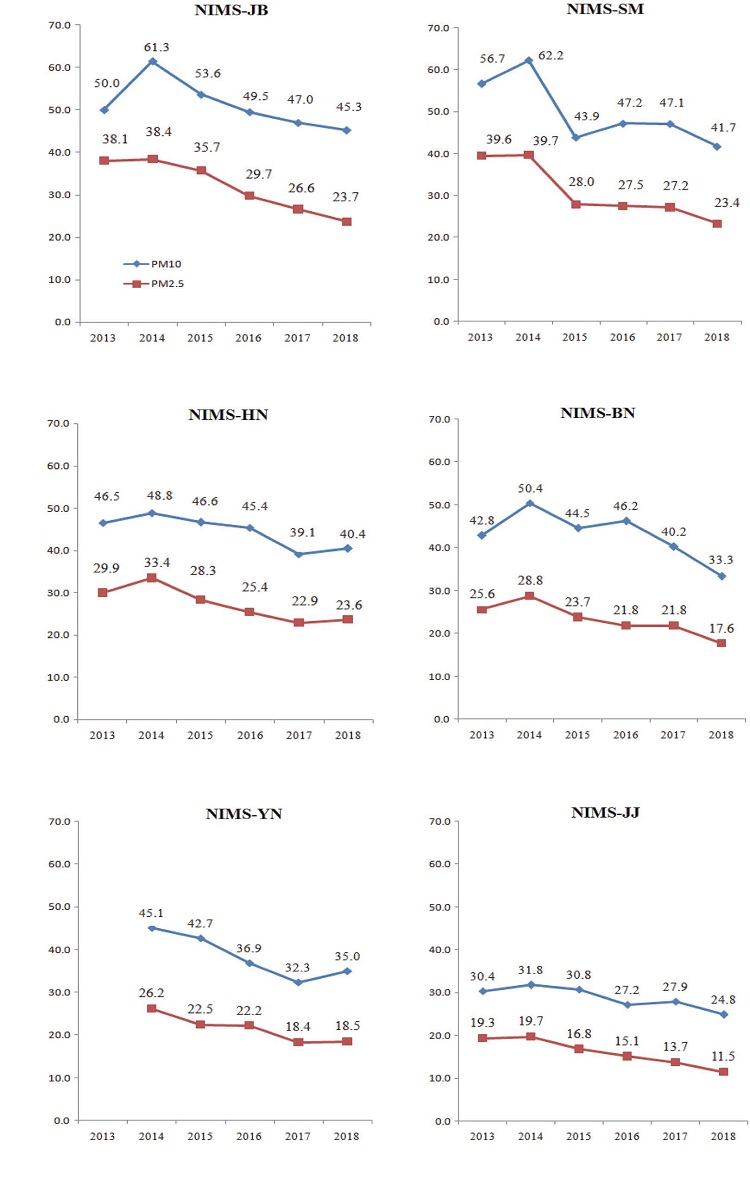
Fig. 3 shows annual average concentrations of PM10 and PM2.5 at each NIMS, which show an overall decreasing trend. It must be noted that the annual average PM was calculated with sample datasets after performing the data pretreatment step, as shown in Table 2. Thus, 277,681 out of 305,208 datasets were utilized in this analysis. As shown in Fig. 3, the annual PM10 and PM2.5 at NIMS-JB gradually decreased after peaking in 2014 at 61.3 μg/m3 and 38.4 μg/m3, respectively. They were 45.3 μg/m3 and 23.7 μg/m3 in 2018, respectively, and decreased by 9.5% and 37.8%, respectively, compared to 2013. For a case at NIMS-SM in Seoul, PM10 and PM2.5 in 2018 decreased by 26.5% and 41.0%, respectively, compared to 2013. The PM10 and PM2.5 of NIMS-JJ on Jeju Island decreased by 18.2% and 40.5%, respectively, compared to 2013. The NIMS-JJ was only one site that could meet the new PM2.5 standard of 15 μg/m3 in the years of 2017 and 2018. We suggest that a reason for this decreasing trend of PM is the change in socio-environmental points of view in Korea. It seems that the social concern and activity for PM2.5 soared since 2013, even though the MOE started to measure PM2.5 nationwide in the beginning of 2015. In 2013, a pilot forecast of PM2.5 was implemented after the International Agency for Research on Cancer (IARC) classified air pollution and PM2.5 as group 1 carcinogens in 2013. Since then, social interests in PM, especially PM2.5, have increased considerably. The government had to implement and enforce various laws and policies every year from then on, such as the Special Plan on PM Management in 2016, the Comprehensive Plan on PM Management in 2017, the Special Act on PM Reduction and Management in 2019, and so forth (MOE, 2019b) to deal with public complaints. It is estimated that the continuous decrease in PM2.5 concentration has improved further due to external influences such as fine dust reduction in China as well as the implementation of domestic fine dust reduction policies. The PM2.5 concentration in Beijing, China decreased by about 50.1% from 101.6 μg/m3 in 2013 to 50.7 μg/m3 in 2018 (Statista, 2022).
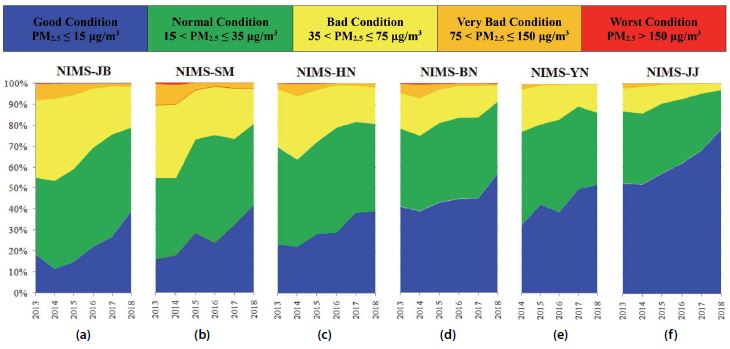
To comprehensively understand the air quality status, we initially analyzed all 277,681 hourly PM2.5 samples over 6 NIMSs and classified the samples into 5 conditions according to the forecast criteria by the guideline of the MOE (MOE, 2018): good condition (PM2.5≤15 μg/m3), moderate (15-35 μg/m3), bad (35-75 μg/m3), very bad (75-150 μg/m3), and the worst warning class (PM2.5>150 μg/m3). As a result, the air quality condition for 6 years is shown in Fig. 4. The results were as follows: 45.0% of the hourly PM2.5 samples were sorted into good condition, 38.0% in normal, 15.2% in bad, 1.8% in very bad, and 0.1% in the worst warning conditions. The figure shows the trend of the conditions for each NIMS and plots (a) through (f) contain annual trends for each NIMS. The sums of bad and worse conditions (that is, highly polluted conditions) were 34.6%, 30.0%, and 25.3% observed at NIMS-JB, NIMS-SM, and NIMS-HN, respectively, while 17.4% and 16.4% were observed at NIMS-BY and NIMS-YN, respectively, and lastly NIMS-JJ was only 8.8%. It is obvious that the good/moderate conditions are increasing in all sites, and the bad/very bad/worst conditions are continuously decreasing. Specifically, in the case of NIMS-SM in Seoul, the percentage of good/normal conditions in 2018 increased by 82.4% compared to 2013. The improved percentages in 2018 compared to 2013 were 37.2% in NIMS-JB, 30.3% in NIMS-YN, 22.8% in NIMS-BN, and 14.4% in NIMS-HN, respectively. The value for NIMS-JJ on Jeju Island, was only 1.4% with no significant difference since relatively good air quality conditions were observed in 2013. Fortunately, the data seldom exceeded 150 μg/m3 for PM2.5 except at NIMS-SM in 2017 and NIMS-BN in 2018.
3. 2 Chemical Characteristics of 8 Ionic Species and EC/OC in PM2.5 for Study-2
PM2.5 is emitted directly from various sources as primary aerosols such as PAL sources, which are mostly emitted by combustion of fossil fuels (Kondratyev et al., 2006). PM2.5 is also generated as a secondary aerosol in the forms of sulfate (SO42-), nitrate (NO3-), ammonium (NH4+) by chemical reactions with various precursor gases like sulfur oxides (SOx), nitrogen oxides (NOx), and ammonia (NH3) in the troposphere (EEA, 2020). In the presence of moisture (H2O) in the atmosphere, the SO42- and NO3- react with NH3 to generate particulate ammonium sulfate ((NH4)2SO4) and ammonium nitrate (NH4NO3). In addition, secondary PM2.5 is also generated by a photochemical reaction between ozone (O3) and various volatile organic carbons (VOC) in the form of secondary organic aerosols (SOAs) in the atmosphere (McMurry et al., 2004).
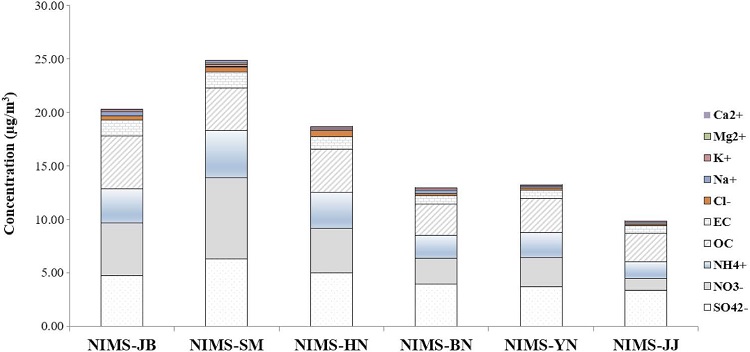
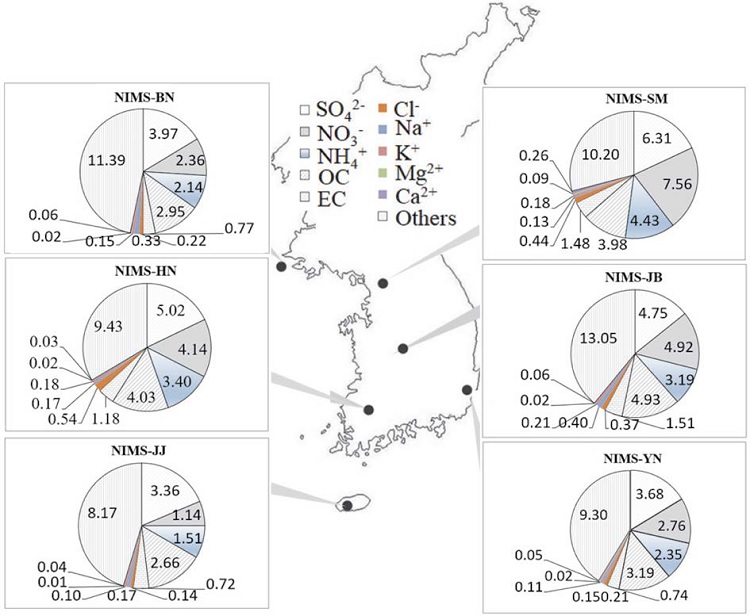
Among the chemical species measured hourly at 6 NIMSs, the 6-yr average concentrations (5-yr average in the case of NIMS-YN) for each species in PM2.5 were calculated and then plotted in Fig. 5. It must be noted that the average concentration was calculated based on 166,331 samples over 6 NIMSs after performing data pretreatment steps. The figure shows histograms of stacked average concentrations for 10 chemical species including 8 ionic species (SO42-, NO3-, NH4+, Cl-, Na+, K+, Mg2+, and Ca2+), and 2 carbon components (OC, EC). Again, each concentration for each species was a mean calculated based on the hourly samples during the period of 2013 to 2018 except NIMS-YN during 2014 to 2018. In addition, Fig. 6 is a location map together with chemical compositions in terms of average ratios of each species to PM2.5. The ‘others’ in the figure stands for the average percentage of all other unmeasured species except the 10 measured species in PM2.5.
Table S1 shows the overall summary of Study-2 containing annual average concentrations and mass ratios for five major chemical species such as SO42-, NO3-, NH4+, OC, EC in PM2.5 measured at each NIMS after proper data pretreatment. When employing all 166,331 sample datasets together to obtain basic statistics during the study period, the average species concentration and its mass ratio to PM2.5 (26.85 μg/m3) were calculated: SO42- (4.48 μg/m3, 16.7%), NO3- (3.79 μg/m3, 14.1%), NH4+ (2.84 μg/m3, 10.6%), OC (3.65 μg/m3, 13.60%), EC (1.07 μg/m3, 4.0%), Cl- (320 ng/m3, 1.2%), Na+ (226 ng/m3, 0.8%), K+ (155 ng/m3, 0.6%), Mg2+ (27 ng/m3, 0.1%), Ca2+ (75 ng/m3, 0.3%), and the rest (10.22 μg/m3, 38.1%). Describing the 6-yr average at each site for each species, average SO42- concentrations ranged from 3.36 to 6.31 μg/m3 in the order of NIMS-SM (6.31 μg/m3)>NIMS-HN (5.02 μg/m3)>NIMS-JB (4.75 μg/m3)>NIMS-BN (3.97 μg/m3)>NIMS-YN (3.68 μg/m3)>NIMS-JJ (3.36 μg/m3).
The average mass ratio of SO42- was the highest among all 10 species measured. The SO42- ratios at NIMS-SM and NIMS-HN were higher than the other NIMSs. It is known that SO2 as a precursor of SO42- is emitted from power plants, industrial facilities, and various fugitive area sources using fossil fuels such as coal, oil, and bio-SRF (biomass-solid refuse fuel) containing sulfur. Even though the forming rate in winter is slower than in other seasons (Hodan and Barnard, 2004), a huge amount of SO42- was emitted from local areas in addition to long-range transport from the outside regional area due to an increase in burning activity in winter (Park et al., 2019). The Korean MOE reported that SO2 is mainly emitted from the power generation sector in the energy industry and other sectors in petroleum product and manufacturing industries (MOE, 2020a). The European Environment Agency (EEA) estimated that SO2 is emitted from energy supply (47%), manufacturing and industrial sectors (33%) (EEA, 2020).
As shown in Fig. 5, the average concentrations of NO3- in 2018 ranged from 1.14 to 7.56 μg/m3 over NIMSs, in the order of NIMS-SM (7.56 μg/m3)>NIMS-JB (4.92 μg/m3)>NIMS-HN (4.14 μg/m3)>NIMS-YN (2.76 μg/m3)>NIMS-BN (2.36 μg/m3)>NIMS-JJ (1.14 μg/m3). The average mass ratio of NO3- in PM2.5 was 14.2%, showing the second highest ratio among 10 species. Particularly, NIMS-SM in Seoul was observed to have a 21.5% mass ratio, which was remarkably high compared to the other NIMSs. It is obvious that gaseous NO and NO2 as a precursor of particulate NO3- are widely emitted from mobile sources in metropolitan areas. In the USA, SO42- was higher in the eastern part of the country than in the west, whereas NO3- was a specific major pollutant in western urban areas (Hodan and Barnard, 2004). The EEA showed that NOx was emitted mainly from mobile sources (39%), energy supply, manufacturing and industrial sectors, and agriculture (15% each) (EEA, 2020). According to the CAPSS in Korea (MOE, 2020b), mobile sources including passenger cars were the largest emitters, followed by freight cars>ships>RVs>construction equipment. Point sources such as power plants and chemical manufacturing processes were the next highest emitter of NOx.
The average NH4+ in Fig. 6 ranged from 1.51 to 4.43 μg/m3 in the order of NIMS-SM (4.43 μg/m3)>NIMS-HN (3.40 μg/m3)>NIMS-JB (3.19 μg/m3)>NIMS-YN (2.35 μg/m3)>NIMS-BN (2.14 μg/m3)>NIMS-JJ (1.51 μg/m3). The average mass ratio over all NIMSs was 10.5% of PM2.5, and NIMS-SM and NIMS-HN were respectively 12.6% and 12.1% higher than the other NIMSs. In the USA, gaseous NH3 as the precursor of NH4+ is mostly emitted from agricultural activities, urban/commercial composting processes, mobile sources, and particular chemical industries (EPA, 2021). The EEA estimated that most NH3 (93%) was emitted from agricultural activities (EEA, 2020). In Korea, even though emission inventory for NH3 is not yet complete, it seemed to be mostly emitted from manure processing and fertilizer use in the agricultural sector as well as from the petroleum product industry sector (MOE, 2020b). As a result, the average organic carbon (OC) in Fig. 6 was in the range of 4.93-2.66 μg/m3, in the order of NIMS-JB (4.93 μg/m3)>NIMS-HN (4.03 μg/m3)>NIMS-SM (3.98 μg/m3)>NIMS-YN (3.19 μg/m3)>NIMS-BN (2.95 μg/m3)>NIMS-JJ (2.66 μg/m3). It occupied the third highest mass ratio, representing 13.5% of PM2.5. On the other hand, elemental carbon (EC) was 1.51-0.72 μg/m3 in the order of NIMS-JB (1.51 μg/m3)>NIMS-SM (1.48 μg/m3)>NIMS-HN (1.18 μg/m3)>NIMS-BN (0.77 μg/m3)>NIMS-JJ (0.74 μg/m3)>NIMS-YN (0.72 μg/m3). The OC accounted for 3.9% in PM2.5, showing the lowest mass ratio among SO42-, NO3-, NH4+, OC, and EC. In general, OC is directly emitted by combustion of fossil fuels (as primary source) and is also formed during the condensation of low vapor pressure products generated from photochemical reactions of VOC as a secondary source. In urban areas, both OC and EC were emitted directly from fossil fuels such as diesel vehicles and bio-incineration (Seinfeld and Pandis, 2012; Hodan and Barnard, 2004). Elevated OC was observed during hazy days in 2001 from biomass burning outside Seoul (Kang et al., 2004). In the case of Europe, more than half the emissions were estimated to be from the manufacturing and industrial sectors (52%), the agricultural sector (20%) and the residential/commercial sector (14%) (EEA, 2020). Although there are no source inventories for EC and OC in PM2.5 for recent years in Korea, an inventory of VOCs indicate it is indirectly generated from organic solvent-using sector (MOE, 2020b).
The OC/EC ratios were calculated for all samples over all sites, and the ratios were in the range of 2.86 for the large urban NIMS-SM to 4.14 at the industrial NIMS-YN with an average of 3.56 in Korea. Tan et al. (2009) reported that OC/EC ratios ranged from 2.8 to 6.2 with an average of 4.7 during normal and hazy days in Guangzhou, China. Part et al. (2001) measured ratios at the Sihwa industrial area in 1998-1999 in Korea. The ratios ranged from 4.4 to 12.0 and were higher than those for other urban and rural environments. They concluded that the ratio from primary emissions was influenced by temporal fluctuations of factory activities in the industrial complex and meteorological conditions. On the other hand, average OC/EC ratio was 6.6, a ratio similar to that of biomass burning emissions in Agra, India (Pachauri et al., 2013).
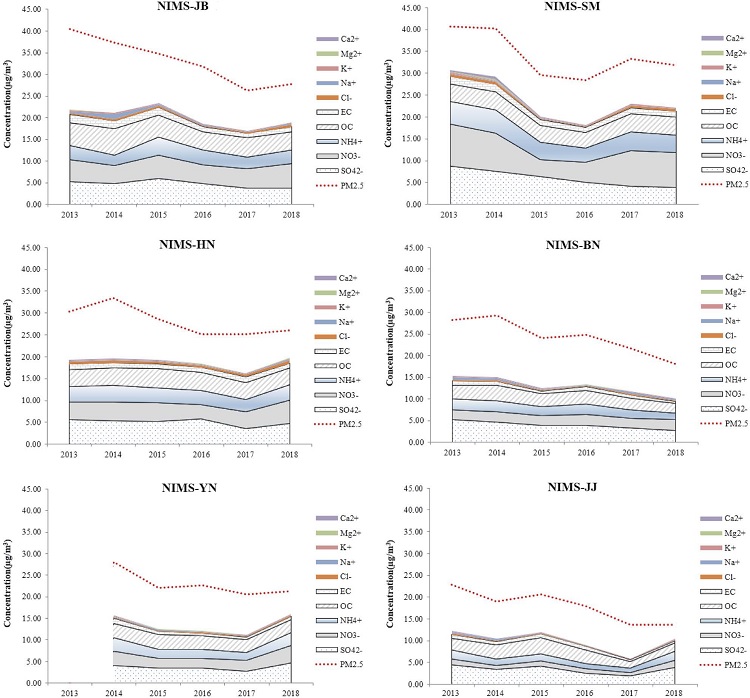
Again, as can be seen in Fig. 6, the average concentration for other minor species such as Cl-, Na+, K+, Mg2+, and Ca2+ was in the range of 0.01 to 0.54 μg/m3, accounting for only 0.1 to 1.9% of the mass ratio in PM2.5. The order of their mass ratios was Cl->Na+>K+>Ca2+>Mg2+. Their annual average trends for each NIMS is shown in Fig. 7. Overall, PM2.5 concentrations (i.e., the dotted line in the figure), tend to decrease with small fluctuations. SO42- at NIMS-YN and NIMS-JJ, NO3- at NIMS-SM and NIMS-HN, NH4+ at NIMS-YN and NIMS-JJ, and OC at NIMS-SM increased, but all the other species showed stagnant or decreasing trends at all sites. Especially, NO3- at NIMS-SM in Seoul increased significantly in 2018. However, SO42- in 2018 decreased at all 5 sites except at NIMS-YN, where it increased by 15.4% in 2018 as compared to 2013. NO3- in 2018 was increased by 8.4% to 33.4% at all 5 sites except NIMS-SM as compared to 2013. Also, OC in 2018 was increased by 5.0% and 0.9% at NIMS-SM and NIMS-HN, respectively. With the ratio of NO3- to SO42- (N/S ratio), the contribution of mobile and stationary pollutants in the air can be assessed qualitatively. In this study, the average N/S ratio was 0.35 to 1.29, which was high in the Seoul metropolitan and Joongbu area, and low in Baengnyeong-do and Jeju-do. The N/S ratio in the Seoul metropolitan area continued to increase except in 2015, and it showed a maximum value of 2.0 in 2018. This means that the Seoul metropolitan area and the Joongbu area have a large effect of mobile emission sources, and it can be confirmed that the fixed pollution source has a large effect on Baengnyeongdo and Jeju Island, which has a relatively small population. The impact of major pollutants by region requires a more in-depth analysis through an receptor model analysis in the future.
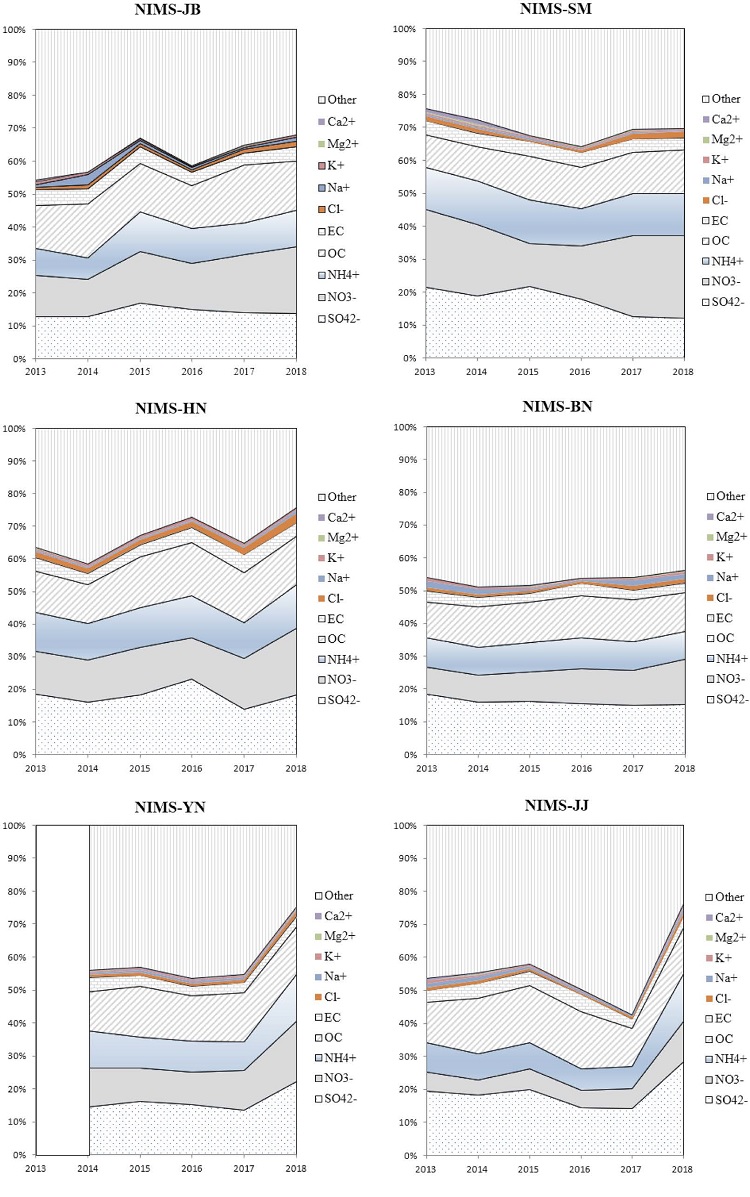
Fig. 8 shows stacked plots containing annual trends for 10 chemical compositions in PM2.5 at each NIMS. After calculating mass ratios for each species to PM2.5, its annual trend from 2013 to 2018 (2014 to 2018 at NIMS-YN) was plotted for each site. The mass ratios for each species in PM2.5 must be an essential entry in PM2.5 source inventory and then it can be directly used to identify the PM2.5 emission sources, especially in the field of receptor modeling like source apportionment studies.
When looking over the annual concentration trends of 5 major species at each NIMS shown in Fig. 8, initially SO42-, OC, and EC decreased sharply at NIMS-JB in a medium-sized urban area after peaking in 2015, but NO3- increased. However, SO42-, OC, EC, and NH4+ decreased in 2018 compared to 2013 by 26.2%, 21.4%, 37.6%, and 8.1%, respectively. On the other hand, NO3- increased by 11.6%. At NIMS-SM in the Seoul metropolitan area, most species showed a decreasing trend during 2013-2015, but there were stagnant or increasing species during 2015-2017. These include SO42-, NO3-, NH4+, and EC, which decreased in 2018 compared to 2013 by 55.6%, 17.6%, 21.5%, and 33.5%, respectively, but OC increased by 5.0%. At NIMS-HN in a rural/agricultural area, SO42-, NH4+, and EC decreased in 2018 compared to 2013 by 15.3%, 3.6%, and 19.0%, respectively, whereas NO3- and OC increased by 33.4% and 0.9%, respectively. For NIMS-BN in a western marine area, SO42-, NH4+, OC, and EC decreased by 47.1%, 39.9%, 30.0%, and 45.8%, respectively, but NO3- increased by 8.4%. At NIMS-YN in an industrial area, NH4+, OC, and EC decreased in 2018 compared to 2014 by 4.4%, 8.1%, and 42.8%, respectively, while SO42- and NO3- increased by 15.4% and 21.4%, respectively. Lastly, at NIMS-JJ in a southern marine area, SO42-, NH4+, OC, and EC decreased in 2018 compared to 2013 by 13.0%, 3.6%, 30.2%, and 44.9%, respectively, while NO3- increased by 30.4%. When comparing reduction rate at all 6 NIMSs from 2013 to 2018 (2014 to 2018 at NIMS-YN), EC showed the highest reduction of 37.2%, and SO42-, NH4+, and OC showed high reductions of 23.7%, 13.5%, and 14.0%, respectively. On the other hand, only NO3- increased by 14.6%.
Trends in terms of mass ratio at each site are presented in Table S1, which provides all statistics for 5 major species in detail. Briefly, the mass ratio at NIMS-JB showed an increasing trend in 2018 compared to 2013, except for EC. That is, the mass ratio of EC to PM2.5 decreased slightly from 0.048 in 2013 to 0.043 in 2018. At NIMS-SM in Seoul, the mass ratio of SO42- to PM2.5 decreased from 0.214 in 2013 to 0.122 in 2018. However, NO3- increased slightly from 0.236 to 0.249, and OC increased from 0.098 to 0.131. At NIMS-HN in an agricultural area, NO3- increased from 0.131 to 0.204 and NH4+ increased slightly from 0.121 to 0.136. On the other hand, at NIMS-BN on a western island, SO42- decreased from 0.185 to 0.153, but NO3- greatly increased from 0.081 to 0.137. At NIMS-YN in an industrial area, EC decreased slightly from 0.043 in 2014 to 0.032 in 2018, and SO42- and NO3- increased greatly from 0.146 to 0.221 and from 0.116 to 0.185, respectively. Lastly, at NIMS-JJ on a southern island, EC decreased slightly from 0.037 in 2013 to 0.034 in 2018, but other species such as SO42- (0.195 to 0.283), NO3- (0.057 to 0.123), and NH4+ (0.090 to 0.144) increased greatly.
3. 3 Chemical Characteristics of 8 Ionic Species, EC/OC, and 14 Elements in PM2.5 for Step 3
Mass ratios of each chemical species in PM2.5 is as important as the mass concentration of each species when characterizing PM2.5 physicochemical properties, apportioning quantitative PM2.5 sources, and seeking proper control measures. Among the chemical species measured at 6 NIMSs, samples for a total of 24 chemical species including 8 ionic species (SO42-, NO3-, NH4+, Cl-, Na+, K+, Mg2+, and Ca2+), 2 carbon components (OC, EC), and 14 other elements (Si, Ti, V, Cr, Mn, Fe, Ni, Cu, Zn, As, Se, Br, Ba, and Pb) were analyzed after proper data pretreatment, as described in §2.2. Again, it is noted that the following study is focused on 2018 because the samples for all 14 inorganic elements have been provided at all 6 NIMSs since then.
Table S2 shows a summary of average concentration in unit of μg/m3 and mass ratio for major chemical species and the other species groups measured at each NIMS in 2018. For the inorganic elements in Table S1, the sum of averaged 14 elements was calculated by 501.5 ng/m3 and its mass ratio to PM2.5 (21.9 μg/m3) was 2.30%. The sum of mass ratios for each element was observed in the range of 1.74% to 2.82% over 6 NIMSs in the order of NIMS-YN (2.82%)>NIMS-JB (2.81%)>NIMS-JJ (2.60%)>NIMS-BN (1.92%)>NIMS-SM (1.90%)>NIMS-HN (1.74%). The elements were generally higher in industrial/urban areas than in agricultural areas. According to Matawie et al. (2015), the mass fraction was higher in mobile sources in Raipur, India.
In this study, average fractions for 24 measured species were in the range of 67.1% at NIMS-BN to 89.7% at NIMS-JJ with a mean of 82.7% for all 6 sites. The 3 major elements such as Si, Fe, and Zn were abundant in PM2.5. Average concentrations for all samples were highest for Si (208.4 ng/m3), Fe (289.3 ng/m3), and Zn (43.1 ng/m3), followed sequentially by Pb (14.8 ng/m3)>Mn (10.4 ng/m3)>Br (7.6 ng/m3)>Cu (5.4 ng/m3)>V (3.6 ng/m3). On the other hand, those of the 3 minor elements were as follows: Ba (2.3 ng/m3)>Ni (1.6 ng/ m3)>Cr (1.2 ng/m3).
According to a report from the Seoul Research Institute for Health and Environment (SRIHE) (Um et al., 2020), the NO3- in Seoul was 24% of the PM2.5 automobile exhaust source. In addition, SO42- accounted for 14%, NH4+ 12%, OC 16%, and EC 12%. All the other inorganic elements accounted for only 2% of PM2.5. Thus, they reported that all the measured species including ions, EC/OC, and elements accounted for 85% of PM2.5 mass. As PM2.5 mass increased, the mass ratio of ion species showed a tendency to increase in general.
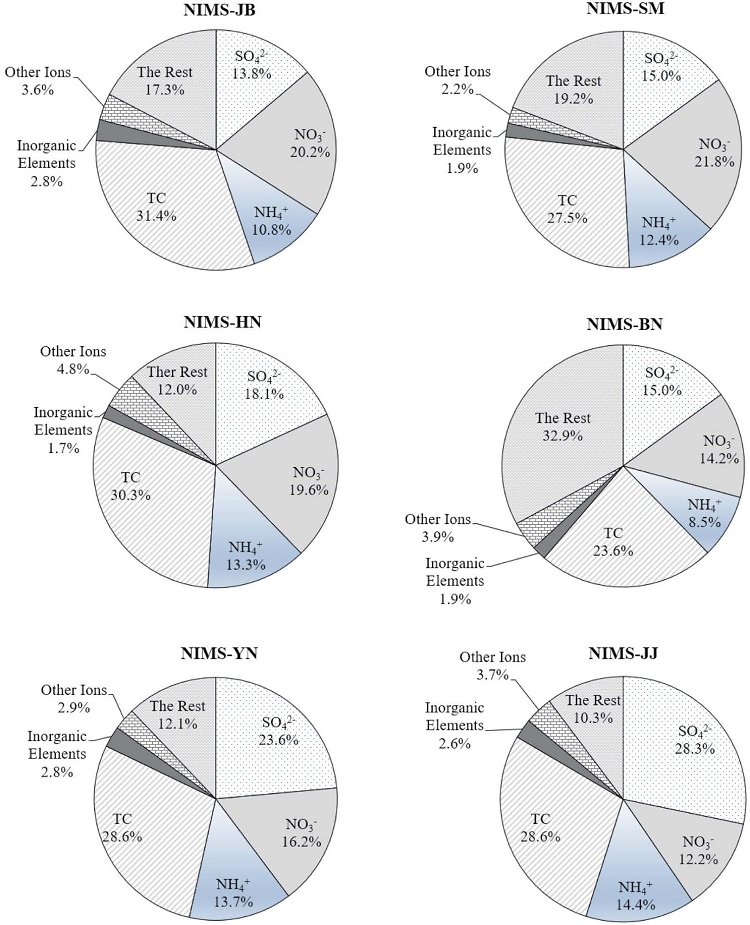
Carbon components are usually classified as OC and EC. Since OC detected only carbon by our analytical method, some elements such as O, H, and S bound to carbon were excluded during component analysis. When estimating organic matter (OM), a reasonable constant is often multiplied by OC to make up for unmeasured chemicals in PM2.5. Um et al. (2020) used 1.8 as an appropriate constant in Seoul city, and then they estimated carbon component such that OM=1.8×OC, and then TC (total carbon)=OM+EC=1.8×OC+EC. After using the constant in 2018, a result showed that TC in Seoul accounted for 32% of PM2.5 compared to the initial 28% (i.e., 16% of OC plus 12% of EC). Fig. 9 shows average chemical compositions in PM2.5 at each NIMS for 24 chemical species after converting OM into 1.8×OC from data monitored hourly in 2018.
On the other hand, Chen and Yu (2007) reported that a value of 2.3±0.3 was applicable to convert OC to OM in Hong Kong. A OM/OC ratio of 2.2 was applicable to continental air mass, and 1.9 was applicable to marine air mass. However, Cheng et al. (2016) used 1.4 in many global megacities, and they used the equation OM=1.4×OC. They also estimated a soil component such that Soil=2.2Al+2.49Si+1.63Ca+2.42Fe+1.94Ti. Further, they estimated the unidentified chemical portion of PM2.5 such that unidentified portion=PM2.5-OM-EC-SNA-Soil, where SNA stands for SO42-, NO3-, and NH4+. They noted that the average chemical composition of PM2.5 in 38 mega cities around the world in 2013 was: OM of 30±8%, EC of 7±4%, SNA of 36±10%, and soil 10±5%. Unidentified fractions were 19±12%. In their study, the unidentified (i.e., unmeasured) fractions of major cities were LA 11% (PM2.5 16.2 μg/m3), New York 14% (PM2.5 9.1 μg/m3), London 41% (PM2.5 22.4 μg/m3), Paris 20% (PM2.5 19.8 μg/m3), Beijing 18% (PM2.5 87.0 μg/m3), Tianjin 28% (PM2.5 95.7 μg/m3), X’ian 15% (PM2.5 102.2 μg/m3), and Delhi 18% (PM2.5 143.0 μg/m3). According to the results of other studies, the unidentified fractions in PM2.5 were 5% in Beijing and 9.7% in Tianjin from 2014 to 2015 (Huang et al., 2017), and 14.6% in Luoyang from 2019 to 2020 (Xu et al., 2021), Qatar’s Doha from May to Dec 2015 was estimated to be 20.3% (Javed et al., 2021).
Back to our study in Korea, we multiplied OC by a constant of 1.8 as suggested by Um et al. (2020). The average TC at all 6 sites accounted for 28.3% of PM2.5 with a range of 23.6% at NIMS-BN to 31.4% at NIMS-JB, as shown in Table S2. Thus, the TC in a medium-sized urban area was much higher than those in a marine area and even in large urban and industrial areas. It seemed that the latter areas were better controlled than the former area in terms of combustion activities of fossil fuels. In addition, the measured fractions of PM2.5 for 24 species were in the range of 67.1% at NIMS-BN to 89.7% at NIMS-JJ with a mean of 82.7% for all 6 sites. Both sites showing minimum and maximum values were in the same marine environment even though both sites showed much lower PM2.5 levels than inland sites. We wondered what kinds of unidentified components accounted for 32.9% of PM2.5 mass at NIMS-BN, far exceeding the other 5 sites’ average of 14.2%. According to Almeida et al. (2006), the unmeasured fraction in PM2.5 might be partly due to the presence of water associated with PM and errors in the estimation of chemical species. In addition, Tsai and Kuo (2005) reported that water content in PM2.5 was higher in coastal areas than in urban areas. Further, it was higher in spring than in winter and higher at night than in the daytime. Many other earlier studies focused on water content and hygroscopic growth of PM under ambient conditions (Ueda et al., 2000; Meng et al., 1995a). Generally, when RH was high, hygroscopic components like NH4NO3 in PM took up water from the atmosphere so that particles might gain mass several times their dry weight, and then PM2.5 might contain water as an unidentified component under very humid conditions (Kajino et al., 2006). Perrino et al. (2016) insisted that water content in PM was roughly proportional to the soil content from long-range transported desert dust (about 5%), but dust did not contribute to water content. They also argued that the water content under winter stability conditions was dependent on NH4NO3 and constituted up to 22% of the total PM10.
For reference during the study year 2018, the NIMS-BN on site had an annual average F/C ratio of 0.51, a temperature of 6.1°C, precipitation of 831.1 mm/yr, a WS of 4.3 m/s, a WD of 227.0°, and a RH of 67.9%. However, the NIMS-JJ site had a F/C ratio of 0.47, a temperature of 14.5°C, precipitation of 1,345.8 mm/yr, WS of 3.1 m/s, WD of 194.4°, and RH of 68.6%. Also, Asian yellow dust events occurred 7 times in 2018 at NIMS-BN, but none occurred at NIMS-JJ (KMA, 2021). The NIMS-BN environment was colder, showed much less precipitation, and much faster WS than the other 5 sites. Thus, probable reasons for the smallest unidentified fraction at NIMS-BN were: 1) more water content due to a humid marine environment as well as frequent Asian dust occurrences, 2) colder weather condition below zero to facilitate water binding and building up more hygroscopic NH4NO3 in winter, and 3) unaccounted species from China and nearby North Korea with fastest WS compared to the other sites.
4. CONCLUSIONS
The chemical compositions and their mass ratios in PM2.5 are particularly important in fundamental studies on identifying and determining PM2.5 emission sources. For this study, the PM was monitored hourly for 6 years at 6 different environmental areas (urban/agricultural/industrial/marine areas) in Korea. PM2.5 levels in Korea far exceeded the 2021 WHO guidelines and slightly exceeded the 2018 Korean NAAQS. When classifying PM2.5 samples into 5 classes of air quality conditions, we observed that 45.0% of all datasets were assorted in the good class. It was found that PM10 and PM2.5 were negatively correlated with WS; however, PM was influenced by wind direction rather than wind speed in certain areas. Since annual PM2.5 concentration steadily decreased nationwide, each species was also decreased. One of the reasons for decreasing PM10 and PM2.5 might be caused by changes in citizens’ awareness of PM due to enforcement of various laws and policies in Korea. In addition, it was found that the PM2.5 concentration in China decreased by more than 50% during the same period, which is considered to be an important external factor in the reduction of PM2.5 in Korea. The chemical mass ratio of PM2.5 significantly changed based on area. For example, at NIMS-SM in the metropolitan area, the mass ratio of SO42- decreased from 0.214 in 2013 to 0.122 in 2018. However, NO3- increased slightly from 0.236 to 0.249, and OC increased from 0.098 to 0.131. At NIMS-HN in an agricultural area from 2013 to 2018, NO3- increased from 0.131 to 0.204, NH4+ and OC increased slightly from 0.127 to 0.136. On the other hand, at NIMS-BN in the western marine area, SO42- decreased from 0.185 to 0.153, and NO3- greatly increased from 0.081 to 0.137. The elements were higher in industrial/urban areas than in agricultural areas. In addition, the average TC for 6 sites was 28.3% of PM2.5. The TC in a medium-sized urban area was much higher than those in marine areas or even in large populated urban areas and industrial areas. It seemed to be that the latter areas were better controlled than the former area in terms of combustion activities of fossil fuels.
The chemical species in PM2.5 such as various ions, carbons, and elements provide fundamental information to help qualitatively identify emission sources, quantitively determining the sources, suitably managing PM action plans, and reasonably establishing government policies. For the efficient control and management of air pollutants and to establish a reasonable air environment policy, it is necessary to present and implement fine dust management measures and countermeasures that match the circumstances of each local government. It is considered that the concentration trend analysis of PM2.5 and chemical components in six regions in Korea can serve as an important basic data for each region’s air pollutant emission reduction and management plan.
Acknowledgments
This work was partly supported by the National Research Foundation of Korea funded by the Korea Government (MSIT, MOE) (No. 2019M3E7A1113077). We are deeply grateful to the National Institute of Environmental Research (NIER) in MOE for providing us valuable raw datasets monitored at the 6 National Intensive Monitoring Sites in Korea. Although this work was assisted by the NIER, it has not been subjected to agency reviews and does not necessarily reflect their policies and views.
References
-
Almeida, S.M., Pio, C.A., Freitas, M.C., Reis, M.A., Trancoso, M.A. (2006) Approaching PM2.5 and PM2.5-10 source apportionment by mass balance analysis, principal component analysis and particle size distribution. Science of The Total Environment, 368(2-3), 663-674.
[https://doi.org/10.1016/j.scitotenv.2006.03.031]

-
Chen, X., Yu, J.Z. (2007) Measurement of organic mass to organic carbon ratio in ambient aerosol samples using a gravimetric technique in combination with chemical analysis. Atmospheric Environment, 41, 8857-8864.
[https://doi.org/10.1016/j.atmosenv.2007.08.023]

-
Cheng, Z., Luo, L., Wang, S., Wang, Y., Sharma, S., Shimadera, H., Wang, X., Bressi, M., Miranda, R.M., Jiang, J., Zhou, W., Fajardo, O., Yan, N., Hao, J. (2016) Status and characteristics of ambient PM2.5 pollution in global megacities. Environmental International, 89-90, 212-221.
[https://doi.org/10.1016/j.envint.2016.02.003]

- Dockery, D.W., Stone, P.H. (2007) Cardiovascular risks from fine particulate air pollution. The New England Journal of Medicine, 356, 511-513. https://www.nejm.org/doi/pdf/10.1056/NEJMe068274, .
- EEA (European Environment Agency) (2020) Air Quality in Europe-2020 Report, European Environment Agency Report No. 09/2020, 30-36. https://op.europa.eu/en/publication-detail/-/publication/447035cd-344e-11eb-b27b-01aa75ed71a1/language-en, .
- EPA (U.S. Environmental Protection Agency) (1999) Air Quality Criteria for Particulate Matter, Vol.1, EPA600/P-99/002a.
- EPA (U.S. Environmental Protection Agency) (2021) Air Pollutant Emissions Trends Data: Criteria Pollutants National Tier 1 for 1970-2020. https://www.epa.gov/air-emissions-inventories/air-pollutant-emissions-trends-data, .
-
Ham, J.Y., Lee, H.J., Cha, J.W., Ryoo, S.B. (2017) Potential source of PM10, PM2.5 and OC and EC in Seoul during spring 2016. Atmosphere Korean Meteorological Society, 27(1), 41-54.
[https://doi.org/10.14191/Atmos.2017.27.1.041]

- Hodan, W.M., Barnard, W. (2004) Evaluating the contribution of PM2.5 precursor gases and re-entrained road emission to mobile source PM2.5 particulate matter emissions. Environmental Science. https://api.semanticscholar.org/CorpusID:28139041, .
- Hopke, P.K. (1985) Receptor Modeling in Environmental Chemistry. John Wiley & Sons Inc., New York, pp. 210-224.
-
Huang, X., Liu, Z., Liu, J., Hu, B., Wen, T., Tang, G., Zhang, J., Wu, F., Ji, D., Wang, L., Wang, Y. (2017) Chemical characterization and source identification of PM2.5 at multiple sites in the Beijing-Tianjin-Hebei region, China. Atmospheric Chemistry and Physics, 17, 12941-12962.
[https://doi.org/10.5194/acp-17-12941-2017]

-
Im, D.Y., Lee, T.J., Jo, Y.M., Kim, D.S. (2021) Temporal analyses of PM data, estimation of the past unmonitored PM2.5 data and assessment of the COVID-19 effect at the background areas in Korea. Journal of Korean Society for Atmospheric Environment, 37(4), 670-690.
[https://doi.org/10.5572/KOSAE.20212.37.4.670]

-
Javed, W., Guo, B. (2021) Chemical characterization and source apportionment of fine and coarse atmospheric particulate matter in Doha, Qatar. Atmospheric Pollution Research, 12(2), 122-136.
[https://doi.org/10.1016/j.apr.2020.10.015]

-
Jo, G.G., Kim, D.W., Song, M.J. (2018) PM2.5 concentrations and chemical compositions in Jeonju from 2017 to 2018. Journal of Korean Society for Atmospheric Environment, 34(6), 876-888.
[https://doi.org/10.5572/KOSAE.2018.34.6.876]

-
Kajino, M., Winiwarter, W., Ueda, H. (2006) Modeling retained water content in measured aerosol mass. Atmospheric Environment, 40(27), 5202-5213.
[https://doi.org/10.1016/j.atmosenv.2006.04.016]

-
Kang, C.M., Lee, H.S., Kang, B.W., Lee, S.W., Sunwoo, Y. (2004) Chemical characteristics of acidic gas pollutants and PM2.5 species during hazy episodes in Seoul, South Korea. Atmospheric Environment, 38(28), 4749-4760.
[https://doi.org/10.1016/j.atmosenv.2004.05.007]

-
Kim, D.S. (2013) Air pollution history, regulatory changes and remedial measures of the current regulatory regimes in Korea. Journal of Korean Society for Atmospheric Environment, 29(4), 353-368.
[https://doi.org/10.5572/KOSAE.2013.29.4.353]

-
Kim, J.S., Hong, S.M., Kim, M.S., Kim, Y.Y., Shin, E.S. (2014) Distribution characteristics of PM10 and heavy metals in ambient air of Gyeonggi-do area using statistical analysis. Journal of Korean Society for Atmospheric Environment, 30(3), 281-290.
[https://doi.org/10.5572/KOSAE.2014.30.3.281]

-
Kim, J.A., Lim, S.H., Shang, X., Lee, M.H., Kang, K.S., Ghim, Y.S. (2020) Characteristics of PM2.5 chemical composition and high-concentration episodes observed in Jeju from 2013 to 2016. Journal of Korean Society for Atmospheric Environment, 36(3), 388-403.
[https://doi.org/10.5572/KOSAE.2020.36.3.388]

- KMA (Korea Meteorological Administration) (2021) Open Met Data Portal. Korea Meteorological Administration. https://data.kma.go.kr/resources/html/en/aowdp.html, .
- Kondratyev, K.Y., Ivlev, L.S., Krapivin, V.F., Varotsos, C.A. (2006) Atmospheric Aerosol Properties, Springer, 222-227.
- KOSAE (Korean Society for Atmospheric Environment) (2018) Atmospheric Environment. Korean Society for Atmospheric Environment. DongHwa Technology Publishing Co. ISBN: 978-89-425-9152-7. pp. 87-138.
-
Matawie, J.L., Pervez, S., Dewangan, S., Shrivastava, A., Tiwari, S., Pant, P., Deb, M.K., Pervez, Y. (2015) Characterization of PM2.5 source profiles for traffic and dust sources in Raipur, India. Aerosol and Air Quality Research, 15(7), 2537-2546.
[https://doi.org/10.4209/aaqr.2015.04.0222]

- McMurry, P.H., Shepherd, M.F., Vickery, J.S. (2004) Particulate Matter Science for Policy Makers: A NARSTO Assessment. Cambridge University Press. USA. ISBN 0 521 84287 5. pp.10-9113, 235-271.
-
Meng, Z., Seinfeld, J.H., Saxena, P., Kim, Y.P. (1995) Contribution of water to particulate mass in the south coast air basin. Aerosol Science and Technology, 22, 111-123.
[https://doi.org/10.1080/02786829408959731]

- MOE (Ministry of Environment) (2018) Ministry of Environment press release to strengthen the PM2.5 standard to the level of the US and Japan. http://www.me.go.kr/home/web/board/read.do?menuId=286&boardMasterId=1&boardCategoryId=39&boardId=849570, .
- MOE (Ministry of Environment) (2019a) Ministry of Environment press release of the special act on particulate matter on February 15th. http://www.me.go.kr/home/web/board/read.do?menuId=286&boardMasterId=1&boardCategoryId=39&boardId=939205, .
- MOE (Ministry of Environment) (2019b) Comprehensive Plan for Particulate Matter (2020-2024). Ministry of Environment jointly with related Ministries on Nov. 1, 2019. http://www.me.go.kr/home/web/policy_data/read.do?menuId=10262&seq=7399, .
- MOE (Ministry of Environment) (2019c) Ministry of Environment press release of the opening of the National Intensive Monitoring Site in Gyeonggi-do. http://me.go.kr/home/web/board/read.do;jsessionid=GWrjXjkcJGXyxQHo0B4ur13m.mehome1?pagerOffset=40&maxPageItems=10&maxIndexPages=10&searchKey=&searchValue=&menuId=&orgCd=&boardId=991205&boardMasterId=1&boardCategoryId=39&decorator=, .
- MOE (Ministry of Environment) (2020a) Annual Report of Air Quality in Korea. Korean Ministry of Environment. https://library.me.go.kr/#/search/detail/5700339?offset=5, .
- MOE (Ministry of Environment) (2020b) 2017 National Air Pollution Emission. National Air Emission Inventory and Research Center Administrative Publication Registration Number 11-1481019-000001-10. National Statistical Approval Number 106033. http://airemiss.nier.go.kr/user/boardList.do?command=view&boardId=74&boardSeq=579&id=airemiss_040100000000&siteId=airemiss.
- NAEIR (National Air Emission Inventory and Research Center) (2019) 2018 Clean Air Policy Support System (CAPSS). https://air.go.kr/jbmd/sub43.do?tabPage=4, .
- NIER (National Institute of Environmental Research) (2019) Air Pollution Measurement Network Installation and Operation Guidelines. National Institute of Environmental Research. Administrative Publication Registration Number 11-1480523-003560-14. NIER-GP2019-004. https://ecolibrary.me.go.kr/nier/#/search/detail/5671447, .
-
Pachauri, T., Singla, V., Satsangi, A., Lakhani, A., Kumari, K.M. (2013) Characterization of carbonaceous aerosols with special reference to episodic events at Agra, India. Atmospheric Environment, 128, 98-110.
[https://doi.org/10.1016/j.atmosres.2013.03.010]

-
Park, J.S., Ryoo, J.Y., Jee, J.B., Song, M.J. (2020) Origins and distributions of atmospheric Ammonia in Jeonju during 2019-2020. Journal of Korean Society for Atmospheric Environment, 36(2), 262-274.
[https://doi.org/10.5572/KOSAE.2020.36.2.262]

-
Park, M.B., Lee, T.J., Lee, E.S., Kim, D.S. (2019) Enhancing source identification of hourly PM2.5 data in Seoul based on a dataset segmentation scheme by positive matrix factorization (PMF). Atmospheric Pollutant Research, 10(4), 1042-1059.
[https://doi.org/10.1016/j.apr.2019.01.013]

-
Perrino, C., Catrambone, M., Farao, C., Canepari, S. (2016) Assessing the contribution of water to the mass closure of PM10. Atmospheric Environment, 140, 555-564.
[https://doi.org/10.1016/j.atmosenv.2016.06.038]

- Seinfeld, J.H., Pandis, S.N. (2016) Atmospheric Chemistry and Physics from Air Pollution to Climate Change. John Wiley and Sons, New Jersey, USA.
- Statista (2022) Average annual PM2.5 air pollution levels in Beijing, China between 2011 and 2021. https://www.statista.com/statistics/690823/china-annual-pm25-particle-levels-beijing, /.
-
Tan, J., Duan, J., He, K., Ma, Y., Duan, F., Chen, Y., Fu, J. (2009) Chemical characteristics of PM2.5 during a typical haze episode in Guangzhou. Journal of Environmental Sciences, 21(6), 774-781.
[https://doi.org/10.1016/S1001-0742(08)62340-2]

-
Tsai, Y.I., Kuo, S.C. (2005) PM2.5 aerosol water content and chemical composition in a metropolitan and a coastal area in southern Taiwan. Atmospheric Environment, 39(27), 4827-4839.
[https://doi.org/10.1016/j.atmosenv.2005.04.024]

-
Ueda, H., Takemoto, T., Kim, Y.P., Sha, W. (2000) Behaviors of volatile inorganic components in urban aerosols. Atmospheric Environment, 34, 353-361.
[https://doi.org/10.1016/S1352-2310(99)00383-0]

- Um, J.H., Shin, J.H., Lee, M.H. (2020) Chemical Characteristics of Fine Dust (PM2.5) at Seoul in 2019. Seoul Institute of Health and Environment. ISBN 979-11-6599-098-5. https://cleanair.seoul.go.kr/board/download?fileType=FILE&bbsSeq=1089, .
- WHO (World Health Organization) (2013) Air Pollution and Cancer, IARC Scientific Publication No. 161. ISBN 978-92-832-2166-1. https://publications.iarc.fr/Book-And-Report-Series/Iarc-Scientific-Publications/Air-Pollution-And-Cancer-2013, .
- WHO (World Health Organization) (2021a) World Health Statistics 2021: Monitoring Health for the SDGs, Sustainable Development Goals. License: CC BY-NC-SA 3.0 IGO. https://apps.who.int/iris/handle/10665/342703, .
- WHO (World Health Organization) (2021b) What are the WHO air quality guidelines? World Health Organization. https://www.who.int/news-room/feature-stories/detail/what-are-the-who-air-quality-guidelines, .
-
Xu, M., Liu, Z., Hu, B., Yan, G., Zou, J., Zhao, S., Zhou, J., Liu, X., Zheng, X., Zhang, X., Cao, J., Guan, M., Lv., Y., Zhang, Y. (2021) Chemical characterization and source identification of PM2.5 in Luoyang after the clean air actions. Journal of Environmental Sciences, 115, 265-276.
[https://doi.org/10.1016/j.jes.2021.06.021]


