Emissions of Volatile Organic Compounds from Dairy Cattle Manure in a Cattle Shed in Japan
Abstract
The livestock industry is a major source of atmospheric volatile organic compounds (VOCs), but details on these emissions are not well documented in Japan. In particular, it remains unclear how the rearing method affects the emissions of VOCs from livestock, which originate primarily from feces and urine. Here we aimed to estimate the amounts of VOCs emitted from the feces and urine of tethered Holstein dairy cattle in a cattle shed in Japan. Dimethyl sulfide and acetone accounted for about 60% of the total VOCs emitted from feces, followed by formaldehyde and acetaldehyde. Also, dimethyl sulfide and acetone were the dominant VOCs emitted from urine, accounting for 90% of the total VOCs. The VOCs from manure were considered to be emitted between the excretion and removal of the manure during the cleaning of the shed. As a result of analyzing images from three cameras installed in the shed, the average time between excretion and cleaning during the daytime (8:00 am-5:00 pm) was 80 min for feces and urine, whereas at night (5:00 pm-7:00 am), the average time between excretion and cleaning was 480 min. Based on the above findings, the emissions of VOCs in the interval between excretion and cleaning of the shed were estimated. As a result, the emissions of VOCs from feces and urine per head of cattle in the shed were estimated to be 1.75 and 1.52 g day-1, respectively. Furthermore, contribution of VOCs emitted from manure to odor activity value (OAV) and hydroxyl radical reactivity (OHR) were also estimated. Volatile fatty acids and sulfur compounds emitted from feces estimated to have high contribution to OAV, whereas aldehydes contributed mainly for OHR from manure.
Keywords:
Volatile organic compounds, Dairy cattle, Manure, Chemical composition, Emission rate, Emissions1. INTRODUCTION
Volatile organic compounds (VOCs) are emitted from human activities, nature, and other sources, and these compounds contaminate the atmosphere. The annual emissions of VOCs in Japan in 2018 were estimated to be 641 Gg (Ministry of the Environment, Japan, 2020), and various emission sources such as paint, fuel, transportation, and the chemical and manufacturing industries have been identified as the dominant sources. In general, atmospheric VOCs are odorous (Ito, 2005). In addition, some VOCs in the atmosphere form photochemical oxidants (Ox) and secondary organic aerosol (SOA) via reaction with ozone and free radicals (Giganek et al., 2008). The achievement rate of environmental standards for Ox in Japan is less than 1% (Ministry of the Environment, Japan, 2020). In addition, the values for atmospheric organic carbon calculated by numerical models tend to be lower than the measured values (Fushimi et al., 2011). One of the reasons for this may be the existence of emission sources that are not taken into account in the models. One such source is the livestock industry. In fact, the annual average concentrations of non-methane hydrocarbons (NMHC) in the dairy area in Hokkaido and the area where poultry and pig farming are active in the northern Kanto region were almost the same as those in urban areas (National Institute for Environmental Studies). This suggests that the contribution of NMHC from livestock and agriculture to atmospheric concentrations was significant.
In the United States, it has been estimated that about 10% of atmospheric VOCs are derived from livestock farming (CDPR, 2006). Several reports on VOC emissions from the livestock industry have been published. Ni et al. (2012) reported that approximately 300 VOCs were detected and quantified in animal facilities. Alanis et al. (2010) reported that the feces and urine of swine were major source of volatile fatty acids (VFAs) in a swine shed. There are a number of reports concerning the VOCs emitted from swine manure. Parker et al. (2012) evaluated the volatilization of VOCs from swine manure in a chamber. They found that the emission rates (ERs) of the VOCs rapidly declined after land application and were below or near the detection limit within 4 to 8 h. Laor et al. (2007) reported that the amount and composition of VOCs emitted from the manure of dairy calves varied significantly with changes in feed content and rumen development as the calves grew.
VOCs emitted from livestock industry are one of the main sources of odor in the atmosphere around the world (e.g., Hwang et al., 2018; Orzi et al., 2010). Also, there are many complaints of odor caused by livestock industry in Japan (Ministry of Agriculture, Forestry and Fisheries, 2020). In addition, there have been several reports on the contribution of VOCs from livestock industry to oxidant production in the troposphere. Howard et al. (2010) estimated the ozone formation potential (OFP) of VOCs emitted from livestock industry in the San Joaquin Valley (SJV) of California. They reported that, livestock industry was accounted for 40% of OFP of small gasoline vehicles. Hu et al. (2012) estimated that the cumulative mass of 8-hour average ozone derived from VOCs from mobile sources and livestock feed at SJV for the period 2000-2020. They showed that the VOC emissions from mobile sources will produce less O3 in the future, making the VOC emissions from livestock feed more important.
There are only a few reports on emissions of VOCs from the livestock industry in Japan (Tanaka et al., 2020, 2019; Osaka et al., 2018). These studies estimated the VOC emissions from livestock sheds based on the VOC concentrations and amount of ventilation in the shed. The sources of VOC emissions from the livestock include feces, urine, and feed, as mentioned before. To ascertain the actual emissions of VOCs from manure, it is necessary to take into account the differences in the way manure is handled, which depends on the rearing method. Dairy cattle, one of the main livestock in Japan, can be classed into two types in terms of rearing method, namely, tethered rearing and grazing, with the former accounting for 90% of the total in Japan (Takahashi, 2018). For tethered dairy cattle, the periods of VOC emissions from feces and urine can be grouped into three main categories: (1) after excretion and before removal from the shed, (2) after transportation and during the composting process, and (3) after the compost is applied to fields. By contrast, in the case of grazing, the emissions of VOCs from feces and urine are considered to be basically confined to the pastureland. Therefore, in order to clarify the actual situation regarding VOC emissions from the manure of tethered dairy cattle, it is necessary to estimate emission amounts of VOCs at each stage. However, there is no report clarifying the details of the emissions of VOCs from the manure of tethered dairy cattle. In this context, the aim of present work is to estimate the amount of VOC emissions from the feces and urine of tethered dairy cattle in a cattle shed. In addition, odor and oxidant production will be discussed as environmental effects of VOCs emitted to the atmosphere from livestock industry, and the components that contribute to these effects will be clarified.
2. EXPERIMENTAL CONDITIONS
2. 1 Target Compounds
The target compounds were eight VFAs (acetic acid, propanoic acid, isobutyric acid, butyric acid, isovaleric acid, valeric acid, hexanoic acid, heptanoic acid), three phenols (phenol, p-cresol, 4-ethyl phenol), two indoles (indole, skatole), two sulfur compounds (dimethyl sulfide, dimethyl disulfide), eleven aldehydes (formaldehyde, acetaldehyde, acrolein, propionaldehyde, crotonaldehyde, methacrolein, n-butylaldehyde, benzaldehyde, valeraldehyde, m-tolualdehyde, hexaldehyde), five alcohols (methanol, ethanol, 1-butanol, 1-propanol, 2-butanol,), and three ketones (acetone, 2-butanone, 2-pentanone). These compounds are typically detected in livestock sheds (e.g., Alanis et al., 2010; Parker et al., 2012; Osaka et al., 2018).
2. 2 Sampling
Samples of feces and urine were collected from a cattle shed where Holstein dairy cattle were raised in a shed, at Asahi Agricultural High School (latitude 35°43ʹ00ʺN, longitude 140°39ʹ36ʺE) located in the northeast of Chiba Prefecture, Japan. The volume of the shed was 522.7 m3 (11.0 m width×14.4 m depth×3.3 m height). Holstein is major breed of dairy cattle raised in Japan. The amounts of feed per day and per head were as follows: alfalfa: 2 kg; bermudagrass: 4 kg; Italian ryegrass and Phleum pratense: a little; Miraku-yu70 (Marubeni Nissin Feed Co., Ltd): 2 kg/time×4 times; corn: 2 kg; corn silage: 2 kg. The manure was removed every 2 h during the day. Feces and urine were collected from the cattle shed on 13 March 2020, when the standard diet was fed and the temperature in the shed (17°C) was close to the annual average temperature (16°C) at Yokoshiba-hikari national weather station located 16 km WSW from the sampling point. Feces and urine were collected once from each of two lactating dairy cattle (average weight: about 650 kg). After measuring the weight of the collected manure, portions of the manure were placed in a polyethylene (PE) bag and a polypropylene (PP) bottle and sealed and then stored in a freezer at -20°C. Since the color and viscosity of the collected feces were almost uniform in appearance, it was assumed that the ingredients were also almost uniform, and a portion of the sample was fractionated without mixing. Freezing the manure samples would not likely alter the odorous compound flux (Hales et al., 2015; Miller et al., 2006). During the sampling campaign, three cameras were installed in the cattle shed. Photos were taken every 10 s to monitor the defecation behavior of the dairy cattle and worker activity.
2. 3 Evaluation of VOC Emissions from Manure
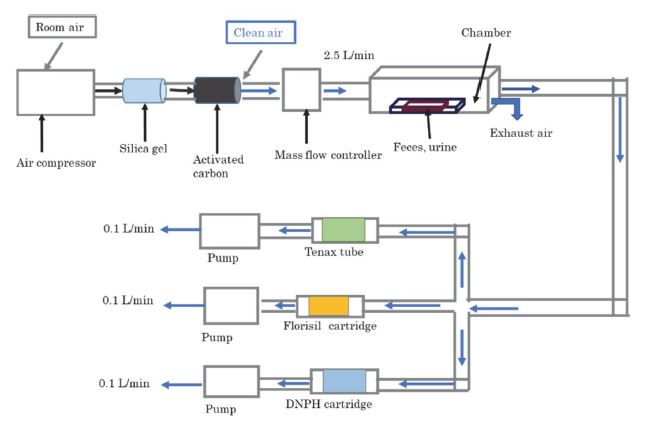
The VOC emissions from the manure were evaluated with reference to Parker et al. (2012). A schematic outlining the approach for evaluating of VOC emissions from manure is shown in Fig. 1. A known amount of feces and urine were placed on a tray in a stainless steel (SS) chamber (300 mm×68 mm×120 mm). Since dairy cattle feces contains a lot of water, it naturally becomes flat when it falls on the floor. Therefore, in this experiment, feces was flattened on a tray (5 cm×10 cm×1 cm) in the chamber to simulate the condition of feces falling on the floor. Chamber experiment was conducted at 22°C, which is 6°C higher than the annual average temperature (16°C) at the Yokoshiba-hikari national weather station near the sampling point in 2020. On the other hand, the temperature and humidity inside the shed tends to be higher than outside the shed, so the temperature condition in this experiment is considered to roughly simulate the annual average temperature inside the shed. Sorbent tubes filled with silica gel and activated carbon were installed upstream of the chamber, and the room air was passed through the tubes to remove moisture and organic compounds in the air. It was confirmed that the target VOCs were not detected in the air downstream the tube by GC/MS measurement. Clean air was flowed into the chamber at 2.5 L min-1, and the VOCs emitted from the feces and urine were collected downstream of the chamber. The linear velocity of clean air in the chamber was 0.11 cm s-1, which is considered close to the shed environment where there is usually little wind. Since the volume of the chamber was about 2.5 L, ventilation rate at 2.5 L min-1 corresponds to 60 times h-1 of ventilation times. Note that the average ventilation rate in the shed calculated using temperature and humidity data inside and outside the shed on the day of manure collection, referring to Tanaka et al. (2019), was 104 times h-1, so the ventilation rate in this experiment roughly simulates that in the shed. The VFAs, alcohols, indoles, sulfur compounds, phenols, and 2-pentanone were collected using a SS tube filled with Tenax TA sorbent (3.5 inch×1/4 inch OD, 60/80, COMSCO). Prior to sample collection, all the sampling tubes were conditioned by flowing a stream of pure nitrogen gas at a flow rate of 50 mL min-1 for 60 min at 300°C. Sampled air was pulled through the sorbent tube at a flow rate of 0.1 L min-1 for 10 min with a sampling pump (MP-Σ30NII, Shibata Scientific Technology). After sampling, the sorbent tubes were sealed at both ends with SS caps and put into an aluminum bag with a zipper and kept in a freezer at -20°C. Aldehydes and ketones except 2-pentanone were collected with two cartridges containing 2,4-dinotrophenylhydrazine (DNPH) as a derivatizing agent (InertSep mini AERO DNPH-LG, GL Sciences). An ozone scrubber cartridge (InertSep mini AERO Ozone Scrubber, GL Sciences) was connected upstream of the two DNPH cartridges. The sampled air was flowed through the cartridges at a flow rate of 0.1 L min-1. After sampling, the cartridges were sealed at both ends with caps and put into an aluminum bag with a zipper and kept in a freezer at -20°C. Methanol and ethanol were collected with a cartridge filled with silica gel and magnesium oxide (Presep-C Florisil, Fujifilm Wako Pure Chemicals). The sampled air was flowed through the cartridge at a flow rate of 0.1 L min-1. After sampling, the cartridge was sealed at both ends with caps and put into an aluminum bag with a zipper and kept in a freezer at -20°C. After the feces and urine was placed in the chamber, the samples were collected four times over the period between 3-483 min. Each sampling procedure was carried out for 10 min for compounds collected with the Tenax tube and the Florisil cartridge and for 50 min for compounds collected with the DNPH cartridges.
2. 4 Analytical Procedures
The samples were pretreated and analyzed as described by Osaka et al. (2018). The standards for the target compounds and the reagents for pretreatment were special grade, dioxane grade, or HPLC grade reagents (Fujifilm Wako Pure Chemicals, Kanto Chemical or Sigma-Aldrich). The VOCs collected with Tenax tubes were analyzed by gas chromatography-mass spectrometry (GC/MS) equipped with a thermal desorption injector (TD-GC/MS; GCMS-QP2020 and TD-20, Shimadzu Corporation). Analytical condition of TD-GC/MS was shown in Table 1. The aldehydes and ketones collected by the DNPH cartridge were processed before analysis. A strong cation exchange resin (InertSep mini AERO SC, GL Sciences) was conditioned with 5 mL of acetonitrile, 5 mL of purified (ion-exchange) water, 20 mL of 0.1 M hydrochloric acid solution, 20 mL of purified (ionexchange) water, and 5 mL of acetonitrile. After conditioning, the strong cation exchange cartridge was connected downstream of the DNPH cartridge and the DNPH derivatives were eluted with 5 mL acetonitrile at a flow rate of 1 mL min-1. The eluate was concentrated, and the volume was adjusted to 1 mL with acetonitrile. The samples were analyzed by high-performance liquid chromatography (HPLC). Analytical condition pf HPLC was shown in Table 2. Methanol and ethanol collected by the Florisil cartridge were processed before analysis. 3 mL of purified water were added to the Florisil cartridge to extract the methanol and ethanol. The eluate was analyzed by GC/MS (GCMS-QP2020, Shimadzu Corporation). Analytical condition of methanol and ethanol by GC/MS was shown in Table 3.
2. 5 Estimation of VOC Emissions from Feces and Urine of Dairy Cattle
The ERs of VOCs from manure were estimated using the following procedure. From the results of the chamber experiment (see section 2.3), the amount of component i of the VOCs emitted from the manure at sampling time tn to tn+1 (=Tn), Mi,Tn (μg), can be expressed as follows:
| (1) |
Here, Ci,Tn (μg) is the amount of component i collected in the sampling tube during Tn, VTn (L min-1) is ventilation rate in the chamber during Tn, Vx, Tn (L min-1) is the flow rate for sample collection during Tn. The ER of component i during Tn (ERi,Tn, in μg min-1 g-feces or urine-1) from the manure is expressed as
| (2) |
Where n (g) is amount of feces or urine used in the chamber experiment. Based on the calculation described above, the emission of component i from the feces or urine in the shed was estimated as follows:
| (3) |
Here, Ei (μg g-1) is total emission of component i from 1 g of feces or urine, x is the average time between excretion (=0) and removal by cleaning of the shed, ERi,Tn (t) is a function for the approximation curve describing the relationship between the ER of component i and time, and can be obtained from the above calculation. Based on the analysis of the camera images, the values for x were estimated as 80 min during the day, and 400 min at night (see section 3.3).
The emission of component i from the manure per head of cattle in the daytime in the shed (Ei,daytime, in μg head-1) is expressed as
| (4) |
Where N (g times-1) is average amount of feces or urine per unit time, Tdaytime (times head-1) is the number of excretions per head in the daytime. Similarly, the emission of component i from the manure per head of cattle in the nighttime in the shed (Ei,night, in μg head-1) can be expressed as
| (5) |
Where Tnight (times head-1) is number of excretions per head in the nighttime. Finally, the emission of component i from the manure per day per head (Ei,day) of cattle can be expressed as follows:
| (6) |
The daily emissions of total VOCs from the manure per head in the shed (E) is the sum of the emissions of each VOC. The VOC emissions during the time period when sampling was not conducted were supplemented by an approximate equation between time and VOC emissions obtained from the experiment. Note that, the total amount of the emission characteristics of VOCs from excrements depends on a variety of factors, including feed, bred, and life stages of the cattle (Laor et al., 2007).
2. 6 Evaluation of the Contribution of VOCs Emitted from Dairy Cattle Manure to Odor
Odor activity value (OAV) was used as an evaluation index for odor. OAV of compound i (OAVi) can be expressed as follows.
| (7) |
Here, Ci (μg/m3) is concentration of compound iOTVi (μg/m3) is odor threshold of compound i. In order to evaluate the relative contribution of VOCs emitted from manure to OAV in this study, Ci was determined by dividing the total emission of i from manure by 1 m3. Hence, it is important to note that the absolute value of OAV calculated in this study is not meaningful. OTV of each VOC used the value reported by Nagata et al. (2003).
Ci(μg/m3) can be expressed as follows.
| (8) |
Here, Ei,day is emission of i from manure per day per head as shown in (6), ndairy cattle is head of dairy cattle in the shed, and V (m3) is 1 m3.
2. 7 Evaluation of the Contribution of VOCs Emitted from Dairy Cattle Manure to Hydroxyl Radical Reactivity
Hydroxyl radical (OH) reactivity (OHR) was used as an evaluation index for oxidant formation ability of VOCs. OHR of compound i (OHRi) can be expressed as follows (Atkinson et al., 2006).
| (9) |
Here, Ci (mol/m3) is concentration of compound i, Ki (m3 mol-1 s-1) is reaction rate constant of the compound i with OH. In order to evaluate the relative contribution of VOCs emitted from manure to OHR in this study, Ci was determined by dividing the total emission of i from manure by 1 m3. Hence, note that the absolute value of OHR calculated in this study is not meaningful.
3. RESULTS AND DISCUSSION
3. 1 Composition of the Emissions of VOCs from Feces and Urine
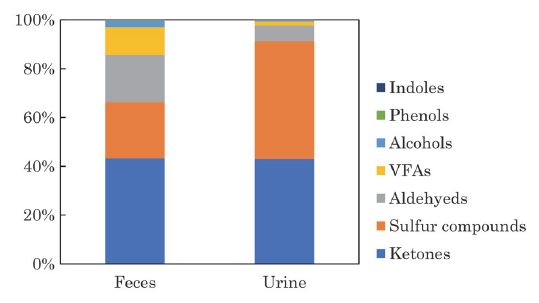
Composition of VOCs average distribution of each sample from feces and urine is shown in Fig. 2 (n=2). Sulfur compounds and ketones accounted for about 60% of the total VOCs emitted from feces, followed by aldehydes. Sulfur compounds and ketones were the dominant VOCs emitted from urine and accounted for 90% of the total VOCs. Hales et al. (2015) reported that VFAs such as acetic acid and propanoic acid were the major compounds emitted from the manure of Jersey cattle. Shaw et al. (2007) reported that methanol, ethanol, and acetone were the predominant VOCs emitted from the manure of Holstein cattle. These differences in composition are thought to be influenced by the feed, breed, and life stage of the cattle. Hales et al. (2015) compared the fluxes of the VOCs emitted from the manure of cattle fed conventional livestock diets: steam-flaked corn (SFC), and dry-rolled corn (DRC). Hales et al. found that the total flux (μg m-2 min-1) for 13 VOCs, such as phenols and VFAs emitted from the manure was 2.1 times higher for cattle fed DRC compared with SFC. Shaw et al. (2007) also compared the fluxes of manure from milking cows at different growth stages and reported that the flux of methanol was about 3 times higher than that of far-off cows. In contrast, manure was collected from lactating dairy cattle in this study. Therefore, the difference in the composition of VOCs emitted from the manure in the present study compared with previous reports may be due to the differences in feed, type of livestock, and growth stage of the cows.
3. 2 ERs of VOCs from Manure
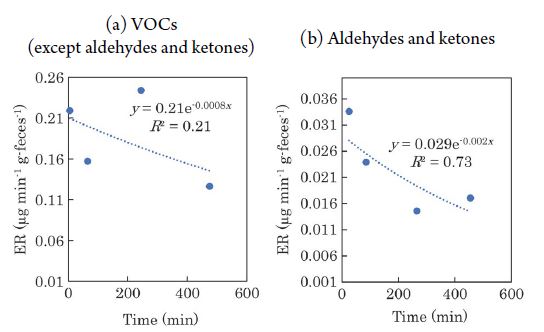
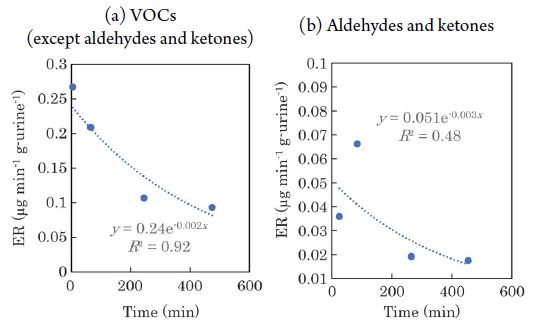
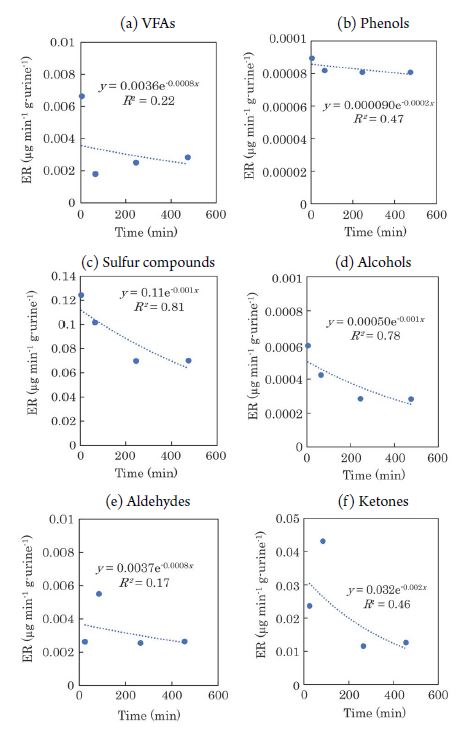
The temporal variation in the ERs of VOCs from feces is shown in Fig. 3. 2-pentanone is not shown in the figure because it had a minimal effect on the ERs. The ERs of aldehydes and ketones decreased over time (VOCs except aldehydes and ketones: y=0.21e-0.0008x, R2=0.21; aldehydes and ketones: y=2.9×10⁻²e-0.002x, R2=0.73; x: time from excretion (min), y: ER (μg min-1 g-1)). The temporal variation in the ERs of VOCs from urine is shown in Fig. 4. It can be seen that the ERs of the VOCs tended to decrease rapidly with time, with the exception of some compounds such as VFAs. Lee et al. (2003) mentioned that VOC emissions from varnish were fitted using a first order decay model, instead of a double-exponential model previously used (Guo and Murray, 2000a; Guo et al., 2000b). They reported that comparatively reliable estimates of emission parameters when VOC emissions from indoor materials were mainly controlled by evaporation. Parker et al. (2012) also reported that an exponential decrease in VOCs emissions from manure. Based on the above, we assumed that the emissions of VOCs from manure also decrease exponentially with time, and approximated it as an exponential function. The regression equations are as follows; VOCs except aldehydes and ketones: y=0.24e-0.002x, R2=0.92; aldehydes and ketones: y=0.051e-0.003x, R2=0.48. Indoles and 2-pentanone were not detected from urine. A tendency of the ERs from feces to decrease over time was observed by Hales et al. (2015), and the results of this study are consistent with those previous results. The temporal variation in the ERs of each chemical compound emitted from feces and urine is shown in Fig. 5 and Fig. 6, respectively. Fig. 5 shows that the ERs for alcohols, ketones, and phenols tended to decrease over time. The ERs of sulfur compounds and aldehydes, on the other hand, were almost constant over time. Furthermore, the ERs of VFAs and indoles tended to increase with time. As shown in Fig. 6, the ERs of alcohols, ketones, phenols, and sulfur compounds from urine tended to decrease with time. In contrast, for VFAs and aldehydes, there was no clear correlation between the elapsed time and the ERs. The trends of temporal variation in the ERs differed according to the class of chemical compound. This may reflect the differences in the saturation vapor pressure of each VOC. For example, VFAs, which showed a tendency of increasing ERs with time, had low saturation vapor pressure (saturation vapor pressure of the target VFAs at 20°C: 0.23-15.2 hPa), whereas ketones, those ERs decreased with time, had high saturation vapor pressure (saturation vapor pressure of target ketones at 20°C: 103-239.5 hPa). In addition, urine is by nature liquid, while feces consist of solids and liquid. These differences in phase may affect the volatility characteristics of the VOCs. In fact, the ERs of VOCs from swine manure, such as phenols, indoles, and sulfur compounds decayed over time, whereas that of the eight VFAs exhibited high variability (Parker et al., 2012). Thus, although the ERs may not decay monotonically with time for some components, the overall trend was that the ERs of VOCs tended to decline as time elapsed. In addition, during the composting process of dairy cattle manure, anaerobic microorganisms such as Methanothrix and Acetobacter in the manure decompose the easily degradable organic matter (Yokoyama, 2009). Although composting is generally carried out mainly at 50-60°C, useful fermenting microorganisms such as acetic acid bacteria generally prefer at 15-25°C (Matsushita, 2010). This temperature range is comparable to the temperature (20-25°C) at which the chamber experiment in this study was conducted. As shown in Fig. 5(a), the increased ERs of VFAs over time from the feces may be due to the production of VFAs by the microorganisms in the feces.
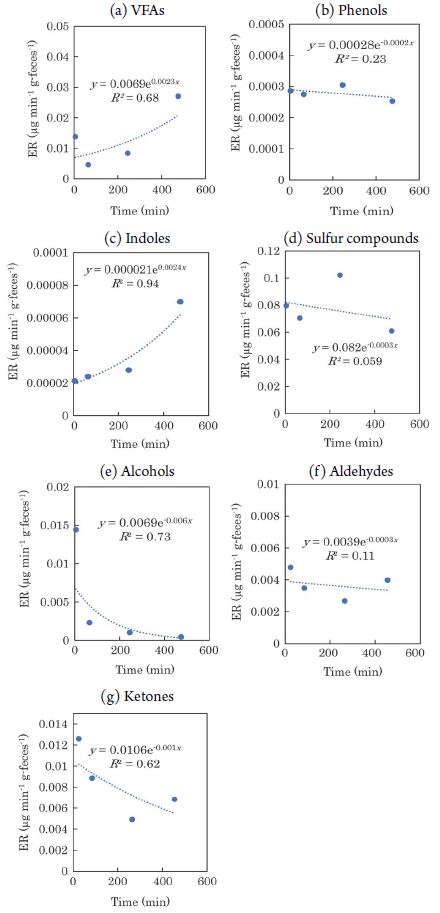
Temporal variation in ERs of each chemical class emitted from feces. (a) VFAs, (b) Phenols, (c) Indoles, (d) Sulfur compounds, (e) Alcohols, (f) Aldehydes, (g) Ketones.
3. 3 Estimation of VOC Emissions from Manure in a Dairy Cattle Shed
Based on the results described above, the VOC emissions from feces and urine in the cattle shed were estimated. The dairy cattle shed targeted in this study had a tethered system and excrement was regularly removed from the shed. Thus, the VOCs emitted from the manure were considered to be emitted between excretion and cleaning of the shed. As a result of analyzing the images of the three cameras which were installed in the shed, the average time between excretion and cleaning during the daytime (8:00 am-5:00 pm) was 80 min for feces and urine. At night (5:00 pm-7:00 am), when the staff were not available and cleaning was not performed, the average time between excretion and cleaning was 480 min for both feces and urine. In other words, the VOCs derived from excretion in the shed during the daytime and nighttime can be considered to be emitted on average for time durations of 80 and 480 min, respectively. Therefore, by integrating the approximation equation specified integrating as shown in (3) with respect to the average time between excretion and cleaning, the amount of VOC emissions originating from excretions in the shed during the day and at night can be estimated. First, the data for the emissions of the VOCs from 1 g of feces and urine for one dairy cow are shown in Tables 4, 5. The VOC emissions were calculated as 1.63×10⁻⁵ g (g-feces)-1 and 2.90×10⁻⁵ g (g-urine)-1 during the daytime. At nighttime, the emissions of the VOCs from the feces and urine were 6.96×10⁻⁵ g g-1 and 1.30×10⁻⁴ g g-1, respectively. For both feces and urine, sulfur compounds and ketones accounted for 60-90% of the total VOCs, followed by aldehydes. Table 4 indicates that the composition of VOCs emitted from the feces is different during the daytime and at night. For example, the percentage of VFAs and indoles that tended to have higher ERs over time was relatively high. This is because the ERs of VFAs and indoles from the feces increased with time, while the ERs of aldehydes and ketones tended to decrease. On the other hand, Table 5 shows that the composition of VOCs emitted from urine was almost the same during the daytime and night. This is because the ERs of most compounds from urine decreased with time as shown in Fig. 6. From Fig. 6, we can see that the ERs of sulfur compounds did not decay much with time compared to the other compounds, whereas the ERs of ketones decayed with time after excretion. In other words, when the excrement was left for a relatively long time, such as overnight, the composition of each component changed over time. In contrast, the ERs of VOCs from urine decayed uniformly with time for many components. Therefore, the composition of the components emitted from urine was almost the same for both daytime and nighttime.
Next, the data for the total weight of feces and urine per unit time and the average amount of feces and urine per head of cattle per day based on the analysis of the camera images are presented in Table 6. These data indicated that the weights of both feces and urine were almost constant regardless of the time, the individual cattle, or the season in which they were collected. The total weight of the feces and urine was taken as the average weight collected in November 2019 and March 2020. Number of times of feces and urine was taken as the average time during the sampling campaigns in August 2019, November 2019, and March 2020. Based on these results, it was, therefore, assumed that the amount of excretion was constant regardless of the time, the individual, and the season.

Total weight of feces and urine per unit time and the average number of feces and urine per head of cattle per day.
Emissions of the VOCs from the feces and urine in the shed were estimated by applying the values in the table to equations (4)-(6). From Table 7, the emissions of the VOCs per head from the shed derived from the feces and urine were 1.75 and 1.52 g day-1, respectively. Except for sulfur compounds, emissions from feces were higher than from urine. The emissions of sulfur compounds from urine were 2.3 times higher than from feces. In this study, the total weight of feces and urine per head per day was estimated to be 27 kg and 19 kg, respectively, and total weight of manure was estimated to be 46 kg. In an earlier study, Yamada et al. (2009) reported that the average total weight of manure per head was 64.1±7.1 kg day-1, where the cattle were reared in a free stall and the average body weight was 700 kg. This weight of manure was about 1.1 times higher than the weight in the present study. The amounts of feed per head per day in the present study and that of Yamada et al. were 18 kg and 22.5 kg, respectively; that is, the previous amount was 1.25 times higher than in the present study. The amount of excretion by the dairy cattle estimated for this study was less than that reported by Yamada et al., and this difference may be due in part to the difference in the amount of feed.
This study is the first attempt to estimate the VOC emissions from the manure of tethered dairy cattle in Japan. It is thought that the emissions of VOCs from excretions in the shed can be evaluated more accurately by estimating the time it takes for manure to be removed from the shed.
3. 4 Contribution of Each VOC from Manure of Dairy Cattle to OAV and OHR
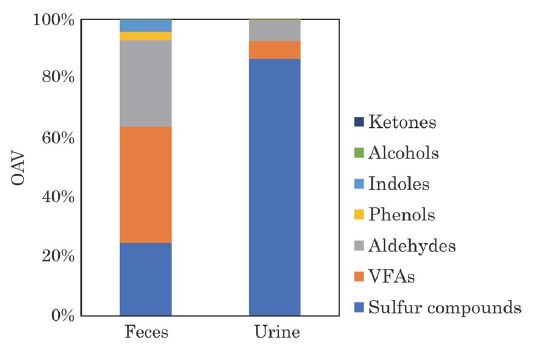
The contribution of VOCs derived from manure to the OAV is shown in Fig. 7. VFAs, aldehydes, and sulfur compounds accounted for about 90% of OAV from feces, while sulfur compounds accounted for 86% of OAV from urine. Ketones, which were highly emitted from feces and urine, made little contribution to OAV because their OTV is very high compared to other substances (e.g., the OTV of acetone is about 14,000 times higher than that of dimethyl sulfide). Yuan et al. (2017) reported that sulfur compounds accounted for about 80% of OAV in the dairy cattle shed. Hobbs et al. (1999) and Nie et al. (2020) reported that H2S was main compounds of OAV in pig slurry. Therefore, sulfur compounds may contribute to OAV mainly regardless livestock species.
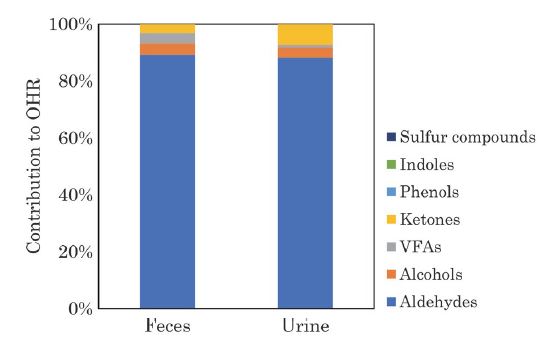
The contribution of VOCs derived from manure to the OHR is shown in Fig. 8. Aldehydes were dominantly contributed to OHR, followed by alcohols. Yuan et al. (2017) reported that alcohols were main compounds of OHR in dairy cattle shed whereas alcohols were secondary main compounds of OHR in this study. The high contribution of alcohols to OHR in the shed reported by Yuan et al. may be due to the high ethanol emissions from silage and total mixed ration (TMR) (Bonifacio et al., 2017).
4. CONCLUSIONS
In this study, the concentrations of 34 VOCs emitted from the feces and urine of dairy cattle were determined to clarify the chemical composition of the VOCs and to estimate the VOC emissions from manure in a dairy cattle shed. Dimethyl sulfide and acetone accounted for about 60% of the total VOCs from feces, followed by formaldehyde and acetaldehyde. Dimethyl sulfide and acetone were also dominant VOCs emitted from the manure, which accounted for 90% of the total VOCs. The ERs of VOCs from the manure showed a tendency to decay exponentially with time after excretion. Furthermore, the average time between excretion and cleaning during the daytime (8:00 am-5:00 pm) and during the nighttime (5:00 pm-7:00 am) was estimated to be 80 min and 480 min, respectively. Finally, the amounts of VOC emissions derived from the feces and urine in the cattle shed were estimated to be 1.75 and 1.52 g day-1, respectively. The contribution of VOCs emitted from manure to OAV and OHR were also evaluated. VFAs, sulfur compounds, aldehydes accounted for about 90% of OAV from feces whereas sulfur compounds were 86% of OAV from urine. In addition, sulfur compounds were main compounds of OAV from manure regardless of livestock spices. In contrast, aldehydes had the highest contribution to OHR from manure.
Acknowledgments
The authors thank Mr. Y. Ando (Asahi Agricultural High School, Chiba, Japan) for support in sampling. We also thank Mr. S. Fukumori and Mr. Y. Nakashima (Electric Power Engineering Systems Co., Ltd., Tokyo, Japan) for assistance in sample collection and sample preparation, and Mr. J. Saito, Ms. S. Sekiguchi and Mr. K. Hara (Waseda University Environmental Safety Center, Tokyo, Japan) for technical support in TD-GC/MS and HPLC analysis.
References
-
Alanis, P., Ashkan, S., Krauter, C., Campbell, S., Hasson, A.S. (2010) Emission of volatile fatty acids from feed at dairy facilities. Asian Journal of Atmospheric Environment, 44, 5084-5092.
[https://doi.org/10.1016/j.atmosenv.2010.09.017]

-
Atkinson, R., Baulch, D.L., Cox, R.A., Crowley, J.N., Hampson, R.F., Hynes, R.G., Jenkin, M.E., Rossi, M.J., Troe, J., and IUPAC Subcommittee (2006) Evaluated kinetic and photochemical data for atmospheric chemistry: Volume II - gas phase reactions of organic species. Atmospheric Chemistry and Physics, 6, 3625-4055.
[https://doi.org/10.5194/acp-6-3625-2006]

-
Bonifacio, H.F., Rotz, C.A., Hafner, S.D., Montes, F., Cohen, M., Mitloehner, F.M. (2017) A process-based emission model of volatile organic compounds from silage sources on farms. Atmospheric Environment, 152, 85-97.
[https://doi.org/10.1016/j.atmosenv.2016.12.024]

- CDPR (California Department of Pesticide Regulation) (2006) Pesticide air initiative: Strategy to reduce toxic and volatile organic compound emissions from agricultural and commercial structural pesticides, http://www.cdpr.ca.gov/docs/emon/airinit/workshop_ppt.pdf (Accessed on 10 February 2022).
-
Fushimi, A., Morino, Y., Takami, A., Ohara, T., Tanabe, K. (2011) Toward a solution of PM2.5 situation: resent study and future task. Japan Society of Atmospheric Environment, 46(2), 84-100 (in Japanese).
[https://doi.org/10.11298/taiki.46.84]

-
Giganek, M., Neca, J. (2008) Chemical characterization of volatile organic compounds on animal farms. Veterinarni Medicina, 53(12), 641-651.
[https://doi.org/10.17221/1969-VETMED]

-
Guo, H., Murray F. (2000a) Modelling of emissions of total volatile organic compounds in an Australian house. Indoor Built Environ, 9, 171-181.
[https://doi.org/10.1177/1420326X0000900306]

-
Guo, H., Murray, F., Wilkinson, S. (2000b) Evaluation of total volatile organic compound emissions from adhesives based on chamber tests. Journal of the Air & Waste Management Association, 50, 199-206.
[https://doi.org/10.1080/10473289.2000.10464006]

-
Hales, K., Parker, D.B., Cole, N.A. (2015) Volatile organic compound flux from manure of cattle fed diets differing in grain processing method and co-product inclusion. Atmospheric Environment, 100, 20-24.
[https://doi.org/10.1016/j.atmosenv.2014.10.037]

-
Hobbs, P.J., Misselbrook, T.H., Cumby, T.R. (1999) Production and Emission of odours and gases from ageing pig waste. Journal of Agricultural Engineering Research, 72, 291-298.
[https://doi.org/10.1006/jaer.1998.0372]

-
Howard, C.J., Kumar, A., Mitloehner, A., Stackhouse, K., Green, P.G., Flocchini, R.G., Kleeman, M.J. (2010) Direct measurements of the ozone formation potential from Livestock and poultry waste emissions. Environmental and Science Technology, 44(7), 2292-2298.
[https://doi.org/10.1021/es901916b]

-
Hu, J., Howard, C.J., Mitloehner, F., Green, P.G., Kleeman, M.J. (2012) Mobile Source and Livestock Feed Contributions to Regional Ozone Formation in Central California. Environmental Science & Technology, 46(5), 2781-2789.
[https://doi.org/10.1021/es203369p]

-
Hwang, O., Lee, S., Cho, S., Ro, K.S., Spiehs, B.W., Silva, P.J., Han, D., Choi, H., Kim, K., Jung, M. (2018) Efficacy of different biochars in removing odorous volatile organic compounds (VOCs) emitted from swine manure. ACS Sustainable Chemistry and Engineering, 6, 14239-14247.
[https://doi.org/10.1021/acssuschemeng.8b02881]

-
Ito, Y. (2005) Investigation of technology assessment of VOC and odor control apparatus. Journal of Japan Association on Odor Environment, 36(6), 356-363. (inJapanese)
[https://doi.org/10.2171/jao.36.356]

- Japan Meteorological Agency, value per year, https://www.data.jma.go.jp/obd/stats/etrn/view/annually_a.php?prec_no=45&block_no=1003&year=&month=&day=&view=, . (Accessed on 28 May 2022).
-
Laor, Y., Shabtay, A., Ravid, U., Baybikov, R., Eitam, H. (2007) Changes in VOCs Emissions from Fecal Manure throughout the Life Cycle of Beef Cattle. American Society of Agricultural and Biological Engineers Conference: 2007 Minneapolis, Minnesota, June 17-20, 2007.
[https://doi.org/10.13031/2013.23049]

-
Lee, S.H., Kwok, N., Guo, H., Hung, W. (2003) The effect of wet film thickness on VOC emissions from a finishing varnish. The Science of the Total Environment, 302, 75-84.
[https://doi.org/10.1016/S0048-9697(02)00340-6]

-
Miller, D.N., Woodbury, B.L. (2006) A solid-phase microextraction chamber method for analysis of manure volatiles. Journal of Environmental Quality, 35(6), 2383-2394.
[https://doi.org/10.2134/jeq2006.0065]

-
Matsushita, K., Akada, R., Yamada, M. (2008) Discovery and Development of Heat-resistant Fermentative Microorganisms. Chemical and Biology, 46(7), 472-477. (inJapanese).
[https://doi.org/10.1271/kagakutoseibutsu.46.472]

- Ministry of Agricultural, Forestry, and fishers: Livestock industry (2020) https://www.maff.go.jp/j/chikusan/kankyo/taisaku/pdf/210325kmegji.pdf, . (Accessed on 10 February 2022) (in Japanese).
- Ministry of Environment: Report for emission inventory of VOC (2018) https://www.env.go.jp/air/air/osen/voc/inventory/R1/R1-Mat04.pdf, . (Accessed on 2 February. 2022) (in Japanese).
- Ministry of Environment: Schedule for future study of measures against photochemical oxidants (2020) https://www.env.go.jp/air/schedule.pdf, . (Accessed on 10 January 2022) (in Japanese).
- Nagata, Y. (2003) Measurement of Odor Threshold by Triangle Odor Bag Method. Japan Environmental Sanitation Center, 118-127. https://www.env.go.jp/en/air/odor/measure/02_3_2.pdf, (Accessed on 10 February 2022).
- National Institute for Environmental Studies: Database of annual average concentration of non-methane hydrocarbons in 2019. https://www.nies.go.jp/igreen/td_down.html, . (Accessed on 10 February 2022) (in Japanese).
-
Ni, J., Robarge, W.P., Xiao, C, Heber, A.J. (2012) Volatile organic compounds at swine facilities: A critical review. Chemosphere, 89(7), 769-788.
[https://doi.org/10.1016/j.chemosphere.2012.04.061]

-
Nie, E., Zheng, G., Ma, C. (2020) Characterization of odorous pollution and health risk assessment of volatile organic compound emissions in swine facilities. Atmospheric Environment 223, 2-7.
[https://doi.org/10.1016/j.atmosenv.2019.117233]

-
Orzi, V., Cadena, E., D’lmporzano, G., Artola, A., Davoli, E., Crivelli, M., Adani, F. (2010) Potential odour emission measurement in organic fraction of municipal solid waste during anaerobic digestion: Relationship with process and biological stability parameters. Bioresource Technology 101, 7330-7337.
[https://doi.org/10.1016/j.biortech.2010.04.098]

-
Osaka, N., Miyazaki, A., Tanaka, N. (2018) Emissions of Volatile Organic Compounds from a Swine Shed. Asian Journal of Atmospheric Environment, 12(2), 178-191.
[https://doi.org/10.5572/ajae.2018.12.2.178]

-
Parker, D.B., Gilley, J., Woodbury, B., Kim, K., Galvin, G., Bartelt-Hunt, S.L., Li, X., Snow, D.D. (2012) Odorous VOC emission following land application of swine manure slurry. Atmospheric Environment, 66, 91-100.
[https://doi.org/10.1016/j.atmosenv.2012.01.001]

-
Shaw, S., Mitloehner, F.M., Jackson, W., Depeters, E.J., Fadel, J.G., Robinson, P.H., Holzinger, R., Goldstein, A.H. (2007) Volatile organic compound emissions from dairy cows and their waste as measured by proton-transfer-reaction mass spectrometry. Environmental Science & Technology, 41(4), 1310-1316.
[https://doi.org/10.1021/es061475e]

- Takahashi, K. (2018) Dairy Cattle Feeding Pattern. Rakuno Gakuen University. https://s3-ap-northeast-1.amazonaws.com/rp.rakuno.ac.jp/wp-content/uploads/2018/06/18131508/ce2742ab336e910ddfe88761d6ccaba4.pdf, . (Accessed on 10 February 2022) (in Japanese).
-
Tanaka, N., Moriyama, K., Ohtsu, M., Miyazaki, A. (2019) Emissions of Volatile Organic Compounds from a Dairy Cattle Shed in Japan. Asian Journal of Atmospheric Environment, 13(3), 171-185.
[https://doi.org/10.5572/ajae.2019.13.3.171]

-
Tanaka, N., Ohtsu, M., Miyazaki, A. (2020) Emissions of Volatile Organic Compounds from a Hen Shed in Japan. Asian Journal of Atmospheric Environment, 14(3), 236-252.
[https://doi.org/10.5572/ajae.2020.14.3.236]

- Yamada, A., Zhang, J., Aoki, Y., Kawamoto, H., Kobayashi, R., Nonaka, K., Kamo, M. (2009) Manure excretion by dry and lactating Holstein cows in free-stall barn. Animal Behaviour and Management, 45(3), 124-130 (in Japanese).
- Yokoyama, H. (2009) Hydrogen recovery from cattle manure by anaerobic fermentation. TX. Technology show case in Tsukuba, 2009 (P-18). https://www.science-academy.jp/showcase/08/pdf/P-018_showcase2009.pdf, (Accessed on 10 February 2022) (in Japanese).
-
Yuan, B., Coggon, M.M., Koss, A.R., Warneke, C., Eilerman, S., Peischl, J., Aikin, K.C., Ryerson, T.B., De Gouw, J.A. (2017) Emissions of volatile organic compounds (VOCs) from concentrated animal feeding operations (CAFOs): Chemical compositions and separation of sources. Atmospheric Chemistry and Physics, 17(8), 4945-4956.
[https://doi.org/10.5194/acp-17-4945-2017]

