PM2.5-bound Inorganic and Nonpolar Organic Compounds in Chuncheon, Korea
Abstract
In this study, major chemical components of PM2.5 including nitrate, sulfate, organic carbon (OC), and elemental carbon (EC) were measured in Chuncheon, South Korea in May-June, 2021. Average PM2.5 concentration was 16.4±9.7 μg m-3, and OC was the largest contributor of PM2.5 mass concentration. High concentration episodes (HCEs), defined when PM2.5 concentration exceeded 30 μg m-3, were caused by Asian dust, secondary inorganic aerosol (SIA) formation, and primary OC emission. NH4+ was determined to be a limiting factor for SIA formation based on neutralization ratio. There was statistically significant correlation between n-alkanes and PM2.5, and odd alkanes including C27, C29, and C31, which are generally emitted from biogenic sources, were abundant species, suggesting the importance of natural sources over fossil fuel combustion. Polycyclic aromatic hydrocarbons (PAHs) concentrations were significantly lower than those measured at the same sampling site in 2014-2015. Based on the diagnostic ratios of PAHs, vehicular emission, rather than solid fuel emission, were significant for PAHs. Detailed characterization of chemical composition of PM2.5 reported in this study can be of great help in establishing an appropriate abatement policy to reduce PM2.5 concentrations.
Keywords:
PM2.5, Organic carbon, N-alkanes, Polycyclic aromatic hydrocarbon, Secondary inorganic aerosol1. INTRODUCTION
Particulate matter with aerodynamic diameter less than or equal to 2.5 μm (PM2.5) adversely affects human health, causing various pulmonary and cardiovascular diseases (Pun et al., 2017; Atkinson et al., 2014; Hoek et al., 2013; Dominici et al., 2006). In fact, PM2.5 has been one of the most significant air pollutants in East Asia for more than a decade. Its concentration in South Korea showed a decreasing trend until 2012, and since then has become stagnant. The current annual national ambient air quality standard of Korea is 15 μg m-3, and the PM2.5 concentrations measured at most national air quality monitoring stations, regardless of urban area, industrial city, or small residential city, exceed its national standard (NIER, 2022a), and are more than 4 times higher than the WHO guideline (WHO, 2021). Many studies have suggested that a large portion of PM2.5 in South Korea is affected by the long-range transport from China (Choi et al., 2022; Byun et al., 2020; Lee et al., 2019); however, PM2.5 concentrations in Korea have been stagnant since 2013, whereas due to the stringent mitigation efforts, they were dramatically reduced in eastern China from 2013 to 2019 (Li et al., 2020; Zeng et al., 2019).
The various components that PM2.5 is composed of include ionic compounds, organic matter, elemental carbon, and metallic components, which are either emitted from natural and anthropogenic sources, or formed secondarily via atmospheric reactions. Ionic compounds, including (NH4)2SO4, NH4HSO4, and NH4NO3, are predominantly formed in atmosphere by gaseous precursors, such as NH3, NOx, and SO2. Organic aerosol (OA), a major component of PM2.5, consists of more than 1,000 individual organic components; OA can be divided into primary organic aerosol (POA) directly emitted from various sources, and secondary organic aerosols (SOA) generated through various homogeneous and heterogeneous reactions with oxidants (Xing et al., 2019; Seinfeld and Pandis, 2016; Tsimpidi et al., 2010). Organic tracers are generally divided into polar and nonpolar organic compounds, and nonpolar organic compounds such as alkanes and polycyclic hydrocarbons (PAHs) have been studied for identifying primary emission sources. N-alkanes are relatively stable and emitted from both anthropogenic and biogenic sources (Zhang et al., 2021; Kotianová et al., 2008). PAHs are mainly emitted from incomplete combustion of liquid fuel such as gasoline and diesel and solid fuels such as biomass and coal (Yan et al., 2019).
This study was performed in a small-sized inland residential city, Chuncheon, South Korea. According to the national emissions inventory, the emission rates of the major air pollutants including PM2.5 in this city are very low compared with adjacent cities; however, PM2.5 consistently showed similar or even higher concentrations than in Seoul and other large cities (NIER, 2022b). To identify the cause of high PM2.5 concentrations, daily PM2.5 and its chemical constituents were measured from May 14 to June 26, 2021. Detailed characterization of chemical composition can be of great help in identifying the possible sources and/or formation pathways of PM2.5, and in establishing an appropriate abatement policy.
2. METHODOLOGY
2. 1 Site Description and Sampling
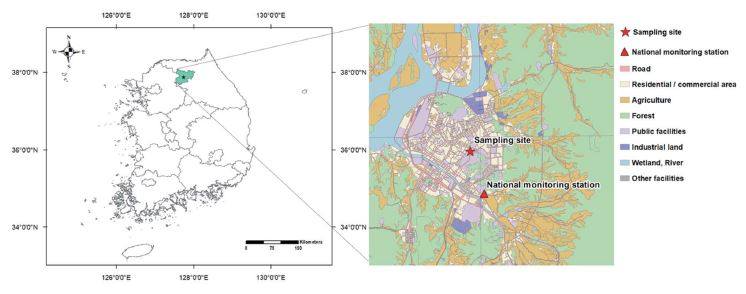
Samples of PM2.5 were collected on the roof of a four-story building of Kangwon National University (KNU) in Chuncheon, South Korea (37°87′N; 127°74′E) (Fig. 1). Chuncheon is a medium-sized residential city without large-scale anthropogenic sources, and is therefore expected to be affected more by regional- or long-range transport from the metropolitan and industrial areas located in the northwestern part of South Korea (Fig. 1). Samples of PM2.5 were collected for 23 h from 10 am to 9 am the following day from May 15, 2021 to June 26, 2021. To quantify PM2.5 mass concentration, a 47 mm PTFE membrane filter with supported polypropylene ring (pore size of 2.0 μm, GVS, Italy) and a cyclone were used in a PMS-204 sampler (APM Engineering, Bucheon-si, Korea) at a flow rate of 16.7 L min-1. Carbonaceous components were collected on a pre-baked 47 mm quartz filter (pore size of 2.2 μm, Whatman, Maidstone, UK) with a carbon denuder (Sunset Laboratory Inc., USA) and a cyclone at a flow rate of 16.7 L min-1. High volume air sampler (Hi-vol 3000, Ecotech, Australia) with quartz filter (203.2 mm×254 mm) was used to measure organic compounds. For ionic compounds, a 47 mm PTFE filter (pore size of 1.0 μm, GVS, Italy) was used with a cyclone and two 3-channel annular denuders (URG-2000-30x242-3CSS, URG Co., Chapel Hill, NC, USA) at a flow rate of 10 L min-1. The annular denuder was coated with citric acid solution (100 mL of ethanol+1 g of citric acid+1 g of glycerol) to remove acid gases (SO2, HNO3, HNO2) and Na2CO3 solution (50 mL of ethanol+50 mL of ultrapure water+1 g of Na2CO3+1 g of glycerol) to remove NH3.
2. 2 Chemical Analysis
The Teflon filter was stored under controlled conditions of temperature (20°C) and RH (50%) for 24 h before and after sampling, and was then weighed three times using a microbalance (readability=10-5 g, CP 225D, Satorius, Germany) equipped with a static eliminator (The Staticmaster 2U500, NRD, USA) to determine PM2.5 mass concentration. To analyze ionic compounds, the filters were extracted with 10 mL of ultrapure water in an ultrasonic extractor for 2 h. The extract was filtered with 0.45 μm PTFE syringe filter, and analyzed with ion chromatography (Metrohm AG, Switzerland). For organic carbon (OC) and elemental carbon (EC) analysis, 1.5 m2 of quartz filter was analyzed using the National Institute of Occupational Safety and Health (NIOSH) method 5040 for thermal-optical analysis. The detailed method can be found in other studies (Byun et al., 2020; Park et al., 2018).
For nonpolar organic compounds, the collected filters from high-volume air sampler were cut into pieces, and placed in amber glass vials containing 50 mL of dichloromethane (DCM, GC grade, Fisher chemical, USA)/methanol (HPLC grade, Fisher chemical, USA) mixture (3 : 1). After injecting internal standards into the vials, the samples were extracted twice in an ultrasonicator for 30 min. The extracts were concentrated to 10 mL at 40°C using N2 (99.999% purity) gas evaporator (Turbo storm, SCINCO, Korea), filtered by 0.45 μm PTFE syringe filter (Pall Corp., USA), and reduced to the final volume of 0.5 mL at room temperature using a N2 (99.999%) concentrator. The GC-MS (GC 7890A/MSD 59975C, Agilent Technologies, USA) was used for n-alkanes (C20-C34) and 11 PAHs (Table 1). Table S1 of the Supplementary Information (SI) describes the analysis condition of GC-MS.
2. 3 Quality Assurance and Quality Control (QA/QC)
Calibration curve was obtained using 7 different concentrations of standard solutions, and r2 was higher than 0.997 (Table 1) when using the internal standard technique (NIER, 2011). Acenaphthene-d10 and Pyrene-d-10 were used as internal standards for PAHs, while Pentadecane-d32, Eicosane-d42, Tetracosane-d50, Dotriacontane-d66, and Hexatricontane-d74 were used as internal standards for n-alkanes. Method detection limit (MDL) was calculated as 3.14 times the standard deviation by analyzing the standard solution 7 times. The extraction recoveries for n-alkanes and PAHs were determined by spiking the standard solution in the blank filter, and ranged (62 to 114)% (Table 1).
2. 4 Meteorological Data and Other Pollutants
Meteorological data (temperature, wind speed, and relative humidity) were measured every 5 min using meteorological equipment (Wireless Vantage Pro2 Weather Station, Davis Instrument, Hayward, CA, USA) at the sampling site. Meteorological data were measured every 5 min, but averaged to match the temporal resolution of PM2.5 samples. It should be noted that there are possible uncertainties caused by using different timescales for the measurements of pollutants and for meteorological data. Concentrations of PM10 and gaseous pollutants, including O3, NO2, SO2, and CO, were observed from the nearest national ambient air quality monitoring station, which is located about 1.5 km distance from the sampling site (Fig. 1).
3. RESULTS AND DISCUSSION
3. 1 Characterization of High-concentration Episodes
Average PM2.5 concentration was (16.4±9.7) μg m-3, and OC showed the highest concentration (3.2 μg m-3), contributing about 20% of total PM2.5 mass. The SO42- was higher than NO3-, probably because of active photochemical sulfur oxidation in the warm season (Zhou et al., 2016; Gao et al., 2011). The PM2.5 was better correlated with carbonaceous compounds (r2=0.65 with OC and 0.72 with EC) than with ionic compounds (r2=0.47-0.59) (Fig. 2). Average OC/EC ratio of 10.3 was much higher than the values reported in previous studies in South Korea (Choi et al., 2021; Park et al., 2021; Yu and Park, 2021), indicating that the portion of secondary OC was significant in this season. Since aged organic matter and secondarily formed organic matter contain more oxygen, which is not analyzed by thermal-optical analysis (Martinez et al., 2012; Turpin and Lim, 2001), organic matter estimated from OC concentration is likely to significantly contribute to PM2.5 mass in this city.
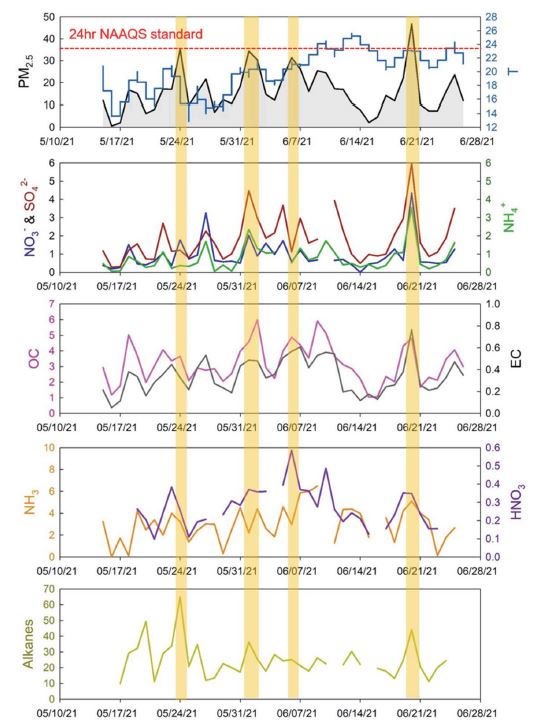
Daily variation of PM2.5 and its major chemical constituents. The four high concentration events (HCEs) of PM2.5 are indicated as thick yellow lines. The red dashed line in the top panel indicates the 24-h national ambient air quality standard (NAAQS) of Korea.
In this study, a high concentration episode (HCE) was defined when the measured PM2.5 concentrations exceeded 30 μg m-3. Four HCEs occurred during the study period, and a summary of measured data for the HCEs is presented in Table S2. The HCE1, HCE3, and HCE4 showed higher wind speed than the average WS of non-HCEs (Fig. 3), possibly indicating that atmospheric stagnation was not an important factor causing these HCEs. Asian dust event appeared on HCE1, and PM2.5/PM10 ratio was only 33%, indicating that crustal elements were dominant in the coarse mode. For HCE1, Ca2+ and Mg2+ concentrations were dramatically enhanced (9.2 times and 4 times higher than the average for Ca2+ and Mg2+, respectively), but SO42- and NH4+ showed even lower concentrations than for non-HCEs (Fig. 3). Increased NO3- and OC concentrations for HCE1 (Fig. 3) were probably derived from crustal sources (Lee et al., 2014). The ∑n-alkane also showed the highest concentration in HCE1 (Fig. 3), suggesting that soil resuspension affected these non-polar organic compounds, as found in previous research efforts (Alves et al., 2016). The ∑PAHs in HCE1 was higher than in non-HCE, and CHR and BkF, known as the major PAHs in temperate soil (Wilcke, 2000), increased the most (2.0 and 2.3 times higher for HCE1 than the average during the entire sampling period).
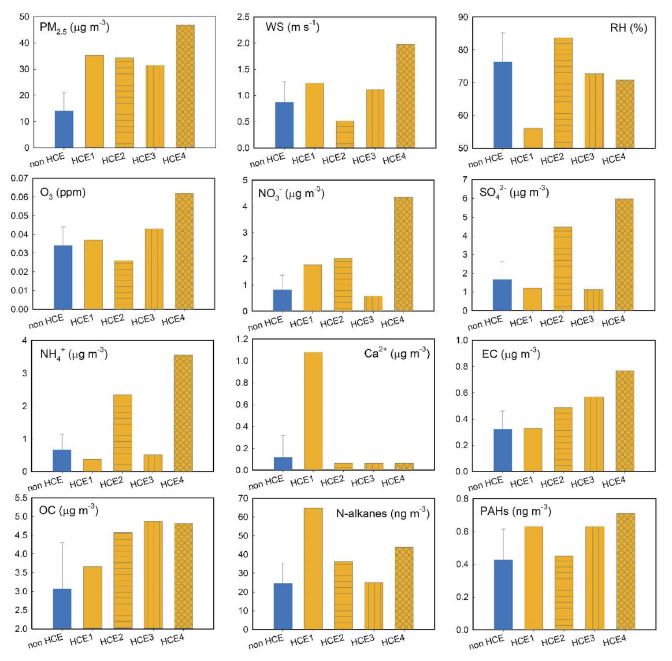
PM2.5 component characteristics with wind speed and relative humidity for each HCE event. O3 concentrations were obtained from the nearest national ambient air monitoring station.
On the other hand, low wind speed (WS) and high relative humidity (RH) were observed for HCE2 (Fig. 3), providing suitable aqueous heterogeneous reactions. Both HCE2 and HCE4 showed significantly increased ionic constituents, but NO3- of HCE2 did not increase as much as that of HCE4, while SO42- and NH4+ were dramatically enhanced for both HCE2 and HCE4. The reaction rate of NO2 with OH is an order of magnitude greater than that of SO2 with OH (Ma et al., 2021; Seinfeld and Pandis, 2016), while heterogeneous chemistry was frequently found to be more important than gas-phase oxidation for the SO42- formation mechanism (Zheng et al., 2015). High RH and low WS observed for the HCE2 possibly suggested that aqueous reactions played more important roles in SO42- formation than in NO3- formation at this site. In the meantime, HCE4 showed largest increases on NO3-, SO42-, and NH4+, as well as on gaseous O3 concentration; therefore, gas-phase oxidation mechanisms were significant, as O3 is predominantly produced via a series of gas-phase reactions (Sun et al., 2011), which is also supported by the significant negative correlation between RH and O3 observed in this study (Pearson r=0.47, p-value<0.001). The OC also significantly increased for both HCE2 and HCE4, but the relative increment rate in OC to EC concentrations was large for HCE2, compared with HCE4 (Fig. 3), suggesting that secondary OC formation was likely to be more important for HCE2 than for HCE4. The PM2.5/PM10 ratios for both HCE2 (88%) and HCE4 (94%) were also very high, supporting the importance of secondary aerosol formation. On the other hand, in HCE3, the concentrations of ionic constituents were rather reduced, while OC and EC increased about 1.5 and 1.9 times the average concentrations of non-HCEs (Fig. 3), suggesting that the primary sources emitting carbonaceous compounds played an important role in enhancing PM2.5 concentration. Variation of ∑PAHs from HCE2 to HCE4 was similar to EC variation (Fig. 3).
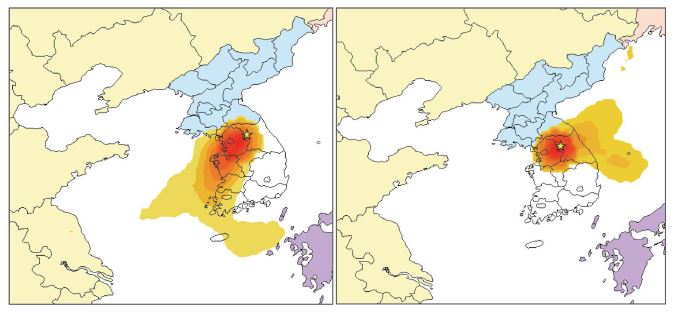
To identify the possible source areas, backward trajectories for the top 10% of PM2.5 were compared with those for the bottom 10% of PM2.5. Back-trajectories associated with the top 10% of PM2.5 were clearly distinct from those of the bottom 10% of PM2.5, showing that high PM2.5 samples originated from northeastern China, and passed through the western metropolitan area and industrial areas of Korea (Fig. S1 of the SI).
3. 2 Characteristics of Ionic Compounds
The highest average concentration among PM2.5 ionic constituents was shown by SO42- (1.8 μg m-3), followed by NO3- (0.9 μg m-3) and NH4+ (0.8 μg m-3). The neutralization ratio (NR) was calculated to describe the aerosol acidity:
| (1) |
where, concentrations are in equivalents. The [NH4+] and [SO42-]+[NO3-] were highly correlated with each other, indicating that most ionic compounds existed as NH4NO2 and (NH4)2SO4 (Fig. 4a). Average NR was (0.72±0.26), indicating slightly acidic aerosols (Fig 4a). To investigate the degree of neutralization of secondary inorganic aerosol (SIA), NR was plotted according to the NH4+ concentration (Fig. 4b). When NH4+ exceeded about 50 nmole m-3, the NR appeared constant around 1, and SIA was completely neutralized. In other cases, NR almost linearly increased as NH4+ increased, possibly indicating that NH3 was the limiting factor for SIA formation in this study. The HCE2 and HCE4, where SIA concentration was significantly enhanced (Fig. 3), showed the highest NR values (1.04 and 1.01, respectively) over the entire period, suggesting that NH3 was likely to cause high PM2.5 concentrations.
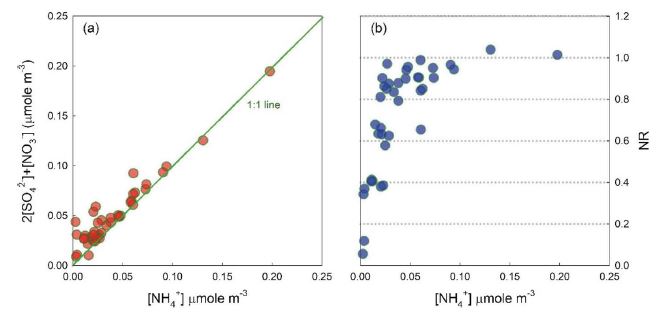
Correlation between the molar concentrations of [NH4+] and 2[SO42-]+[NO3-] (left), and the change of NR ratio according to NH4+ concentration.
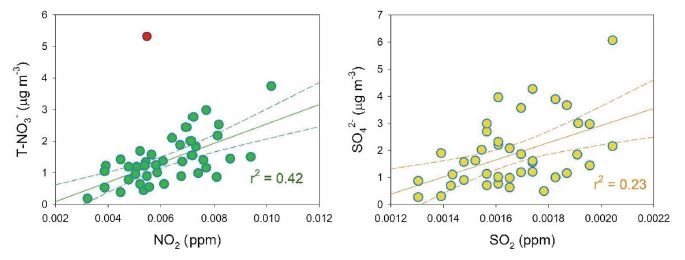
The PM2.5 component that increased the most during HCEs appeared to be NO3- on average. To identify the influence of NO2 and SO2 on NO3- and SO42- formations, respectively, the sulfur oxidation ratio (SOR) and the nitrogen oxidation ratio (NOR) were calculated:
| (2) |
| (3) |
where, [SO42-], [SO2], [NO3-], and [NO2] refer to the molar concentrations. In this study, SOR considers only the aerosol fraction since H2SO4 was not measured, but HNO3 was considered for the total [NO3-] (T-NO3-) in NOR. The average SOR (of 0.20±0.10) was higher than the average NOR (of 0.08±0.04), but the NOR and the SOR during HCEs increased about 2.3 and 1.5 times, compared to those during non-HCEs, respectively. To determine whether the gaseous precursors of NO2 and SO2 were oxidized to form SIA, the correlation between NO2 and T-NO3- and between SO2 and SO42- were investigated. Both regressions were significant (p-values< 0.001), but the r2 was much higher between NO2 and T-NO3- than between SO2 and SO42- (please note that one outlier, indicated as red point in Fig. 5, was excluded for the regression between NO2 and T-NO3-). These results possibly indicate that in situ oxidation of NO2 and/or gas-aerosol partitioning for HNO3 and NO3- occurred, even in the relatively warm season.
3. 3 Nonpolar Organic Compounds
N-alkanes are common organic compounds in PM2.5, emitted from both anthropogenic and natural sources (Rogge et al., 1993; Simoneit, 1986). In this study, average ∑n-alkane concentration was (24.5±11.0) ng m-3, and there was relatively strong correlation between ∑n-alkane and PM2.5 concentrations (Pearson r=0.47). The average concentrations of ∑n-alkane were 14.0±10.3 ng m-3 and 53.7±35.0 ng m-3 at the background site (Anmyeon Island) (Kim et al., 2018) and in Seoul (Lee et al., 2015), respectively, indicating that the ∑n-alkane concentrations reported in this study were relatively higher than in Anmyeon Island and lower than in Seoul. The C29 (n-nonacosane) and C31 (n-hentriacontane) were the most abundant species with the largest coefficient of variation (standard deviation divided arithmetic mean) (Fig. 6). Previous studies suggested that high carbon numbers generally appear from biogenic sources, including plant wax and bacteria, while low carbon numbers indicate a large contribution from fossil fuel combustion (Sun et al., 2021; Chen et al., 2014; Feng et al., 2006). Other research shows that Cmax ranges (C18 to C22) for petrol vehicles, and is C21 for diesel vehicles (Zhang et al., 2021). In this study, the relative concentration of C20-C23 was lower than the higher molecular weight alkanes (Fig. 6), indicating that fossil fuel combustion was not important. The carbon preference index (CPI, Eq. (8)) has often been used to identify the alkanes from natural emissions from the alkanes from anthropogenic emissions, because odd alkanes, rather than even alkanes, were preferred for biogenic sources.
| (4) |
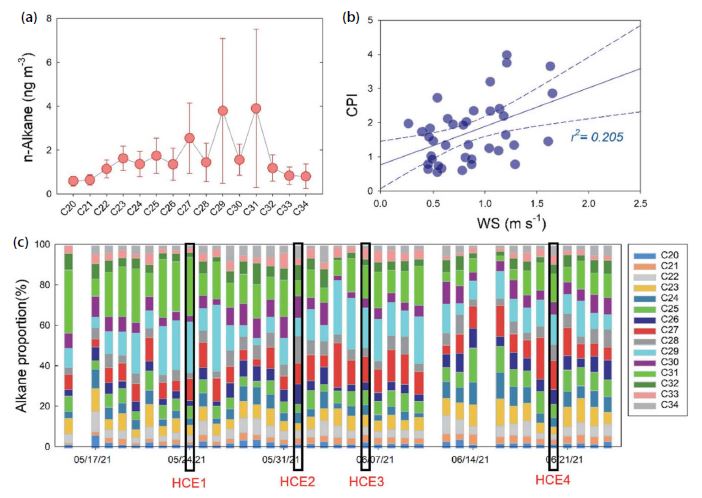
(a) Abundance of n-alkanes, (b) the relationship between wind speed and CPI value, and (c) the daily variation of Cmax proportion.
When CPI is close to 1, n-alkanes are mainly from anthropogenic sources, such as fossil fuel combustion and biomass burning, because the emission distribution of even and odd alkanes from these sources is not selective (Gao et al., 2022; Choi et al., 2012). When 1<CPI<3, n-alkanes are influenced by both biogenic and anthropogenic sources, and a higher CPI indicates a higher effect of biogenic sources (Feng et al., 2021). In this study, odd alkanes generally showed higher abundance than even alkanes (Fig. 6), suggesting the importance of biogenic sources over fossil fuel combustion. Average CPI value was (1.73±0.92) with relatively large variation, ranging (0.57 to 3.99), and the two maximum CPIs were observed on May 24 and May 26 when the PM2.5/PM10 ratio was (0.33 and 0.39), respectively, indicating that natural sources were more significant than combustion source. Asian dust event occurred on May 24 when the highest ∑n-alkane concentration (64.8 ng m-3) appeared during the sampling period (Fig. 2).
Relatively high ∑n-alkane concentrations were shown for HCEs (Fig. 3), but the relative abundance of each alkane varied. For HCE1 and HCE3, the odd alkanes of C27, C29, and C31 were dominant, contributing (65 and 48)%, respectively (Fig. 6). According to Li et al. (2010), alkanes are anticipated to be mainly emitted from biogenic sources if the odd alkanes among C27-C31 are higher than even alkanes. In HCE3, the concentrations of ionic constituents were low, while the highest OC concentration was shown among all HCEs (Fig. 3), and high CPI of 2.35 was observed; therefore, the high OC of HCE3 was partly influenced by biogenic sources, such as plant wax and microorganism. On the other hand, for both HCE2 and HCE4 categorized by SIA-derived event (Fig. 3), CPI values were relatively low at (0.68 and 1.47), respectively.
In this study, CPI was statistically correlated with WS (Pearson r=0.45) (Fig. 6), suggesting that the biogenic alkanes were significantly emitted from epicuticular wax with the effect of strong wind (Thao et al., 2014). Previous study also found that up to 50% of the leaf surface wax was lost after strong winds (Hall and Donaldson, 1963).
Average ∑PAHs concentration was (0.43±0.19) ng m-3, and there was statistically significant (at a significance level of 0.05), but not high, correlation between ∑PAHs and ∑n-alkane (Pearson r=0.38, p-value=0.019). Among 11 PAHs measured, PYR and BbF showed the highest average concentrations of 0.08 ng m-3. All PAHs concentrations were significantly lower than those measured at the same sampling site in 2014-2015 (Park et al., 2018). Previous studies showed that PAHs concentrations have dramatically decreased recently in other cities in Korea and in China (Zhang et al., 2021; Kang et al., 2020). In Seoul, the measured ∑PAHs concentration in 2018 were approximately one-fifth that of 2002, and the decreasing trend was more pronounced in summer (decreasing from 6.8 ng m-3 in 2002 to 0.8 ng m-3 in 2018 during summer) (Kang et al., 2020). The PAHs concentrations typically show clear seasonal variation with high values in winter and low values in summer (Shin et al., 2022; Nguyen et al., 2018; Ma et al., 2010), and low PAHs concentrations in this study were also likely to be reflected by seasonal influences. Concentrations of high molecular weight (HMW)-PAHs exceeded the medium-MW (MMW)-PAHs and low-MW (LMW)-PAHs in this study, indicating that vehicular emissions were more important than solid fuel combustion (Ali-Taleshi et al., 2021), or that LMW-PAHs showed much lower gas-particle partitioning coefficient, Kp than HMW-PAHs, especially in the warm season (Chen et al., 2016; Venkataraman et al., 1999).
Since PAH composition profiles are characteristics of each specific emission source, the diagnostic ratios (DRs) can be used to identify the source types. In this study, four DRs were used, of BaA/ (BaA+Chr), BaP/ BghiP, BaP (BaP+Chr), and IcdP/ (IcdP+BghiP). BaA/ (BaA+Chr) less than 0.2 indicates a petrogenic source, while it ranges (0.2 to 0.35) for petroleum combustion (Kang et al., 2020; Finardi et al., 2017; Simcik et al., 1999). In this study, the BaA/(BaA+Chr) was in the range (0.2 to 0.35) for most samples (Fig. 7), indicating the influence of vehicular emission. The BaP/BghiP ratio can further identify PAHs from gasoline (0.3-0.45) and diesel (0.45-0.8) (Zhang et al., 2021), indicating the major influence of diesel vehicle in this study (Fig. 7). The IcdP/(IdcP+BghiP) less than 0.5 and BaP/(BaP+Chr) ranging (0.3 to 0.7) indicate vehicular emission (Liu et al., 2017). A similar domestic study conducted using the PAHs diagnostic ratio showed that PAHs were greatly affected by vehicular emission in Seoul during summer (Kang et al., 2020). Previous study conducted at the same sampling site as this study showed that solid-fuel combustion, including biomass and coal burning, was predominant source of PAHs in winter (Park et al., 2018).
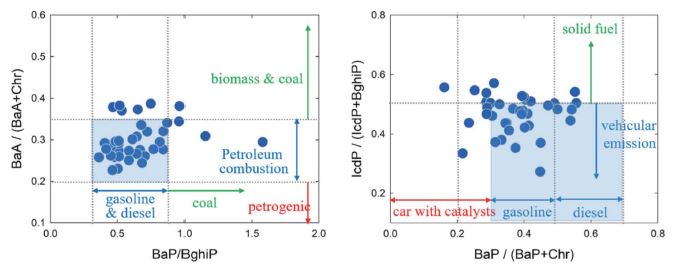
Diagnostic ratios to identify the major sources of PAHs. Results in this study generally suggest that the vehicular emissions were important.
There are some discrepancies for DR values in characterizing the different sources in the scientific literature; however, it was generally speculated that PAHs were majorly influenced by vehicular emission, although some influence of solid fuel combustion, such as coal and biomass burning, was observed in this study (Fig. 7). The DRs are better to be used with consideration of different volatilities of compounds, to reduce the impact of ambient temperature (Shen et al., 2019); however, the ratio of BaP/(BaP+Chr), which does not meet this rule, was considered, because all samples were collected in the relatively warm season (May and June).
4. CONCLUSIONS
Haze caused by high PM2.5 concentration is a serious air pollution event in East Asia. The formation pathways and major sources of PM2.5 greatly vary spatially and temporally, with different proportions of PM2.5 components. Therefore, even exposure to the same PM2.5 mass concentration may have different health effects from region to region. In this study, the chemical constituents of PM2.5 were measured in a small residential city of South Korea during May and June, 2021, to identify the cause of high PM2.5 concentration. Average PM2.5 concentration was 16.4±9.7 μg m-3, and OC was the largest contributor on average, followed by SO42- and NO3-. There were four PM2.5 episodes exceeding 30 μg m-3, which were characterized as one Asian dust event, two SIA events, and one OC event. The neutralization ratio (NR) calculated by molar concentrations of SO42-, NO3-, and NH4+ linearly increased as NH4+ increased, until NR appeared constant around 1, suggesting that NH3 was the limiting factor for SIA formation.
Since OC is the primary component of PM2.5 in this area, identification of its possible sources is an important task. There was relatively strong correlation between n-alkanes and PM2.5, and odd alkanes including C27, C29, and C31, which are generally emitted from biogenic sources, were the most abundant species, indicating that the natural sources are possibly important to PM2.5 concentration in this study. The PAHs were also measured, and their concentrations were significantly lower than those measured at the same sampling site in 2014 and 2015, which shows the same decreasing trends as in other cities in Korea, and in China. Based on the DR result of PAHs, vehicular emissions, rather than solid fuel emissions, were significant.
Acknowledgments
This research was funded by a grant from the Ministry of Environment, Korea, and by grants from the National Research Foundation of Korea (NRF-2017K1A13A1A12073373, NRF-2020R1A2C2013445, and 2021M3G1A1081539). The research was also supported in part by ‘Experts Training Graduate Program for Particulate Matter Management’ from the Ministry of Environment, Korea.
AUTHOR CONTRIBUTIONS
The work presented in this article was carried out through collaboration between all authors. S.-W.P. analyzed the data and wrote the paper. J.-H.H. performed the experiments. Y.-J.H. acquired the funding, defined the research theme, interpreted the results, and wrote the paper. T.-H.L. partly acquired the funding.
References
-
Ali-Taleshi, M.S., Squizzato, S., Riyahi Bakhtiari, A., Moeinaddini, M., Masiol, M. (2021) Using a hybrid approach to apportion potential source locations contributing to excess cancer risk of PM2.5-bound PAHs during heating and non-heating periods in a megacity in the Middle East. Environmental Research, 201, 111617.
[https://doi.org/10.1016/j.envres.2021.111617]

-
Alves, C.A., Oliveira, C., Martins, N., Mirante, F., Caseiro, A., Pio, C., Matos, M., Silva, H.F., Oliveira, C., Camões, F. (2016) Road tunnel, roadside, and urban background measurements of aliphatic compounds in size-segregated particulate matter. Atmospheric Research, 168, 139-148.
[https://doi.org/10.1016/j.atmosres.2015.09.007]

-
Atkinson, R.W., Kang, S., Anderson, H.R., Mills, I.C., Walton, H.A. (2014) Epidemiological time series studies of PM2.5 and daily mortality and hospital admissions: a systematic review and meta-analysis. Thorax, 69(7), 660-665.
[https://doi.org/10.1136/thoraxjnl-2013-204492]

-
Byun, J.-Y., Kim, H., Han, Y.-J., Lee, S.-D., Park, S.-W. (2020) High PM2.5 Concentrations in a Small Residential City with Low Anthropogenic Emissions in South Korea. Atmosphere, 11(11), 1159.
[https://doi.org/10.3390/atmos11111159]

-
Chen, Y., Cao, J., Zhao, J., Xu, H., Arimoto, R., Wang, G., Han, Y., Shen, Z., Li, G. (2014) N-alkanes and polycyclic aromatic hydrocarbons in total suspended particulates from the southeastern Tibetan Plateau: concentrations, seasonal variations, and sources. Science of The Total Environment, 470-471, 9-18.
[https://doi.org/10.1016/j.scitotenv.2013.09.033]

-
Chen, Y.C., Chiang, H.C., Hsu, C.Y., Yang, T.T., Lin, T.Y., Chen, M.J., Chen, N.T., Wu, Y.S. (2016) Ambient PM2.5-bound polycyclic aromatic hydrocarbons (PAHs) in Changhua County, central Taiwan: Seasonal variation, source apportionment and cancer risk assessment. Environmental Pollution, 218, 372-382.
[https://doi.org/10.1016/j.envpol.2016.07.016]

-
Choi, J.-K., Heo, J.-B., Ban, S.-J., Yi, S.-M., Zoh, K.-D. (2012) Chemical characteristics of PM2.5 aerosol in Incheon, Korea. Atmospheric Environment, 60, 583-592.
[https://doi.org/10.1016/j.atmosenv.2012.06.078]

-
Choi, S.-Y., Lee, H.-J., Park, S.-W., Han, Y.-J. (2022) Enhanced PM2.5 episodes in a small residential city of South Korea: Effects of biomass burning and secondary formations. Atmospheric Pollution Research, 13(10), 101562.
[https://doi.org/10.1016/j.apr.2022.101562]

-
Choi, S.-Y., Park, S.-W., Byun, J.-Y., Han, Y.-J. (2021) Characteristics of locally occurring high PM2.5 concentration episodes in a small city in south korea. Atmosphere, 12(1), 86.
[https://doi.org/10.3390/atmos12010086]

-
Dominici, F., Peng, R.D., Bell, M.L., Pham, L., McDermott, A., Zeger, S.L., Samet, J.M. (2006) Fine particulate air pollution and hospital admission for cardiovascular and respiratory diseases. Jama, 295(10), 1127-1134.
[https://doi.org/10.1001/jama.295.10.1127]

-
Feng, J., Hu, M., Chan, C.K., Lau, P.S., Fang, M., He, L., Tang, X. (2006) A comparative study of the organic matter in PM2.5 from three Chinese megacities in three different climatic zones. Atmospheric Environment, 40(21), 3983-3994.
[https://doi.org/10.1016/j.atmosenv.2006.02.017]

-
Feng, T., Wang, F., Yang, F., Li, Z., Lu, P., Guo, Z. (2021) Carbonaceous aerosols in urban Chongqing, China: Seasonal variation, source apportionment, and long-range transport. Chemosphere, 285, 131462.
[https://doi.org/10.1016/j.chemosphere.2021.131462]

-
Finardi, S., Radice, P., Cecinato, A., Gariazzo, C., Gherardi, M., Romagnoli, P. (2017) Seasonal variation of PAHs concentration and source attribution through diagnostic ratios analysis. Urban Climate, 22, 19-34.
[https://doi.org/10.1016/j.uclim.2015.12.001]

-
Gao, X., Yang, L., Cheng, S., Gao, R., Zhou, Y., Xue, L., Shou, Y., Wang, J., Wang, X., Nie, W., Xu, P., Wang, W. (2011) Semi-continuous measurement of water-soluble ions in PM2.5 in Jinan, China: Temporal variations and source apportionments. Atmospheric Environment, 45(33), 6048-6056.
[https://doi.org/10.1016/j.atmosenv.2011.07.041]

-
Gao, Y., Ling, Z., Zhang, Z., Lee, S. (2022) Characteristics of Fine Particulate Matter (PM2.5)-Bound n-Alkanes and Polycyclic Aromatic Hydrocarbons (PAHs) in a Hong Kong Suburban Area. Atmosphere, 13(6), 980.
[https://doi.org/10.3390/atmos13060980]

-
Hall, D., Donaldson, L. (1963) The ultrastructure of wax deposits on plant leaf surfaces: I. Growth of wax on leaves of Trifolium repens. Journal of Ultrastructure Research, 9(3-4), 259-267.
[https://doi.org/10.1016/S0022-5320(63)80006-4]

-
Hoek, G., Krishnan, R.M., Beelen, R., Peters, A., Ostro, B., Brunekreef, B., Kaufman, J.D. (2013) Long-term air pollution exposure and cardio-respiratory mortality: a review. Environmental Health, 12(1), 1-16.
[https://doi.org/10.1186/1476-069X-12-43]

-
Kang, M., Kim, K., Choi, N., Kim, Y.P., Lee, J.Y. (2020) Recent Occurrence of PAHs and n-Alkanes in PM2.5 in Seoul, Korea and Characteristics of their Sources and Toxicity. International Journal of Environmental Research and Public Health, 17(4), 1397.
[https://doi.org/10.3390/ijerph17041397]

-
Kim, K.A., Lee, J.S., Kim, E.S., Jung, C.H., Kim, Y.P., Lee, J.Y. (2018) Monthly Variation of n-alkanes concentration in PM2.5 of the Anmyeon Island. Journal of Korean Society for Atmospheric Environment, 34(1), 166-176.
[https://doi.org/10.5572/KOSAE.2018.34.1.166]

-
Kotianová, P., Puxbaum, H., Bauer, H., Caseiro, A., Marr, I.L., Čík, G. (2008) Temporal patterns of n-alkanes at traffic exposed and suburban sites in Vienna. Atmospheric Environment, 42(13), 2993-3005.
[https://doi.org/10.1016/j.atmosenv.2007.12.048]

-
Lee, S., Kim, J., Choi, M., Hong, J., Lim, H., Eck, T.F., Holben, B.N., Ahn, J.-Y., Kim, J., Koo, J.-H. (2019) Analysis of long-range transboundary transport (LRTT) effect on Korean aerosol pollution during the KORUS-AQ campaign. Atmospheric Environment, 204, 53-67.
[https://doi.org/10.1016/j.atmosenv.2019.02.020]

- Lee, S.P., Lim, H.B., Lee, J.Y., Kim, Y.P. (2015) Seasonal Variation of Concentrations and Sources for n-alkanes in PM10 Measured in Seoul. Journal of Korea Society for Environmental Analysis, 18(2), 93-100.
-
Lee, Y.-J., Jung, S.-A., Jo, M.-R., Kim, S.-J., Park, M.-K., Ahn, J.-Y., Lyu, Y.-S., Choi, W.-J., Hong, Y.-D., Han, J.-S. (2014) Characteristics of PM chemical component during haze episode and Asian dust at Gwang-ju. Journal of Korean Society for Atmospheric Environment, 30(5), 434-448.
[https://doi.org/10.5572/KOSAE.2014.30.5.434]

-
Li, K., Jacob, D.J., Shen, L., Lu, X., De Smedt, I., Liao, H. (2020) Increases in surface ozone pollution in China from 2013 to 2019: anthropogenic and meteorological influences. Atmospheric Chemistry and Physics, 20(19), 11423-11433.
[https://doi.org/10.5194/acp-20-11423-2020]

-
Liu, J., Wang, Y., Li, P.-H., Shou, Y.-P., Li, T., Yang, M.-M., Wang, L., Yue, J.-J., Yi, X.-L., Guo, L.-Q. (2017) Polycyclic Aromatic Hydrocarbons (PAHs) at High Mountain Site in North China: Concentration, Source and Health Risk Assessment. Aerosol and Air Quality Research, 17(11), 2867-2877.
[https://doi.org/10.4209/aaqr.2017.08.0288]

-
Ma, P., Quan, J., Jia, X., Liao, Z., Wang, Q., Cheng, Z., Dou, Y., Su, J., Pan, Y. (2021) Effects of ozone and relative humidity in secondary inorganic aerosol formation during haze events in Beijing, China. Atmospheric Research, 264, 105855.
[https://doi.org/10.1016/j.atmosres.2021.105855]

-
Ma, W.L., Li, Y.F., Qi, H., Sun, D.Z., Liu, L.Y., Wang, D.G. (2010) Seasonal variations of sources of polycyclic aromatic hydrocarbons (PAHs) to a northeastern urban city, China. Chemosphere, 79(4), 441-447.
[https://doi.org/10.1016/j.chemosphere.2010.01.048]

-
Martinez, M.A., Caballero, P., Carrillo, O., Mendoza, A., Mejia, G.M. (2012) Chemical characterization and factor analysis of PM2.5 in two sites of Monterrey, Mexico. Journal of Air & Waste Management Association, 62(7), 817-827.
[https://doi.org/10.1080/10962247.2012.681421]

- National Institute of Environmental Research (NIER) (2011) QA/QC Handbook for the Environmental Pollutants Analysis and Sampling Techniques. https://ecolibrary.me.go.kr/nier/#/search/detail/5508913
- National Institute of Environmental Research (NIER) (2022a) Annual Report of Air Quality in Korea, 2021. https://www.airkorea.or.kr/web/detailViewDown?pMENU_NO=125
- National Institute of Environmental Research (NIER) (2022b) 2019 national air pollutant emissions. https://www.air.go.kr/article/view.do?boardId=7&articleId=145&boardId=7&menuId=48¤tPageNo=1
-
Nguyen, T.N.T., Jung, K.S., Son, J.M., Kwon, H.O., Choi, S.D. (2018) Seasonal variation, phase distribution, and source identification of atmospheric polycyclic aromatic hydrocarbons at a semi-rural site in Ulsan, South Korea. Environmental Pollution, 236, 529-539.
[https://doi.org/10.1016/j.envpol.2018.01.080]

-
Park, J.-M., Han, Y.-J., Cho, S.-H., Kim, H.-W. (2018) Characteristics of Carbonaceous PM2.5 in a Small Residential City in Korea. Atmosphere, 9(12), 490.
[https://doi.org/10.3390/atmos9120490]

-
Park, S.-W., Choi, S.-Y., Byun, J.-Y., Kim, H., Kim, W.-J., Kim, P.-R., Han, Y.-J. (2021) Different Characteristics of PM2.5 Measured in Downtown and Suburban Areas of a Medium-Sized City in South Korea. Atmosphere, 12(7), 832.
[https://doi.org/10.3390/atmos12070832]

-
Pun, V.C., Kazemiparkouhi, F., Manjourides, J., Suh, H.H. (2017) Long-Term PM2.5 Exposure and Respiratory, Cancer, and Cardiovascular Mortality in Older US Adults. American Journal of Epidemiology, 186(8), 961-969.
[https://doi.org/10.1093/aje/kwx166]

-
Rogge, W.F., Hildemann, L.M., Mazurek, M.A., Cass, G.R., Simoneit, B.R. (1993) Sources of fine organic aerosol. 4. Particulate abrasion products from leaf surfaces of urban plants. Environmental Science & Technology, 27(13), 2700-2711.
[https://doi.org/10.1021/es00049a008]

- Seinfeld, J.H., Pandis, S.N. (2016) Atmospheric Chemistry and Physics: From Air Pollution to Climate Change. Wiley, New York, pp. 1-762.
-
Shen, R., Liu, Z., Chen, X., Wang, Y., Wang, L., Liu, Y., Li, X. (2019) Atmospheric levels, variations, sources and health risk of PM2.5-bound polycyclic aromatic hydrocarbons during winter over the North China Plain. Science of The Total Environment, 655, 581-590.
[https://doi.org/10.1016/j.scitotenv.2018.11.220]

-
Shin, S.M., Lee, J.Y., Shin, H.J., Kim, Y.P. (2022) Seasonal variation and source apportionment of Oxygenated Polycyclic Aromatic Hydrocarbons (OPAHs) and Polycyclic Aromatic Hydrocarbons (PAHs) in PM2.5 in Seoul, Korea. Atmospheric Environment, 272, 118937.
[https://doi.org/10.1016/j.atmosenv.2022.118937]

-
Simcik, M.F., Eisenreich, S.J., Lioy, P.J. (1999) Source apportionment and source/sink relationships of PAHs in the coastal atmosphere of Chicago and Lake Michigan. Atmospheric Environment, 33(30), 5071-5079.
[https://doi.org/10.1016/S1352-2310(99)00233-2]

-
Simoneit, B.R.T. (1986) Characterization of Organic Constituents in Aerosols in Relation to Their rigin and Transport: A Review. International Journal of Environmental Analytical Chemistry, 23(3), 207-237.
[https://doi.org/10.1080/03067318608076446]

-
Sun, N., Li, X., Ji, Y., Huang, H., Ye, Z., Zhao, Z. (2021) Sources of PM2.5-Associated PAHs and n-alkanes in Changzhou China. Atmosphere, 12(9), 1127.
[https://doi.org/10.3390/atmos12091127]

-
Sun, W.Y., Ding, S.L., Zeng, S.S., Su, S.J., Jiang, W.J. (2011) Simultaneous absorption of NOx and SO2 from flue gas with pyrolusite slurry combined with gas-phase oxidation of NO using ozone. Journal of Hazard Materials, 192(1), 124-130.
[https://doi.org/10.1016/j.jhazmat.2011.04.104]

- Thao, N., Yu, X., Zhang, H. (2014) Deposition of particulate matter of different size fractions on leaf surfaces and in epicuticular waxes of urban forest species in summer and fall in Beijing, China. International Journal of Sciences, 3. https://ssrn.com/abstract=2573647
-
Tsimpidi, A., Karydis, V., Zavala, M., Lei, W., Molina, L., Ulbrich, I., Jimenez, J., Pandis, S.N. (2010) Evaluation of the volatility basis-set approach for the simulation of organic aerosol formation in the Mexico City metropolitan area. Atmospheric Chemistry and Physics, 10(2), 525-546. http://www.atmos-chem-phys.net/10/525/2010/
[https://doi.org/10.5194/acp-10-525-2010]

-
Turpin, B.J., Lim, H.-J. (2001) Species Contributions to PM2.5 Mass Concentrations: Revisiting Common Assumptions for Estimating Organic Mass. Aerosol Science and Technology, 35(1), 602-610.
[https://doi.org/10.1080/02786820119445]

-
Venkataraman, C., Thomas, S., Kulkarni, P. (1999) Size distributions of polycyclic aromatic hydrocarbons-gas/particle partitioning to urban aerosols. Journal of Aerosol Science, 30(6), 759-770.
[https://doi.org/10.1016/S0021-8502(98)00761-7]

-
Wilcke, W. (2000) Synopsis polycyclic aromatic hydrocarbons (PAHs) in soil - a review. Journal of Plant Nutrition and Soil Science, 163(3), 229-248.
[https://doi.org/10.1002/1522-2624(200006)163:3<229::AID-JPLN229>3.0.CO;2-6]

-
Xing, L., Wu, J., Elser, M., Tong, S., Liu, S., Li, X., Liu, L., Cao, J., Zhou, J., El-Haddad, I., Huang, R., Ge, M., Tie, X., Prévót, A.S.H., Li, G. (2019) Wintertime secondary organic aerosol formation in Beijing - Tianjin - Hebei (BTH): contributions of HONO sources and heterogeneous reactions. Atmospheric Chemistry and Physics, 19(4), 2343-2359.
[https://doi.org/10.5194/acp-19-2343-2019]

-
Yan, D., Wu, S., Zhou, S., Tong, G., Li, F., Wang, Y., Li, B. (2019) Characteristics, sources and health risk assessment of airborne particulate PAHs in Chinese cities: A review. Environmental Pollution, 248, 804-814.
[https://doi.org/10.1016/j.envpol.2019.02.068]

-
Yu, G.H., Park, S. (2021) Chemical characterization and source apportionment of PM2.5 at an urban site in Gwangju, Korea. Atmospheric Pollution Research, 12(6), 101092.
[https://doi.org/10.1016/j.apr.2021.101092]

-
Zeng, Y., Cao, Y., Qiao, X., Seyler, B.C., Tang, Y. (2019) Air pollution reduction in China: Recent success but great challenge for the future. Science of The Total Environment, 663, 329-337.
[https://doi.org/10.1016/j.scitotenv.2019.01.262]

-
Zhang, K., Yang, L., Li, Q., Li, R., Zhang, D., Xu, W., Feng, J., Wang, Q., Wang, W., Huang, L., Yaluk, E.A., Wang, Y., Yu, J. Z., Li, L. (2021) Hourly measurement of PM2.5-bound nonpolar organic compounds in Shanghai: Characteristics, sources and health risk assessment. Science of The Total Environment, 789, 148070.
[https://doi.org/10.1016/j.scitotenv.2021.148070]

-
Zheng, B., Zhang, Q., Zhang, Y., He, K.B., Wang, K., Zheng, G.J., Duan, F.K., Ma, Y.L., Kimoto, T. (2015) Heterogeneous chemistry: a mechanism missing in current models to explain secondary inorganic aerosol formation during the January 2013 haze episode in North China. Atmospheric Chemistry and Physics, 15(4), 2031-2049.
[https://doi.org/10.5194/acp-15-2031-2015]

-
Zhou, J., Xing, Z., Deng, J., Du, K. (2016) Characterizing and sourcing ambient PM2.5 over key emission regions in China I: Water-soluble ions and carbonaceous fractions. Atmospheric Environment, 135, 20-30.
[https://doi.org/10.1016/j.atmosenv.2016.03.054]


