Comparison of PM2.5 Monitoring Data Using Light Scattering and Beta Attenuation Methods: A Case Study in Seoul Metro Subway
 ; Byeong-Gyu Park1)
 ; Sang-Woo Lee1)
 ; Jae-Hyung Park1)
 ; Da-Hyun Baek1)
 ; In-Young Choi1)
 ; Ye-Bin Seo1)
 ; Jo-Chun Kim1), *
Abstract
A study on monitoring PM2.5 concentrations at an underground subway station using light scattering and beta attenuation methods was conducted. Six optical particle counters (OPCs), which were representative of the light scattering method and had 16 size channels, were installed at different sampling sites in the waiting room and platforms to compare PM2.5 concentrations, determine PM2.5 /PM10 ratios, and characterize the size distribution based on particle number. In terms of the beta attenuation method, a beta-ray attenuation monitor (BAM) was set up at the platform to compare it with OPCs for one month. It was found that 1h-average PM2.5 concentrations varied at different sampling sites depending on PM composition, while 24h-average PM2.5 concentrations were independent of the sampling sites. There was a significant difference between the means of 1h-average PM2.5 concentrations observed by the BAM and OPC when PM2.5 contributed to less than 50% or higher than 80% of PM10. In contrast, the 24h-average PM2.5 concentrations observed by the BAM and OPC showed the same patterns as each other with an insignificant difference. Therefore, an OPC can be used to monitor the 24h-average PM2.5 concentration in an underground subway station. However, the use of OPC to measure the 1h-average PM2.5 concentration should consider PM composition and other factors. In addition, more frequent calibration is needed on a regular basis.
Keywords:
Particulate matter, Subway, Light scattering, Beta-ray, Fine particles, PM2.51. INTRODUCTION
Subway systems have been widely used in megacities with complex transportation systems for millions of passengers per day to reduce the stress of traffic jams (Lee et al., 2016; Yan et al., 2015). Particulate matter (PM) in metro subway stations (so-called subway PM) has been found to reveal different characteristics compared to ambient PM (Grass et al., 2010). In particular, subway PM comprises polycyclic aromatic hydrocarbons (PAHs) and an abundance of metals such as Fe, Mn, and Cr with their oxides, which can cause adverse health effects, such as DNA damage, oxidative stress in cultured lung cells, or even cancer (Yan et al., 2015; Colombi et al., 2013; Mugica-Álvarez et al., 2012; Grass et al., 2010; Kang et al., 2008). Therefore, PM in subway stations has been well measured and monitored (Son et al., 2021; Lee et al., 2018; Reche et al., 2017; Lee et al., 2016; Byeon et al., 2015; Yan et al., 2015; Park et al., 2014; Colombi et al., 2013; Jung et al., 2012; Kim et al., 2012; Midander et al., 2012; Mugica-Álvarez et al., 2012; Grass et al., 2010; Kang et al., 2008; Kim et al., 2008; Salma et al., 2007; Seaton, 2005; Johansson and Johansson, 2003). For continuous PM monitoring in subway systems, optical particle counters (OPCs) and beta-attenuation monitors (BAMs) have been widely applied (Reche et al., 2017; Lee et al., 2016; Yan et al., 2015; Park et al., 2014; Colombi et al., 2013; Son et al., 2013; Midander et al., 2012). An OPC is a spectrometer based on the light scattering principle. The number of particles can be determined by the frequency of the scattered light and the size of a particle can be evaluated based on the intensity of the scattered light (Denker and Shklovsky, 2013). The BAM was developed to measure the mass concentration of PM based on the gravimetric method and the beta-ray attenuation technique (Shukla and Aggarwal, 2022). The gravimetric method is a primary standard for measuring the mass concentration of PM (US EPA, 2016). In this method, PM is captured by a filter coupled with a low- or high-volume sampler; then, the mass of PM deposited on the filter is checked using the gravimetric method. A beta-ray is a collection of beta particles that are high-energy electrons or positrons emitted from a beta particle source (Shukla and Aggarwal, 2022). Due to this characteristic, beta-rays can be absorbed or reflected or can penetrate a material; therefore, beta-ray are applied to determine the thickness or mass of a material based on the attenuation of beta-ray intensity after passing the material (Shukla and Aggarwal, 2022). Hence, the beta-ray can be used to estimate the mass of PM deposited on a filter called a BAM, instead of using the gravimetric method (Shukla and Aggarwal, 2022). A BAM reveals a higher measurement accuracy than that of an OPC in terms of PM mass. However, a BAM needs a longer sampling time (i.e., a few minutes to 1 hour) to measure the PM than an OPC (i.e., 6 seconds) because it takes time for PM to accumulate on a filter. Thus, the BAM cannot provide real-time measurement data. Furthermore, the BAM cannot measure various PM sizes, unlike the OPC, which may measure particles from 0.1 μm to 30 μm, depending on the type of OPC (Shukla and Aggarwal, 2022; Burkart et al., 2010). The price of a BAM is also higher than that of an OPC.
In the Seoul Metro system in the Republic of Korea, BAMs have been applied to monitor 1h-average and 24h-average PM2.5 concentrations (i.e., PM with a size less than 2.5 μm) at each subway station (Korea Environment Cooperation, 2021). However, usually only one BAM is used on each station platform, but a station is large, generally including one waiting room and two platforms (Korea Environment Cooperation, 2021). Therefore, the PM data from this BAM may be unrepresentative of PM quality in the indoor air of the whole station.
Accordingly, this study was conducted to compare the performance of OPC and BAM in terms of PM2.5 measured in an underground subway station. In addition, the characteristics of PM at different monitoring sites will also be investigated by OPCs coupled with 16 size channels.
2. MATERIALS AND METHODS
2. 1 Experimental Apparatus
A BAM (5028i, Thermo Fisher Scientific, Waltham, Massachusetts, USA) was used as a beta-ray attenuation method for measuring PM2.5 concentration. Its sampling flow rate was 16.67 L/min. The sampling time was 1 hour. Six OPCs (AQM-06, HCTM Co., Ltd., Gyeonggi-do, Republic of Korea) with 16 size channels were used with a light scattering method. Their sampling flow rate was 1.2 L/min and their sampling time varied from 6 s to 24 h. To enable comparison with the BAM, the sampling time of the OPCs was also set to 1 hour. The specifications of the BAM and OPCs used in this study are shown in Table 1. An OPC consists of a small volume chamber, a laser source, and a detector (Denker and Shklovsky, 2013). When a particle passes through a light beam, a part of the light is scattered and a detector measures it. The number of particles can be determined by the frequency of the scattered light and the size of a particle can be evaluated based on the intensity of the scattered light (Denker and Shklovsky, 2013). Through the number of particles, the mass concentration of PM at each size can be calculated with respect to its density and size, as shown in equation (1) (Colombi et al., 2013):
| (1) |
where Cmass is the mass concentration of PM at the particle diameter of d, Cnumber is the number PM at the size of d, ρ is the density of PM at the size of d, and ε is the sampling efficiency.
A BAM consists of a beta-ray source to produce beta particles, a filter holder coupled with a filter tap to collect PM, and a detector to determine the decrease in beta-ray intensity after penetrating the PM layer on the filter (Shukla and Aggarwal, 2022). The mass concentration C of PM can be calculated as shown in equation (2):
| (2) |
where A is the surface area of the filter (cm2), I0 is incident beta-ray intensity (mg/cm2), I is the attenuated beta-ray intensity after passing through the PM layer (mg/cm2), μ is the attenuation coefficient (cm2/mg), Q is the air flow rate (L/min) and t is the sampling time (min).
The BAM and six OPCs were calibrated and certified by the Korea Laboratory Accreditation Scheme. The six OPCs were also calibrated in the same chamber to determine their correlation. The coefficient of determinations (r2) among OPCs was found to be >0.99 for both PM10 and PM2.5.
2. 2 Experimental Method
An underground subway station of line 7 (Sang-dong station) of Seoul Metro was selected to investigate PM2.5 in indoor air. The instruments were set up and operated for several days before data collection from March 15 to April 15, 2021. In this period, the temperature of the station varied from 15.3-21.8°C and relative humidity was 20-70%. The station has two platforms on the B2 floor with screen doors. One BAM was placed on a platform to monitor PM2.5. Six OPCs were installed at six sites to measure PM10 and PM2.5 in the waiting room and platforms. The experimental set-up is presented in Fig. 1. Two OPCs (i.e., OPC_1-1 and OPC_1-2) were installed in the waiting room. Two OPCs (i.e., OPC_2-1 and OPC_2-2) were set up in the platform without a BAM, and two others (i.e., OPC_2-3 and OPC_2-4) were located in the platform with a BAM. The locations of the OPCs and BAM are shown in Fig. 1. The experiment was conducted for one month.
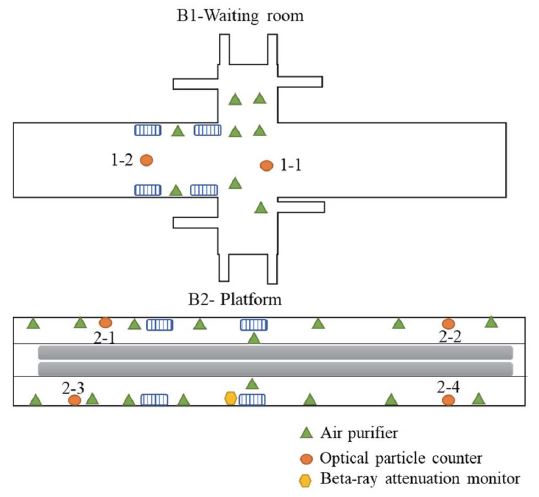
Experimental set-up for investigating PM2.5 and PM10 concentration at an underground subway station.
The 1h-average PM2.5 concentrations observed by the BAM and OPCs were compared for seven consecutive days. The PM2.5/PM10 ratios were calculated to determine the relationship between PM sizes and the correlation between BAM and OPC. The distribution of particle size based on the particle number observed by OPCs was also taken into account. A Fisher’s least significant difference (LSD) procedure was used to compare the mean PM2.5 between the BAM and OPCs at the 95.0% confidence level using MATLAB (Version 9.10.0. 1684407, MathWorks, Inc., Natick, USA). On the other hand, 24h-average PM2.5 concentrations obtained from BAM and OPCs were also considered. All experimental results were illustrated as figures using Microsoft Office Excel 2019 (Excel 2019, Microsoft Cooperation, Redmond, Washington, USA).
3. RESULTS AND DISCUSSION
3. 1 Comparison of 1h-average PM2.5 Concentrations Observed by BAM and OPCs at an Underground Subway Station
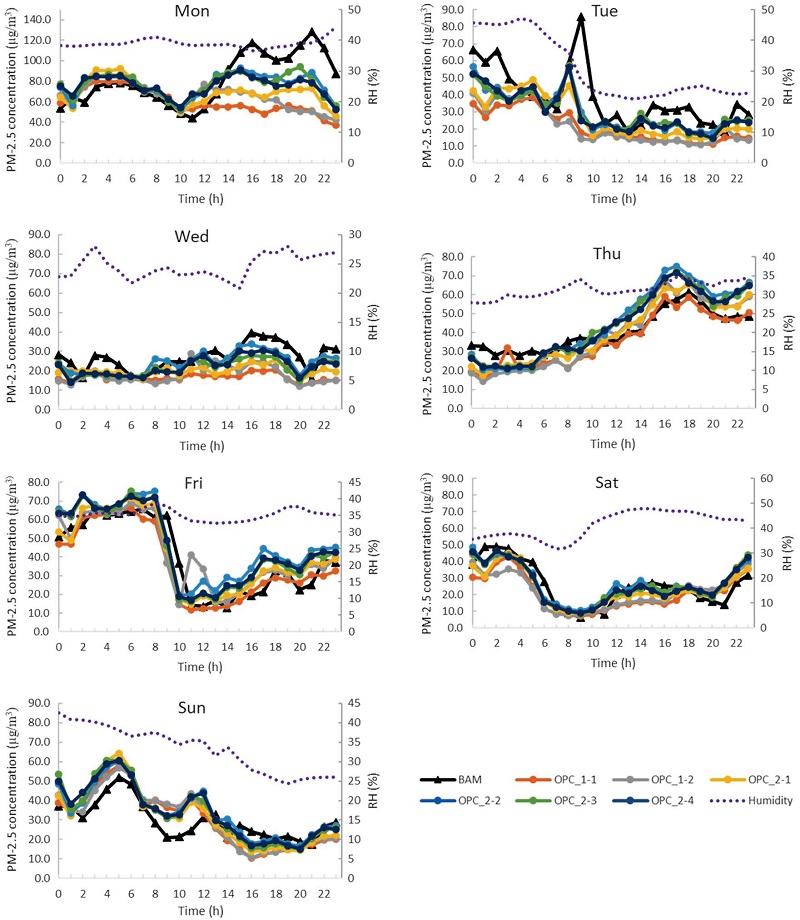
The variations in1h-average PM2.5 concentrations measured by a BAM and six OPCs in the waiting room and platforms for seven days are shown in Fig. 2. As shown in Fig. 2, PM2.5 variations observed from the BAM had a similar pattern to those observed from six OPCs. However, the correlation between PM2.5 concentrations measured by BAM and OPCs differed from Monday to Wednesday but were similar from Thursday to Sunday. To explain this pattern, more data are presented and discussed in the next section. In addition, the PM2.5 concentrations in the platforms revealed unclear patterns not only between rush hours and rest hours but also between weekdays and weekends. Since the platform is connected to the train tunnel, the PM concentration in the platform is generally affected by the train’s operation, which emits abundant particles (Son et al., 2013). However, the subway station in this study had screen doors installed to separate the platform from the tunnel. It was previously reported that the PM level in a platform coupled with screen doors was significantly lower than that in the tunnel, and the correlation of PM levels in the platform and ambient air was high (i.e., 0.6-0.8) (Son et al., 2013). Moreover, many air purifiers were also employed to remove particles from the air in the current station (as shown in Fig. 1). Therefore, unclear PM2.5 patterns between rush hour and rest hour and between weekdays and weekends were observed. In terms of the effect of relative humidity (RH) on OPCs, because all relative humidity values were less than 50% (Fig. 2, dotted line), humidity could not have a significant effect on OPCs. Besides, since the OPCs had heating units on the sampling inlet area, humidity might not be a significant problem in this study.
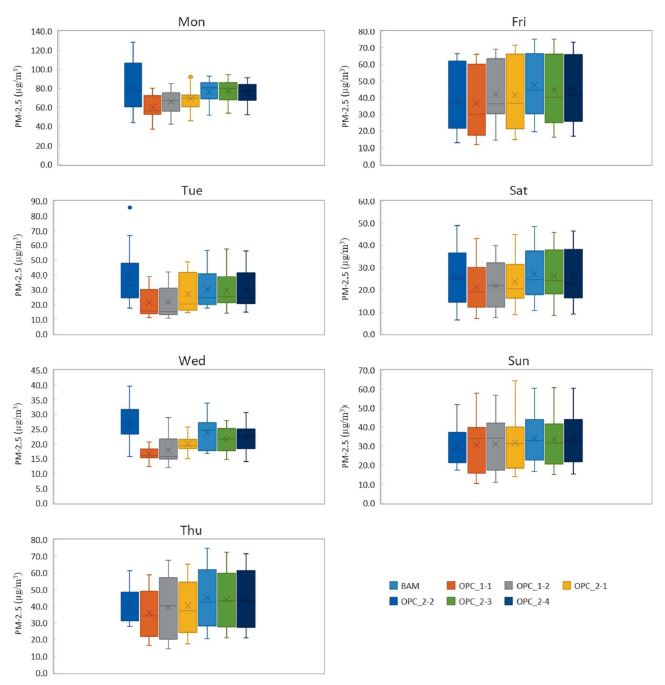
To clearly determine the correlation between PM2.5 measured by BAM and OPCs, PM2.5 concentrations observed from OPC_1-1 and OPC_1-2, OPC_2-1 and OPC_2-2, OPC_2-3 and OPC_2-4, OPC_1-1 and BAM, OPC_2-1 and BAM, and OPC_2-3 and BAM were compared using linear regressions. The results are shown in Table 2. Moreover, Fisher’s LSD procedure was employed to compare the means of different analyzers. A Box-Whisker plot was also illustrated, as shown in Fig. 3, for easy observation of the patterns.
As shown in Fig. 3, the means of 1h-average PM2.5 concentrations obtained from BAM from Monday to Wednesday were significantly higher than those observed from OPCs at all sites. As shown in Table 2, two OPCs on the same floor denoted a good correlation. The correlation of BAM versus OPC_1-1 from Monday to Wednesday showed the lowest correlation (i.e., r2<0.4) due to different floor locations. However, in the same platform, the correlation between BAM and OPC_2-3 was also low from Monday to Wednesday. In contrast, BAM and OPCs showed a good correlation (i.e., r2>0.65 for different floors and r2>0.75 for the same floor) although they were located on different floors. The Fisher’s LSD results for 1h-average PM2.5 concentrations among analyzers confirmed this significant difference between BAM and OPCs from Monday to Wednesday (Table 3).

Fisher’s LSD results for representative comparison of 1h-average PM2.5 concentrations between BAM and OPCs for three days.
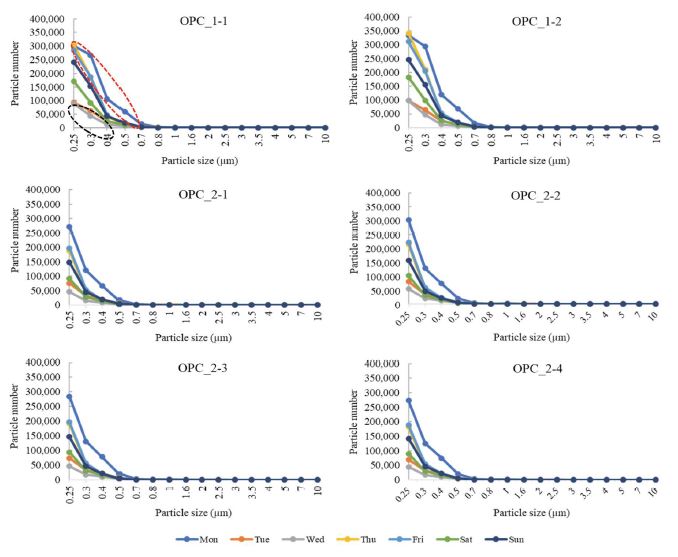
It was previously reported that PM concentration obtained from an OPC could be different from that obtained from gravimetric method because the variation of PM composition results in a difference of its density, which is used to estimate the mass of PM based on the number of PMs (Colombi et al., 2013). Hence, the ratios of PM2.5/PM10 and the distribution of various particle sizes based on particle number were estimated to determine the relationship between PM composition and the correlation between BAM and OPC. As shown in Table 4, PM with sizes less than 2.5 μm contributed 50-80% mass of PM10 from Thursday to Sunday. In contrast, this mass contribution was higher than 80% on Monday and less than 50% on Tuesday and Wednesday. In addition, when the size distribution of particles based on the particle number was investigated, the pattern of particle size from Monday to Wednesday was also different from that on the other days (Fig. 4). As shown in Fig. 4, most particles in this station were less than 0.5 μm based on particle number. The number of particles<0.5 μm observed on Monday (see red dotted circle in Fig. 4) was significantly higher than on the other days. In contrast, the number of particles<0.4 μm observed on Tuesday and Wednesday (see black dotted circle in Fig. 4) was significantly lower than on the other days. This suggests that the difference in PM2.5 between BAM and OPCs depends on particle size.

Average PM2.5/PM10 ratio (%) at the current subway station with respect to various sampling locations and days.
Previous studies have reported that PM2.5/PM10 ratios varied at different underground subway stations (Table 5). Although these ratios varied depending on locations, the contribution of different levels of PM2.5 was generally high. This indicates that when a BAM and an OPC are used to measure PM2.5 at these stations, the correlation between BAM and OPC could be relatively high depending on the composition of PM.
Consequently, the 1h-average of PM2.5 concentrations in an underground subway station varied with the sampling locations. Hence, a PM database observed from only one sampling site might not be representative of PM concentration at Seoul subway stations. In terms of a sampling method, PM2.5 concentrations obtained from OPCs revealed a good correlation with those from BAM in this study when the PM10 comprised 50-80% PM2.5. However, more studies should be carried out to identify a reliable pattern of PM2.5/PM10 ratios. In addition, no OPC was installed next to the BAM to observe particle characteristics. This is a limitation of this study which should be overcome in future works.
3. 2 Comparison of 24h-average PM2.5 Concentrations Observed by BAM and OPCs at an Underground Subway Station
The 24h-average PM2.5 concentrations were investigated for one month, and their variations are depicted in Fig. 5.
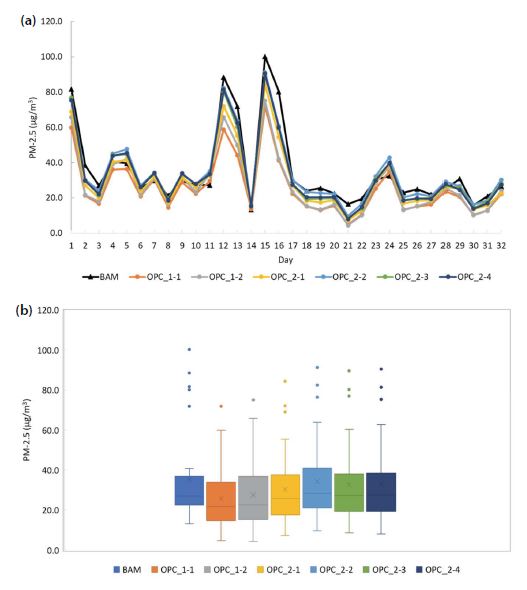
Variations of 24h-average PM2.5 concentrations with respect to BAM and OPCs: (a) daily variations and (b) Box-Whisker plot of one month.
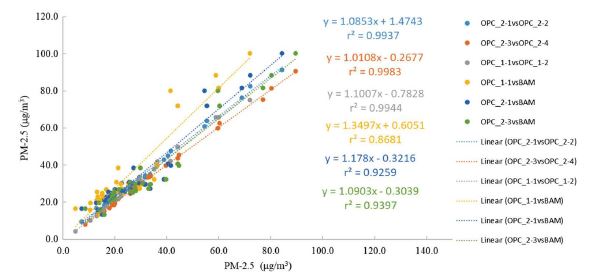
As shown in Fig. 5, the 24h-average PM2.5 concentrations observed from BAM showed a similar pattern to those observed from OPCs in terms of daily variations. Moreover, the mean values of one month were similar among different measurement techniques (Fig. 5b). To clearly demonstrate this pattern, a Fisher’s LSD procedure at 95% confidence for the mean value of each technique was conducted, and linear regressions were also run. The correlation of 24h-average PM2.5 concentrations between BAM and OPCs is shown in Fig. 6.
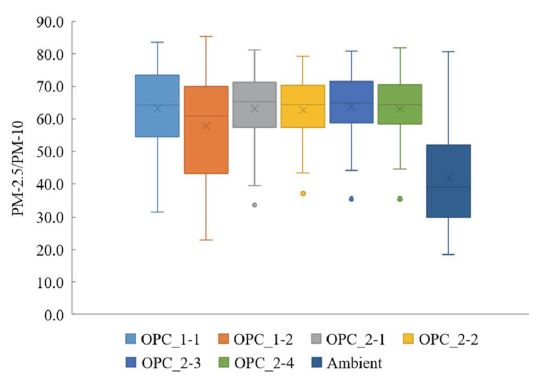
As shown in Fig. 6, although different monitoring techniques were conducted at different sampling locations in the station, 24h-average PM2.5 concentrations revealed a very good correlation between BAM and OPCs, as well as among OPCs. The results of the Fisher’s LSD also confirmed that there was no significant difference between each pair of means because all differences were within the limit of ±9.7. The PM2.5/PM10 ratios based on the 24h-average data were also evaluated. The results are presented as a Box-Whisker plot in Fig. 7.
As shown in Fig. 7, most PM2.5/PM10 ratios were in the range of 50-80%. This pattern was similar to that of 1h-average concentrations, which also showed a good correlation between BAM and OPCs when the PM2.5/PM10 ratios were within 50-80%. In particular, the r2 coefficients between OPC and BAM found in this study were >0.9, which is similar to the correlation between OPCs and gravimetrical method found in another study (i.e., 0.85-0.97) (Colombi et al., 2013). This indicates that OPCs could be used to monitor PM2.5 concentrations in terms of 24h-average at subway stations. Furthermore, 24h-average PM2.5 concentrations with a good correlation among different sampling locations (i.e., waiting room vs. platform) were also found. An analyzer could be used to demonstrate 24h-average PM2.5 concentrations and can be installed at any location in subway stations.
Since the use of 24h-avarage data could not observe the real-time status of air quality to recognize and solve indoor air quality issues in a timely manner, real-time data monitoring is suggested in addition to 1h and 24h-average data. In this case, good calibration OPCs could be used.
4. CONCLUSIONS
PM2.5 concentrations in an underground subway station were investigated with respect to 1h and 24h-averages using OPCs and BAM. Two OPCs were located in a waiting room. Four OPCs were installed in platforms, with two in each platform. PM2.5 concentrations at each sampling site measured by these six OPCs were compared. PM2.5/PM10 ratios were also evaluated to characterize the distribution of PM2.5 to PM10. A BAM was installed in a platform for comparison with the OPC in the same subway station. The experiments were conducted for one month. It was found that the 1h-average PM2.5 concentrations varied among different locations depending on the PM2.5/PM10 ratios. In contrast, the 24h-average PM2.5 concentrations were similar among different sampling locations. In terms of the comparison of BAM and OPC, a significant difference in 1h-average PM2.5 concentrations between BAM and OPC was found when the PM2.5/PM10 ratios were outside the 50-80% range although they were located in the same platform. Therefore, it is suggested that OPCs should be calibrated based on PM characteristics. In contrast, 24h-average PM2.5 concentration observed by the BAM and OPCs did not reveal significant differences. Therefore, this suggests that various analyzers should be used to monitor PM2.5 at different locations in a subway station to correctly demonstrate PM characteristics based on a 1h-average. In addition, when an OPC is used, the PM composition should be considered to compensate for the bias of measurement data. In terms of 24h-average monitoring, an OPC may be used instead of a BAM. However, this study was carried out at only one station for one month, so the results might not be representative of all cases. Thus, further experiments should be conducted in the future at other stations and for longer time periods to investigate PM emission patterns. Moreover, other factors, such as PM size and density should be also taken into account.
Acknowledgments
This paper was written as part of Konkuk University’s research support program for its faculty on sabbatical leave in 2021. This work is financially supported by Korea Ministry of Environment (MOE) Graduate School specialized in Integrated Pollution Prevention and Control Project.
References
-
Burkart, J., Steiner, G., Reischl, G., Moshammer, H., Neuberger, M., Hitzenberger, R. (2010) Characterizing the performance of two optical particle counters (Grimm OPC1.108 and OPC1.109) under urban aerosol conditions. Journal of Aerosol Science, 41, 953-962.
[https://doi.org/10.1016/j.jaerosci.2010.07.007]

-
Byeon, S.-H., Willis, R., Peters, T. (2015) Chemical Characterization of Outdoor and Subway Fine (PM2.5-1.0) and Coarse (PM10-2.5) Particulate Matter in Seoul (Korea) by Computer-Controlled Scanning Electron Microscopy (CCSEM). International Journal of Environment Research Public Health, 12, 2090-2104.
[https://doi.org/10.3390/ijerph120202090]

-
Cheng, Y.-H., Lin, Y.-L., Liu, C.-C. (2008) Levels of PM10 and PM2.5 in Taipei Rapid Transit System. Atmospheric Environment, 42, 7242-7249.
[https://doi.org/10.1016/j.atmosenv.2008.07.011]

-
Colombi, C., Angius, S., Gianelle, V., Lazzarini, M. (2013) Particulate matter concentrations, physical characteristics and elemental composition in the Milan underground transport system. Atmospheric Environment, 70, 166-178.
[https://doi.org/10.1016/j.atmosenv.2013.01.035]

-
Denker, B., Shklovsky, E. (2013) Handbook of Solid-State Lasers. Woodhead Publishing Limited.
[https://doi.org/10.1533/9780857097507]

-
Grass, D.S., Ross, J.M., Family, F., Barbour, J., James Simpson, H., Coulibaly, D., Hernandez, J., Chen, Y., Slavkovich, V., Li, Y., Graziano, J., Santella, R.M., Brandt-Rauf, P., Chillrud, S.N. (2010) Airborne particulate metals in the New York City subway: A pilot study to assess the potential for health impacts. Environmental Research, 110, 1-11.
[https://doi.org/10.1016/j.envres.2009.10.006]

-
Johansson, C., Johansson, P.-Å. (2003) Particulate matter in the underground of Stockholm. Atmospheric Environment, 37, 3-9.
[https://doi.org/10.1016/S1352-2310(02)00833-6]

-
Jung, H.-J., Kim, B., Malek, M.A., Koo, Y.S., Jung, J.H., Son, Y.-S., Kim, J.-C., Kim, H., Ro, C.-U. (2012) Chemical speciation of size-segregated floor dusts and airborne magnetic particles collected at underground subway stations in Seoul, Korea. Journal of Hazardous Materials, 213-214, 331-340.
[https://doi.org/10.1016/j.jhazmat.2012.02.006]

-
Kang, S., Hwang, H., Park, Y., Kim, H., Ro, C.-U. (2008) Chemical Compositions of Subway Particles in Seoul, Korea Determined by a Quantitative Single Particle Analysis. Environmental Science & Technology, 42, 9051-9057.
[https://doi.org/10.1021/es802267b]

-
Kim, K.-H., Ho, D.X., Jeon, J.-S., Kim, J.-C. (2012) A noticeable shift in particulate matter levels after platform screen door installation in a Korean subway station. Atmospheric Environment, 49, 219-223.
[https://doi.org/10.1016/j.atmosenv.2011.11.058]

-
Kim, K.Y., Kim, Y.S., Roh, Y.M., Lee, C.M., Kim, C.N. (2008) Spatial distribution of particulate matter (PM10 and PM2.5) in Seoul Metropolitan Subway stations. Journal of Hazardous Materials, 154, 440-443.
[https://doi.org/10.1016/j.jhazmat.2007.10.042]

- Korea Environment Cooperation (2021) In Air [WWW Document]. URL https://www.inair.or.kr/info, /
-
Lee, E.-S., Park, M.-B., Lee, T.-J., Kim, S.-D., Park, D.-S., Kim, D.-S. (2016) Characterizing Par ticle Matter on the Main Section of the Seoul Subway Line-2 and Developing Fine Particle Pollution Map. Journal of Korean Society Atmospheric Environment, 32, 216-232.
[https://doi.org/10.5572/KOSAE.2016.32.2.216]

-
Lee, Y., Lee, Y.-C., Kim, T., Choi, J., Park, D. (2018) Sources and Characteristics of Particulate Matter in Subway Tunnels in Seoul, Korea. International Journal of Environment Research Public Health, 15, 2534.
[https://doi.org/10.3390/ijerph15112534]

-
Li, T.-T., Bai, Y.-H., Liu, Z.-R., Li, J.-L. (2007) In-train air quality assessment of the railway transit system in Beijing: A note. Transportation Research Part D: Transport and Environment, 12, 64-67.
[https://doi.org/10.1016/j.trd.2006.11.001]

-
Midander, K., Elihn, K., Wallén, A., Belova, L., Karlsson, A.-K.B., Wallinder, I.O. (2012) Characterisation of nano- and micron-sized airborne and collected subway particles, a multi-analytical approach. Science of The Total Environment, 427-428, 390-400.
[https://doi.org/10.1016/j.scitotenv.2012.04.014]

-
Mugica-Álvarez, V., Figueroa-Lara, J., Romero-Romo, M., Sepúlveda-Sánchez, J., López-Moreno, T. (2012) Concentrations and properties of airborne particles in the Mexico City subway system. Atmospheric Environment, 49, 284-293.
[https://doi.org/10.1016/j.atmosenv.2011.11.038]

-
Park, D.-U., Ha, K.-C. (2008) Characteristics of PM10, PM2.5, CO2 and CO monitored in interiors and platforms of subway train in Seoul, Korea. Environment International, 34, 629-634.
[https://doi.org/10.1016/j.envint.2007.12.007]

-
Park, J.H., Woo, H.Y., Park, J.C. (2014) Major factors affecting the aerosol particulate concentration in the underground stations. Indoor Built Environment, 23, 629-639.
[https://doi.org/10.1177/1420326X12466875]

-
Reche, C., Moreno, T., Martins, V., Minguillón, M.C., Jones, T., de Miguel, E., Capdevila, M., Centelles, S., Querol, X. (2017) Factors controlling particle number concentration and size at metro stations. Atmospheric Environment, 156, 169-181.
[https://doi.org/10.1016/j.atmosenv.2017.03.002]

-
Salma, I., Weidinger, T., Maenhaut, W. (2007) Time-resolved mass concentration, composition and sources of aerosol particles in a metropolitan underground railway station. Atmospheric Environment, 41, 8391-8405.
[https://doi.org/10.1016/j.atmosenv.2007.06.017]

-
Seaton, A. (2005) The London Underground: dust and hazards to health. Occupational & Environmental Medicine, 62, 355-362.
[https://doi.org/10.1136/oem.2004.014332]

-
Shukla, K., Aggarwal, S.G. (2022) A Technical Overview on Beta-Attenuation Method for the Monitoring of Particulate Matter in Ambient Air. Aerosol and Air Quality Research, 22, 220195.
[https://doi.org/10.4209/aaqr.220195]

-
Son, J., Kim, K., Kwon, S., Park, S.-M., Ha, K., Shin, Y., Ahn, M., Cho, S., Shin, J., Shin, Y., Lee, G. (2021) Source Quantification of PM10 and PM2.5 Using Iron Tracer Mass Balance in a Seoul Subway Station, South Korea. Aerosol and Air Quality Research, 21, 200573.
[https://doi.org/10.4209/aaqr.200573]

-
Son, Y.-S., Salama, A., Jeong, H.-S., Kim, S., Jeong, J.-H., Lee, J., Sunwoo, Y., Kim, J.-C. (2013) The Effect of Platform Screen Doors on PM10 Levels in a Subway Station and a Trial to Reduce PM10 in Tunnels. Asian Journal of Atmospheric Environment, 7, 38-47.
[https://doi.org/10.5572/ajae.2013.7.1.038]

- US EPA (United States Environmental Protection Agency) (2016) Quality Assurance Guidance Document 2.12. Monitoring PM2.5 in Ambient Air Using Designated Reference or Class I Equivalent Methods. USA.
-
Yan, C., Zheng, M., Yang, Q., Zhang, Q., Qiu, X., Zhang, Y., Fu, H., Li, X., Zhu, T., Zhu, Y. (2015) Commuter exposure to particulate matter and particle-bound PAHs in three transportation modes in Beijing, China. Environmental Pollution, 204, 199-206.
[https://doi.org/10.1016/j.envpol.2015.05.001]

