Identification of Fine Dust in Schools through Comprehensive Chemical Characterization
Abstract
The chemical characteristics of particulate matters collected from 53 schools in 2019 through 2022 were closely investigated to determine the main sources of classroom PM2.5. On average, indoor PM2.5 measured during class hours distributed from 3.3 μg/m3 to 45.97 μg/m3, and it consisted of 45% of ions, 33% of carbons, 17% of metals and others. The average indoor-to-outdoor ratio (I/O) of PM2.5 was 0.73. Values for I/O ranged from 0.6 to 0.91 for inorganic elements; 0.3 to 0.8 for ions; 0.50 to 2.69 for elemental carbons (EC), and 0.52 to 8.50 for organic carbons (OC). The linear correlation of indoor EC with concentrations of K+ and NO3- indicates that the contribution of combustion-related sources to classroom PM2.5 is significant in roadside schools. The findings from this study should help establish construction guidelines for urban schools near high-traffic areas.
Keywords:
Indoor air quality, PM2.5, I/O ratio, School environment, Chemical composition1. INTRODUCTION
Indoor PM2.5 is associated with adverse health effects, and has become a serious concern in school classrooms where lower-grade students are taught. Growing children are sensitive to respiratory and pulmonary stress, and vulnerable to cognitive functional deficits particularly after long-term exposure to fine particulates, including PM10 and PM2.5 (Zhang et al., 2006). Such particulates can include harmful species such as heavy metals, ions, carbonaceous matter, and bio-organisms. One study reported that young children attending schools in high-traffic areas experienced slower cognitive development compared with children in a less-polluted area (Sunyer et al., 2015).
The sources of fine particulate matter in classrooms in the absence of conventional sources such as combustion and manufacturing operation have yet to be widely studied. Although research targeting elementary schools has occasionally been conducted (Matta et al., 2019), few studies have characterized the sources of school PM2.5 because access to schools is generally limited (Heo et al., 2021; Bennett et al., 2019; Xu et al., 2015). The air quality of a school playground, which is closely related to classroom air quality, is influenced by the location of the school and the features of the playground such as artificial turf or soil. According to a study of urban schools by Lee et al. (2013), black carbon in main streets used by students to walk to school, where they are constantly exposed to vehicle exhaust gases, and in playgrounds ranged from 6.43 μg/m3 to 3.01 μg/m3. Levels of black carbon, which is classified as a reference material for diesel combustion, in the atmosphere correlated with the distribution of PM2.5 (U.S. EPA, 2012). A study of urban schools in the northeastern United States found lower concentrations of PM2.5 indoors compared with outdoors, with 41% linked to secondary pollution (Matta et al., 2019).
The main source of indoor PM2.5 is infiltration of outdoor particulates through crevices in windows and doors (Shi et al., 2017; Hodas et al., 2016). A study carried out in Iran revealed higher concentration of mean indoor PM2.5 compared with the outdoors, but a distinctive correlation with outdoor levels was still observed (Mohammadyan et al., 2017). The amount of indoor emissions cannot be ignored depending on the content of the class, shoe-wearing habits and other student’s activities, building condition and distance from the kitchen. Not only fine dust, but also the origin of harmful substances contained in particulate matter is an important concern. The sources of indoor pollutants are rarely identified although this is a critical step in part of choosing mitigation measures to protect occupants from exposure.
While most previous studies focused on simple massbased concentrations of fine dust inside and outside schools, this study attempted to identify the source of classroom PM2.5 based on a comprehensive chemical characterization for many schools across the nation. Quantitative PM2.5 levels inside and outside schools were first analyzed, chemical properties were characterized, and the relative ratio of indoor-to-outdoor (I/O) concentrations was evaluated to shed light on the air quality of local schools and verification of the sources of indoor PM2.5.
2. METHODS
2. 1 Study Design
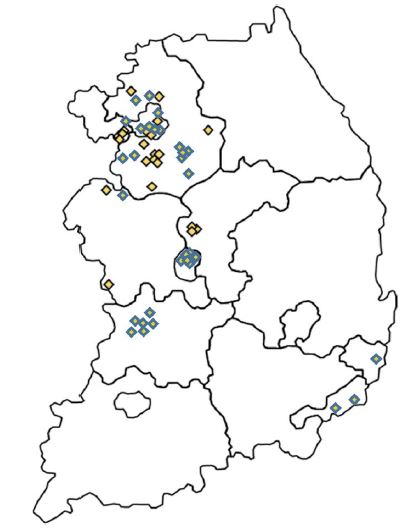
As shown in Fig. 1, this study involved 53 schools in areas of South Korea with relatively severe air pollution. Depending on the outdoor quality, school faculty staff operate mechanical ventilation systems to ensure adequate air exchange or run portable air purifiers during classes, and occasionally clean floors with vacuum cleaners. The Korean government has provided air purifiers to all schools, and newly built schools are typically equipped with central ventilation systems.
Our investigation of indoor air quality required no separate controls. Samples were collected during 4 school days in 3 classrooms and playgrounds at each school from October, 2019 to June, 2022.
2. 2 Sampling and Analysis
Sampling and analyses were carried out according to the National Guideline of the Ministry of Environment. Mini-volume air samplers (Model BMW 2500, Total Eng., Seoul, Korea) with an impactor classifying 2.5 μm or 10 μm-particles were used to collect the PM2.5 and PM10 at a height 1.2-1.5 m above the floor. Outdoor sampling was conducted in the vicinity of playgrounds. Collection was controlled by an electrical timer, focusing on the class time. For example, simultaneous indoor and outdoor sampling began at approximately 8:30 a.m., which was 30 min before the first class of the day, and ended at 3:30 p.m., approximately 30 min after the last class of the day. A total of 179 indoor and 61 outdoor samples, excluding field blanks, were collected for this study.
Particle mass was determined gravimetrically by an electronic microbalance (Cubis II micro-balance, Seoul, Korea) with a resolution of 1 μg. A Teflon filter (Anow, Beijing, China) for metals and a quartz filter for the analysis of ions and carbons (47 mm diameter; QM-A1851, Whatman, England) were inserted into the dust sampler, respectively. The quartz filters were baked at 700°C for 1 hour, and stored in a petri dish at room temperature until sampling. Chemical speciation of indoor PM was performed for a large array of elements and components using a range of instrumental techniques on sub-sampled fractions of the collected samples (Heo et al., 2021).
The bulk carbonaceous content of the PM2.5 such as organic carbon (OC) and elemental carbon (EC) was quantified with a Thermal/Optical Transmittance analyzer (Sunset Lab., USA). The concentration of OC was measured in a helium atmosphere at 31°C to 840°C, and the EC was measured in an oxygen atmosphere at 550°C to 870°C. One punch of 1.5 cm2 filter paper with dust was directly analyzed following a protocol described by the National Institute for Occupational Safety and Health (NIOSH 5040). Although this study did not use a denuder for VOCs screening, positive sampling artifact was minimized through a simultaneous analysis with a blank test filter. In addition, 10% of total sampled filters were re-analyzed to confirm precision. As result of the sucrose test and duplication test, accuracy (100±2%) and relative percent differences (RPD) (100±3%) were confirmed.
Ions were extracted from collected dust using a quartz filter in an ultrasonic bath. Five cations (Na+, NH4+, K+, Ca2+, Mg2+) and three anions (Cl-, NO3-, SO42-) were analyzed using ion chromatography (Metrohm 930 & 883, Switzerland). Table 1 summarizes the detailed ion analysis condition. In order to verify the reliability of the low concentration data, target elements were repeatedly analyzed 7 times to evaluate MDL (method detection limit). The RPD of anions (Cl-, NO3-, SO42-) was 0.4% to 1.0%, and the MDL (6 degree of freedom, 99% confidence level) was 0.001 mg/L to 0.002 mg/L. The RPD of the cation (Na+, NH4+, K+, Ca2+, Mg2+) was 0.2% to 3.2%, and the lower limit of measurement (6 degrees of freedom, 99% confidence level) was 0.001 mg/L to 0.004 mg/L.
Ten heavy metal components (V, Cr, Mn, Ni, Cu, Zn, Pb, Fe, As, Se) and 11 inorganic elements (Na, Mg, Al, Si, S, Cl, K, Ca, Ti, Ba, Br) were quantitatively analyzed by Energy Dispersive X-Ray Fluorescence spectrometry (ED-XRF, ARL QUANT’X High Performance ED-XRF, Thermo Inc, USA). The RPD was 0.002% to 0.41%, and the MDL (degree of freedom 6, confidence level 99%) was 0.12 ng/cm2 to 23.8 ng/cm2.
Statistical analyses, including the selection of associated plots and confidence intervals were performed using Microsoft Excel and SPSS (Ver. 25, SPSS Inc. USA) software. The statistical significance for school classrooms and outdoor concentrations of PM were evaluated using T-test. Coefficients of determination (R2) were derived through regression analysis to estimate the relationship between variables. In general, the closer the value of R2 was to 1, the greater the correlation between independent and dependent variables.
3. RESULTS AND DISCUSSION
3. 1 PM2.5 Level of Classroom Indoors
Table 2 lists the average concentration, standard deviation, and concentration range for PM2.5 and the chemical compounds measured in the classrooms and playgrounds of test schools. Concentrations of PM2.5 found in all classrooms and schools ranged from 3.3 to 46.0 μg/m3 and 3.8 to 70.5 μg/m3, respectively. Their average concentration calculated for each school were 20.7±7.7 μg/m3 for 179 classrooms and 28.5±14.8 μg/m3 for 61 school play grounds including duplicate measurements, which indicates higher values outdoors than indoors (p<0.001). The amount of PM2.5 measured indoors was less than that measured outdoors as the I/O ratio of lower than 1.0 in almost all school classrooms indicates. Nevertheless, this is higher compared with that in ordinary local apartments (0.13-0.37) (Park et al., 2021). This result means that children are spending more time in higher levels of fine dust at school than at home.

Statistical mass concentrations of PM2.5, carbon, ions and inorganic elements inside and outside classrooms during the sampling period.
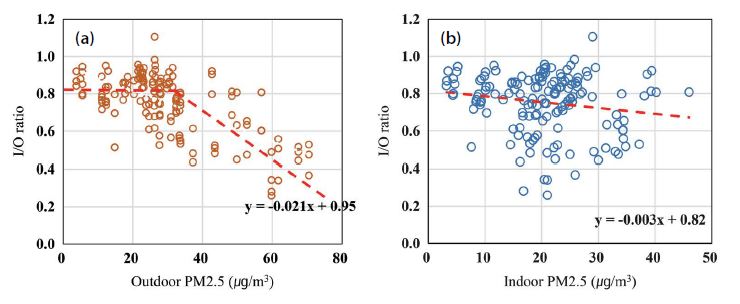
According to a linear regression for overall PM2.5 dataset by space (Fig. 2), the respective slopes of the I/O ratio for PM2.5 outdoor and indoor were -0.021 and -0.003. Both exhibited a decreasing tendency for PM2.5 concentration at each space, but a steeper gradient for outdoor levels. In other words, indoor PM2.5 was strongly correlated with corresponding outdoor PM2.5 concentrations. However, a close examination of the plot in Fig. 2(a) revealed that the relationship with the outdoors was almost constant up to 32-35 μg/m3 despite consistent increases in outdoor levels. Over such a threshold value, close to the National Guideline (35 μg/m3), teachers and school administrators operated air purifiers according to the air quality management protocol with air quality indices. At the same time, most classrooms kept their windows and doors closed. Strict management appears to become more thorough as the outside air quality deteriorates.
However, an increase in indoor PM2.5 led to a slight decrease of I/O values as shown in Fig. 2(b). Because PM2.5 has a high penetration rate from the outside, when the outdoor concentration rose, the level inside must also have increased. A decreasing slope reflects that indoor concentrations did not increase as much as they did outdoors even when high concentration events occurred.
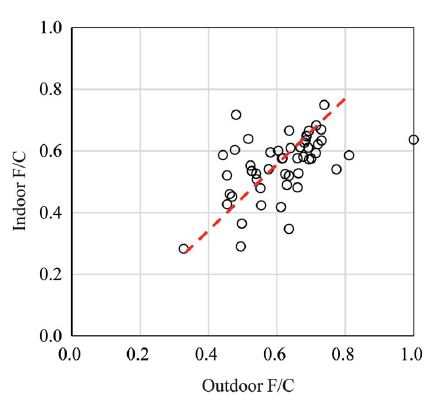
This phenomenon was confirmed by comparing F/C values (the relative ratio of fine particle (PM2.5) to coarse particle (PM10)) inside and outside the classroom. As can be seen in Fig. 3, while indoor F/C varied from 0.28 to 0.75, 0.33 to levels of 1.0 were found in outdoors. This indicates that there were relatively more fine particles in the outside air than in the classrooms. The overall average F/C was 0.9. Although infiltration of PM2.5 was higher than that of PM10, the lower F/C inside suggests that some of PM10 was consistently generated indoors. Student activities indoors may have generated more PM10 than PM2.5 as seen in open literatures (Pallarés et al., 2019; Lim et al., 2010).
3. 2 Compositional Analysis
The correlation coefficient of the I/O ratio was evaluated from average concentrations of chemical components such as inorganic elements, ions and carbon. Their I/O values could be used to trace potential sources of fine particulate matters across classrooms and outside (Ho et al., 2004).
Particulate matters in the urban atmosphere is composed largely of ionic constituents, carbon, metallic elements, and other components (Park et al., 2022). Table 2 summarizes the average concentration of chemical compounds measured in the school classrooms and playgrounds. The average total carbon (OC+EC) concentrations were 9.21±1.5 μg/m3 and 6.4±1.3 μg/m3 in classrooms and outdoors, respectively. The concentrations for 8 ionic species for indoors and outdoors were 6.9±3.9 μg/m3 and 11.4±8.8 μg/m3, respectively. The concentration for 21 elements was 3.6±1.97 μg/m3 and 4.6±3.1 μg/m3 in classrooms and outdoors, respectively.
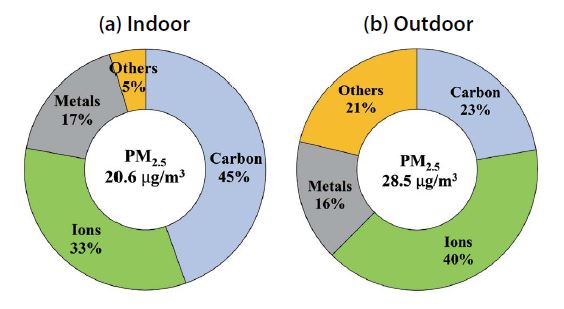
According to the summary of the chemical composition of each particle in Fig. 4, on average, school PM2.5 was composed of carbon (45% and 23%), ions (33% and 40%), metals (17% and 16%) and other substances indoors and outdoors, respectively. The sum of carbon and ions accounted for 78%, which was greater than that of the outdoors, 63%. Outdoor PM2.5 absorbed relatively more substances including unidentified components such as oxygen, hydrogen and moisture or trace elements such as fluorine and bromine compounds. There was an obvious difference in indoor and outdoor PM2.5, the compositional diversity was higher in outdoor PM2.5, and the highest concentrations of carbonaceous matter was found indoors. The components of PM10 were relatively consistent indoors (35%, 21%, 20%, and 24% for carbon, ions, metals and others respectively) and outdoors (18%, 31%, 22% and 29% for carbon, ions, metals, and others, respectively). Overall, the difference in the components contained in PM2.5 inflowing from the outside appeared larger, likely because the large specific area of tiny particles in this mode allowed for the absorption of more OC generated in the classroom. Because PM10 partially generated in indoors originates from resuspended particles deposited on the floor, the difference in chemical composition between indoors and outdoors was not significant.
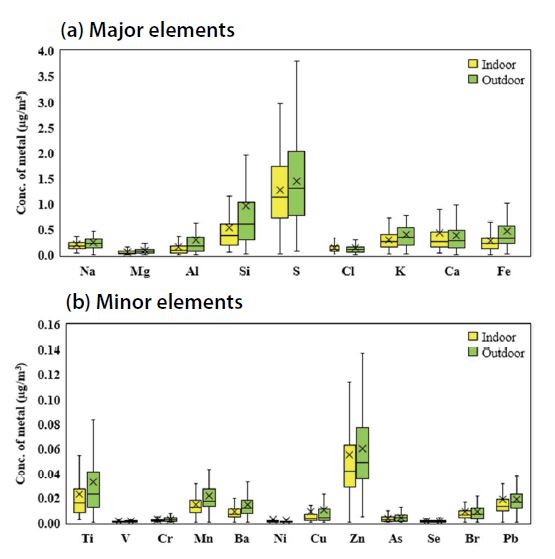
In this study, 21 species of inorganic and metallic elements, including crustal and trace elements, were precisely analyzed and utilized to verify the emission source. Inorganic chemical species except outliers are summarized in Fig. 5. Average concentrations for all samples were highest for S (1.285 μg/m3), Si (0.546 μg/m3), Ca (0.448 μg/m3), K (0.304 μg/m3), Fe (0.279 μg/m3), and Al (0.157 μg/m3), followed sequentially by Zn (0.056 μg/m3)>Ti (0.023 μg/m3)>Pb (0.019 μg/m3)>Mn (0.014 μg/m3).
The mean I/O ratios for average concentrations of major elements were 0.89, 0.56, 0.58, 0.77, 1.17, and 0.52 for S, Si, Fe, K, Ca and Al. Although there were large differences depending on the school conditions, the mean I/O of PM2.5 for all schools was 0.73, and chemical elements showed the distribution from 0.52 to 1.17. Similar results were found for trace elements including heavy metals such as Ti, V, Cr, Mn, Ni, Cu, Zn, As, Se, Pb presented for reference in Fig. 5. Although the absolute amount of these trace elements was much less than that of the major elements, the distribution patterns were similar and the I/O ranged from 0.61 to 1.35. Considering the chemical composition of PM2.5, the ratio between indoor and outdoor levels were similar. Most of the components appeared at high concentrations in outdoor samples, except those associated with Ci, Ca, Ni, and Cu, which implies the presence of indoor chlorine sources.
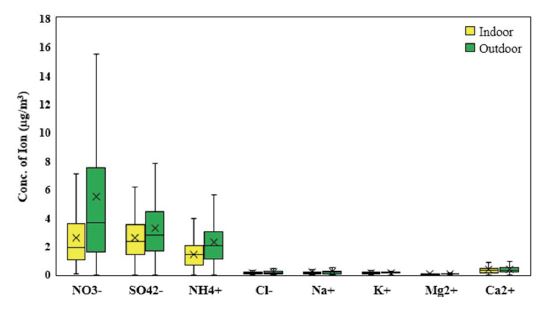
According to ion analysis in Fig. 6, PM2.5 contains a large amount of secondary ion species such as nitrates, sulfates, and ammonium, and trace ions of calcium, sodium, and chlorine. This is a typical chemical characteristic of PM2.5 in large cities (Han and Kim, 2015). Urban atmospheric nitrates and sulfates are typical anthropogenic species formed by the combustion gases. Ammonium ions, a typical alkaline aerosol in the atmosphere, exist as a salt of nitrate and sulfate (Tang et al., 2016). Since this study conducted primarily in urban schools, ions of marine origin such as Mg, K and Ca as well as chlorine were found at relatively low levels.
The I/O ratios of ion species averaged 0.74, which is close to that of the overall PM2.5 ratio (approximately 0.73). In particular, nitrate ions (NO3-) were found more often in outside than inside, with an I/O of 0.47. This can be interpreted as a positive result as nitrate ions, originating from various combustion sources with high hazardousness, maintained a relatively low level indoors. However, various combustion sources cause air pollution around schools.
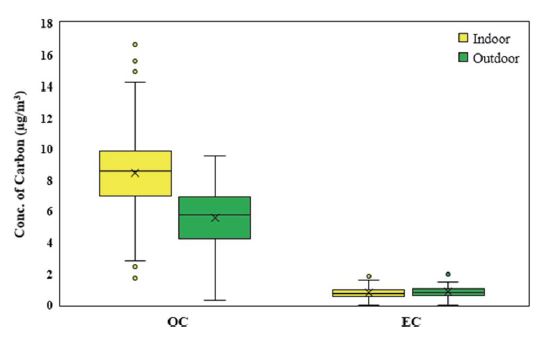
Due to its hazardous nature, carbonaceous matter has been subject to considerable research. Fig. 7 summarizes the concentrations of each type of carbon materials, such as OC and EC involved in PM2.5. Outdoor EC was maintained at an average of 0.83 μg/m3, which is almost the same level as indoors (0.77 μg/m3). The proximity of the I/O value of EC to 1.0 implies that the amount of EC contained in PM2.5 found indoors and outdoors would be similar. The distribution range was also similar indoors (maximum of 1.83 μg/m3) and outdoors (maximum of 1.96 μg/m3). In school classrooms, this indicates that most of the indoor PM2.5 is coming from outside.
On the other hand, OC was significantly high indoors, at up to 16.6 μg/m3, with an I/O average of 1.62 for all schools, and a wide distribution among classrooms. In addition to the outside, there are multiple indoor sources of OC such as markers, coloring tools, stationary, micro debris of plastics and synthetic fibers, cosmetics, and volatile OC originating from hand sanitizer and classroom disinfection agents, which were used heavily during the COVID-19 pandemic.
The average outdoor OC-to-EC ratio (OC/EC) was on 6.71 in PM2.5, similar to that of an urban atmospheric condition (Xu et al., 2015). However, OC/EC data for the classroom (approximately 11.2) suggests that OC is a major constituent of PM2.5 as discussed earlier. Considering the carbon content (Fig. 4), OC is estimated to account for 40.9% of the indoor PM2.5 mass. The possibility of secondary aerosols containing hydrocarbons and nitrates or sulfates in the classroom can also be inferred (Gray et al., 1986).
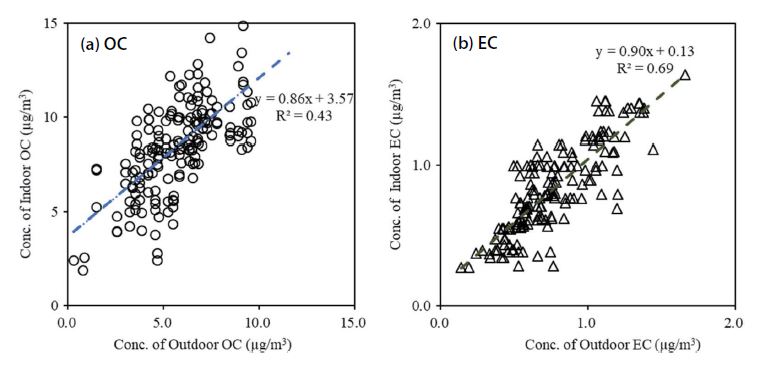
Fig. 8 shows the correlation between OC and EC concentrations measured outdoors and indoors. The respective determination coefficients (R2) of OC and EC were 0.43 and 0.69. High OC concentrations in school classrooms proves that OC levels are due not only to inflow of outside air but also to indoor sources. In particular, the fact that the intercept of the y-axis is 3.57 μg/m3, not the origin, proves that OC was generated and exists in the classroom. Whilst, the slope of EC for all the data is 0.90, and the regression line passes near the origin. It thereby can be concluded that the indoor concentration of EC with no emission source inside inevitably has a close correlation with external conditions.
3. 3 Tracing Emission Sources
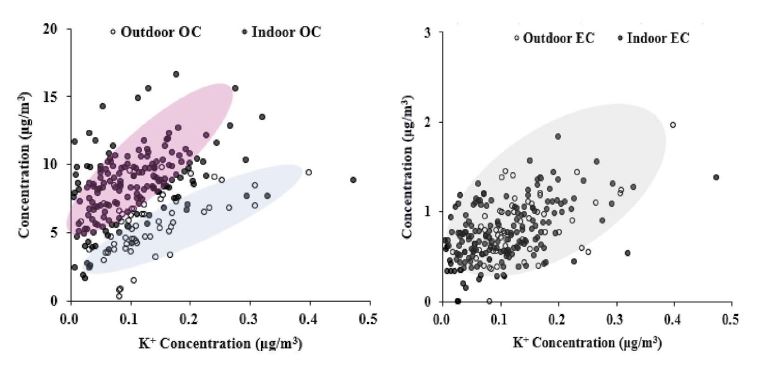
Potassium ions in the atmosphere are known to be released in large quantities during the burning of biomass, and it has been estimated that they share a major emission source with EC and OC (Oh et al., 2009; Duan et al., 2004). As discussed earlier, the indoor EC concentrations were similar to those of outdoor, by reaching an I/O of 0.96, whereas indoor concentrations of OC were much higher than those of outdoors with an average, 1.62. As shown in Fig. 9, the relative increase rate of OC for potassium concentration was 21 for indoor OC and 17 for outdoor. In addition, the coefficient of determination was 0.26 for indoor OC and 0.33 for outdoor. Thus, it can be inferred that OCs are more diversely distributed in each classroom.
Since regular burning activities do not occur in the classroom, almost all the potassium comes from outside. The correlation between EC and K+ showed no significant difference in between indoors and outdoors, of which coefficients for each space appeared relatively low at 0.14 and 0.18. However, the increase in EC in outdoor air (2.2) was slightly higher than that in indoor air (1.6).
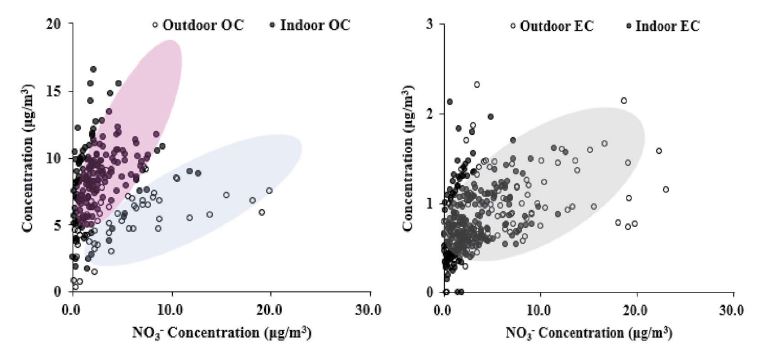
Nitrate ions are emitted from various combustion sources in addition to the agricultural sector, and a large amount exists in the atmosphere in the form of secondary aerosols (Oh et al., 2009). The emission sources of nitrate ions also overlap with those of carbon. The amount of nitrate ions contained in outdoor PM2.5 was 0.12-30.2 μg/m3, which is relatively high compared with those of OC and EC, which have respective distributions of 0.29-9.55 μg/m3 and 0.27-1.96 μg/m3. Approximate correlation between NO3- and OCs measured outdoors and indoors showed a more vivid difference than potassium. That is, the increase rates of OC for nitrate ion was more than twice as high as 0.42 and 0.24. Whilst, the difference in the relative increase rate of ECs was not large, 0.05 and 0.03 for indoor and outdoor, respectively. For reference, the reason that nitrate ions are found more in outdoor air (max. 23 μg/m3) than indoors (max. 12.6 μg/m3) is presumed to be because the permeation rate through classroom walls and windows is low according to the characteristics of nitrates based on formation sources.
4. CONCLUSIONS
This study monitored the concentrations of PM2.5 and its chemical species to identify the emission sources at 53 urban schools. The average indoor PM2.5 level, 20.7 μg/m3 was lower than those reported in 39 schools throughout Barcelona, Spain 37 (range: 13-84) μg/m3, but higher than that of a New Zealand school (6.9 μg/m3).
Indoor activity in the school classroom affects PM10 more than PM2.5. A close examination of the chemical constituents of PM2.5 revealed that 85.5% of PM2.5 was originated from the outside, and the rest was arisen from the inside such as organic carbon matters and coincident generation with PM10. Screening a certain amount of fine dust penetrating through windows and doors and the operation of air purifiers kept concentrations of indoor PM2.5 lower than those of the outdoors. The average organic carbon (OC) concentration indoor was 8.5 μg/m3 larger than the outdoor (5.6 μg/m3). The average values of OC/EC were 11.1 indoors and 6.8 outdoors. The average EC concentration was 0.77 μg/m3 and 0.83 μg/m3 for indoors and outdoors, respectively.
In addition to sulfur, a typical urban air pollutant, the other major elemental components of classroom PM2.5 were silicon, iron, potassium, calcium and aluminum, indicating a crustal origin. The linear dependency of classroom elemental carbon on K+ and NO3- implies that school indoor PM2.5 is significantly influenced by a variety of combustion emissions, particularly including car exhausts.
Acknowledgments
This work was supported by the National Research Foundation of Korea (NRF) grant funded by the Korea government (MSIT, MOE) and (No. 2019M3E7A1113077).
References
-
Bennett, J., Davy, P., Trompetter, B., Wang, Y., Pierse, N., Boulic, M., Phipps, R., Howden-Chapman, P. (2019) Sources of indoor air pollution at a New Zealand urban primary school; a case study. Atmospheric Pollution Research, 10, 435-444.
[https://doi.org/10.1016/j.apr.2018.09.006]

-
Duan, F., Liu, X., Yu, T., Cachier, H. (2004) Identification and estimate of biomass burning contribution to the urban aerosol organic carbon concentrations in Beijing. Atmospheric Environment, 38(9), 1275-1283.
[https://doi.org/10.1016/j.atmosenv.2003.11.037]

- Gray, H.A. (1986) Control of atmospheric fine primary carbon particle concentrations. Environmental Quality Laboratory Report 23. https://resolver.caltech.edu/CaltechEQL:EQL-R-23
-
Han, S.H., Kim, Y.P. (2015) Long-term Trends of the Concentrations of Mass and Chemical Composition in PM2.5 over Seoul. Journal of Korean Society for Atmospheric Environment, 31(2), 143-156.
[https://doi.org/10.5572/KOSAE.2015.31.2.143]

-
Heo, S.J., Kwoun, J.Y., Lee, S.M., Kim, D.Y., Lee, T.J., Jo, Y.M. (2021) Spatial Concentration of Carbon Components in Indoor PM2.5 of School Classrooms in a Large City of Korea. Applied Science, 11, 7328.
[https://doi.org/10.3390/app11167328]

-
Ho, K.F., Cao, J.J., Harrison, R.M., Lee, S.C., Bau, K.K. (2004) Indoor/outdoor relationships of organic carbon (OC) and elemental carbon (EC) in PM2.5 in roadside environment of Hong Kong. Atmospheric Environment, 38, 6327-6335.
[https://doi.org/10.1016/j.atmosenv.2004.08.007]

-
Hodas, N., Loh, M., Shin, H.M., Li, D., Bennett, D., McKone, T.E., Jolliet, O., Weschler, C.J., Jantunen, M., Lioy, P., Fantke, P. (2016) Indoor inhalation intake fractions of fine particulate matter:review of influencing factors. Indoor Air, 26, 836-856.
[https://doi.org/10.1111/ina.12268]

-
Lee, C.S., Kim, H.H., Yu, S.D., Lee, J.S., Chang, J.Y., Gwak, Y.K., Son, H.R., Lim, Y.W. (2013) A survey of distribution for environment exposure in the activities space of elementary schools - Focused on PM10, PM2.5, Black Carbon, VOCs and Formaldehyde. Journal of Korean Society Indoor Environment, 10(4), 303-317.
[https://doi.org/10.11597/jkosie.2013.10.4.303]

-
Lim, J.M., Jeong, J.H., Lee, J.H., Moon, J.H., Chung, Y.S., Kim, K.H. (2010) The analysis of PM2.5 and associated elements and their indoor/outdoor pollution status in an urban area. Indoor Air, 21, 145-155.
[https://doi.org/10.1111/j.1600-0668.2010.00691.x]

-
Matta, A.C., Kang, C.M., Gaffin, J.M., Hauptman, M., Phipatanakul, W., Koutrakis, P., Gold, D.R. (2019) Classroom indoor PM2.5 sources and exposures in inner-city schools. Environment International, 131, 104968.
[https://doi.org/10.1016/j.envint.2019.104968]

-
Mohammadyan, M., Alizadeh-Larimi, A., Etemadinejad, S., Latif, M.T., Heibati, B., Yetilmezosy, K, Abdul-Wahab, S.A, Dadvand, P. (2017) Particulate air pollution at schools: Indoor-outdoor relationship and determinants of indoor concentrations. Aerosol and Air Quality Research, 17, 857-864.
[https://doi.org/10.4209/aaqr.2016.03.0128]

- NIOSH (1998) National Institute for Occupational Safety and Heealth (NIOSH):Elemental carbon (disel particulate) Method 5040, Issue 2. In NIOSH Manual of Analytical Methods, 4th Ed.
-
Oh, M.S., Lee, T.J., Kim, D.S. (2009) Source identification of ambient size-by-size particulate using the positive matrix factorization model on the border of yongin and suwon. Journal of Korean Society for Atmospheric Environment, 25(2), 108-121.
[https://doi.org/10.5572/KOSAE.2009.25.2.108]

-
Pallarés, S., Gómez, E., Martínez, A., Jordán, M.M. (2019) The relationship between indoor and outdoor levels of PM10 and its chemical composition at schools in a coastal region in Spain. Heliyon, 5, e02270.
[https://doi.org/10.1016/j.heliyon.2019.e02270]

-
Park, J.M., Lee, T.J., Kim, D.S. (2022) Physicochemical characteristics of PM2.5 based on long-term hourly data at national intensive monitoring sites in Korea. Asian Journal of Atmospheric Environment, 16(3), 2287-1160. https://asianjae.org/xml/33840/33840.pdf
[https://doi.org/10.5572/ajae.2022.033]

- Park, S., Yoon, D., Kong, H., Kang, S., Lee, C. (2021) A case study on distribution characteristics of indoor and outdoor particulate matter (PM10, PM2.5) and black carbon (BC) by season and time of the day in apartments. Journal of Environmental Health Sciences, 47, 339-355.
-
Shi, S., Chen, C., Zhao, B. (2017) Modifications of exposure to ambient particulate matter: Tackling bias in using ambient concentration as surrogate with particle infiltration factor and ambient exposure factor. Environmental Pollution, 220, 337-347.
[https://doi.org/10.1016/j.envpol.2016.09.069]

-
Sunyer, J., Esnaola, M., Alvarez-Pedrerol, M., Forns, J., Rivas, I., López-Vicente, M., Suades-González, E., Foraster, M., Garcia-Esteban, R., Basagaña, X., Viana, M., Cirach, M., Moreno, T., Alastuey, A., Sebastian-Galles, N., Nieuwenhuijsen, M., Querol, X. (2015) Association between Traffic-Related Air Pollution in Schools and Cognitive Development in Primary School Children: A Prospective Cohort Study. Plos Medicine, 12, e1001792.
[https://doi.org/10.1371/journal.pmed.1001792]

-
Tang, X., Zhang, X., Ci, Z., Wang, J. (2016) Speciation of the major inorganic salts in atmospheric aerosols of Beijing, China: Measurements and comparison with model. Atmospheric Environment, 133, 123-134.
[https://doi.org/10.1016/j.atmosenv.2016.03.013]

- U.S. Environmental Protection Agency (US EPA) (2012) Revised Air Quality Standards for Particle Pollution and Updates to the Air Quality Index (AQI). https://www.epa.gov/sites/default/files/2016-04/documents/2012_aqi_factsheet.pdf
-
Xu, H., Guinot, B., Shen, Z., Ho, K.F. (2015) Characteristics of Organic and Elemental Carbon in PM2.5 and PM0.25 in Indoor and Outdoor Environments of a Middle School: Secondary Formation of Organic Carbon and Sources Identification. Atmosphere, 6, 361-379.
[https://doi.org/10.3390/atmos6030361]

-
Zhang, G., Spickett, J., Rumchev, K., Lee, A.H., Stick, S. (2006) Indoor environmental quality in a ‘low allergen’ school and three standard primary schools in Western Australia. Indoor Air, 16, 74-80.
[https://doi.org/10.1111/j.1600-0668.2005.00405.x]


